
XRP Price Prediction: Momentum Reignites As Bulls Aim For $0.75
XRP price is gaining pace above the $0.550 resistance. The bulls seem to be aiming for a move above the $0.60 and $0.62 resistance levels.
XRP started a fresh increase above the $0.550 resistance level.
The price is now trading above $0.575 and the 100 simple moving average (4 hours).
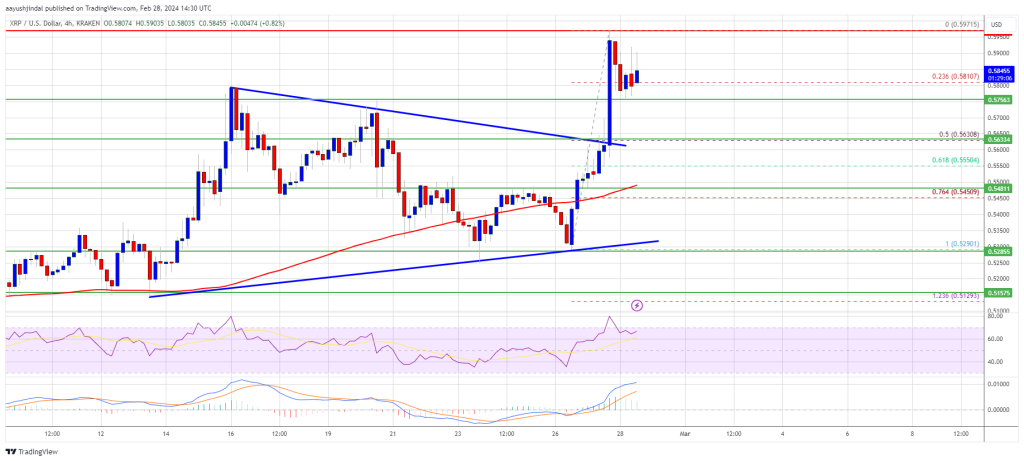
There was a break above a major contracting triangle with resistance at $0.560 on the 4-hour chart of the XRP/USD pair (data source from Kraken).
The pair could start a fresh rally if there is a close above the $0.60 resistance zone.
XRP Price Restarts Increase
In the past few days, XRP price recovered higher from the $0.530 zone. There was a move above the $0.545 and $0.550 resistance levels. However, the upside was less compared to Bitcoin and Ethereum.
There was a break above a major contracting triangle with resistance at $0.560 on the 4-hour chart of the XRP/USD pair. The pair traded as high as $0.5971, and it is currently consolidating gains. It tested the 23.6% Fib retracement level of the upward move from the $0.5290 swing low to the $0.5971 high.
Ripple’s token price is now trading above $0.575 and the 100 simple moving average (4 hours). On the upside, immediate resistance is near the $0.580 zone. The first key resistance is near $0.600, above which the price could rise toward the $0.620 resistance. A close above the $0.620 resistance zone could spark a strong increase.
Source: XRPUSD on TradingView.com
The next key resistance is near $0.650. If the bulls remain in action above the $0.650 resistance level, there could be a rally toward the $0.685 resistance. Any more gains might send the price toward the $0.70 resistance.
Another Decline?
If XRP fails to clear the $0.60 resistance zone, it could start another decline. Initial support on the downside is near the $0.575 zone.
The next major support is at $0.5630 or the 50% Fib retracement level of the upward move from the $0.5290 swing low to the $0.5971 high. If there is a downside break and a close below the $0.5630 level, the price might accelerate lower. In the stated case, the price could retest the $0.5350 support zone.
Technical Indicators
4-Hours MACD – The MACD for XRP/USD is now losing pace in the bullish zone.
4-Hours RSI (Relative Strength Index) – The RSI for XRP/USD is now above the 60 level.
Major Support Levels – $0.575, $0.563, and $0.5350.
Major Resistance Levels – $0.5950, $0.600, and $0.620.


