
Bitcoin Price Seems Unstoppable As BTC Bulls Aim For $48K
Bitcoin price is holding gains above the $45,000 resistance. BTC seems to be setting up for more gains above the $46,000 level in the near term.
Bitcoin extended its increase and traded close to the $46,000 level.
The price is trading above $45,000 and the 100 hourly Simple moving average.
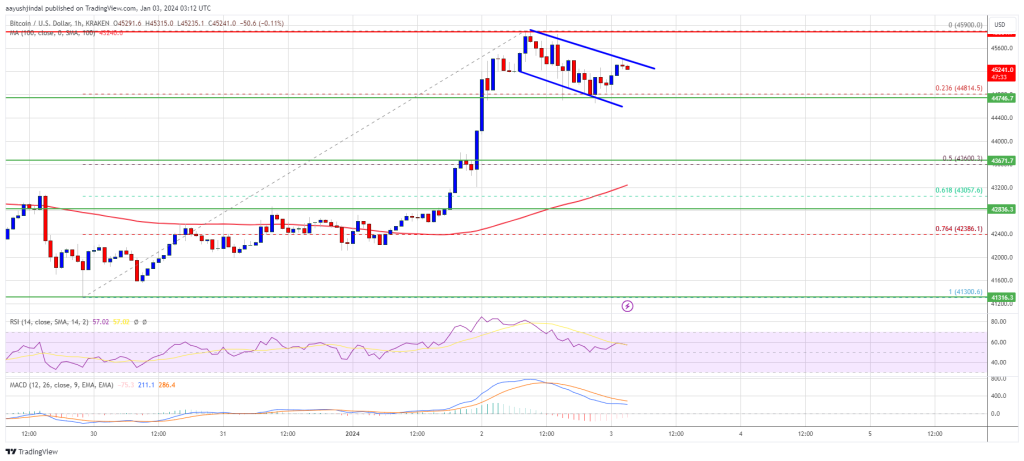
There is a key bullish flag forming with resistance near $45,300 on the hourly chart of the BTC/USD pair (data feed from Kraken).
The pair could start a fresh increase unless there is a correction wave below $44,800.
Bitcoin Price Eyes More Upsides
Bitcoin price started a fresh increase above the $44,000 and $44,500 resistance levels. BTC even broke the $45,000 level to move further into a bullish zone.
A new multi-week high was formed near $45,900 and the price is now consolidating gains. There was a minor downside correction from the $45,900 level. The price dipped below the $45,500 level. It even tested the 23.6% Fib retracement level of the upward move from the $41,300 swing low to the $45,900 high.
Bitcoin is now trading above $45,000 and the 100 hourly Simple moving average. On the upside, immediate resistance is near the $45,300 level. There is also a key bullish flag forming with resistance near $45,300 on the hourly chart of the BTC/USD pair.
Source: BTCUSD on TradingView.com
The first major resistance is $46,000. A close above the $46,000 level could send the price further higher. The next major resistance sits at $46,800. Any more gains above the $46,800 level could open the doors for a move toward the $48,000 level.
More Downsides In BTC?
If Bitcoin fails to rise above the $45,300 resistance zone, it could start a downside correction. Immediate support on the downside is near the $44,800 level.
The next major support is near $44,000. If there is a move below $44,000, there is a risk of more losses. In the stated case, the price could drop toward the $43,600 support or the 50% Fib retracement level of the upward move from the $41,300 swing low to the $45,900 high in the near term.
Technical indicators:
Hourly MACD – The MACD is now losing pace in the bullish zone.
Hourly RSI (Relative Strength Index) – The RSI for BTC/USD is now above the 50 level.
Major Support Levels – $44,800, followed by $44,000.
Major Resistance Levels – $45,300, $46,000, and $46,800.


