
Bitcoin Price Hints At Potential Correction, Buy The Dip?
Bitcoin price is still struggling to gain pace for a move above $35,000. BTC could correct a few points before the bulls attempt another increase.
Bitcoin is still struggling to clear the $35,000 resistance.
The price is trading above $34,150 and the 100 hourly Simple moving average.
There is a short-term rising channel forming with support near $34,280 on the hourly chart of the BTC/USD pair (data feed from Kraken).
The pair could correct lower toward the $34,000 zone before it attempts a fresh increase.
Bitcoin Price Eyes Fresh Increase
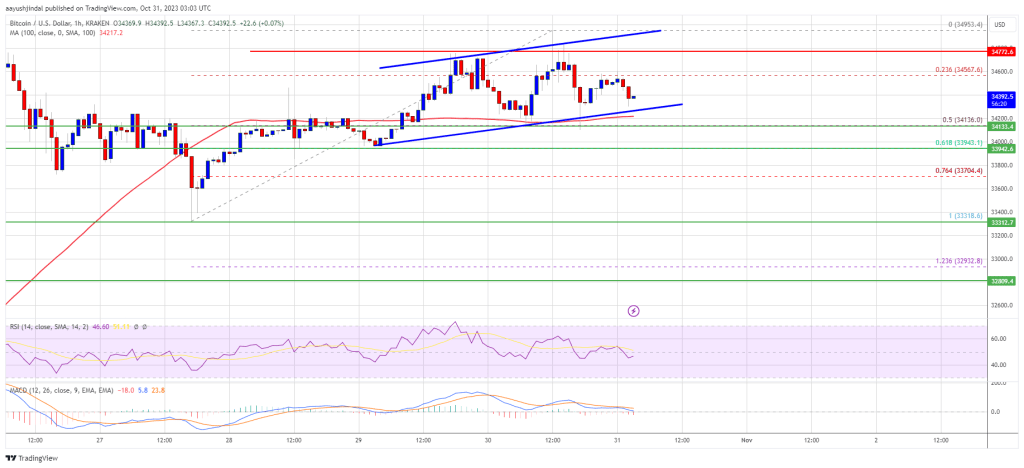
Bitcoin price remained strong above the $33,800 level. BTC formed a base and attempted another increase above the $34,500 resistance zone. It even spiked toward the main barrier at $35,000.
However, there was no upside continuation. The price formed a top near $34,953 and recently corrected lower. There was a move below the $34,600 level. The price declined below the 23.6% Fib retracement level of the upward move from the $33,319 swing low to the $34,953 high.
Bitcoin is now trading above $34,280 and the 100 hourly Simple moving average. There is also a short-term rising channel forming with support near $34,280 on the hourly chart of the BTC/USD pair.
On the upside, immediate resistance is near the $34,780 level. The next key resistance could be near $34,950 or the channel upper trend line. The main resistance is still near the $35,000 zone. A clear move above the $35,000 resistance might start a decent increase.
Source: BTCUSD on TradingView.com
The next key resistance could be $35,500, above which the price could test $36,200. Any more gains might send BTC toward the $36,500 level in the near term.
Dips In BTC?
If Bitcoin fails to rise above the $34,750 resistance zone, it could start a downside correction. Immediate support on the downside is near the $34,250 level and the 100 hourly Simple moving average.
The next major support is near the $33,950 level or the 61.8% Fib retracement level of the upward move from the $33,319 swing low to the $34,953 high. If there is a move below $33,950, there is a risk of more downsides. In the stated case, the price could decline toward the $33,400 level or even $33,200.
Technical indicators:
Hourly MACD – The MACD is now gaining pace in the bearish zone.
Hourly RSI (Relative Strength Index) – The RSI for BTC/USD is now below the 50 level.
Major Support Levels – $34,280, followed by $33,950.
Major Resistance Levels – $34,750, $34,950, and $35,000.


