
Ethereum Price Restarts Increase As Indicators Suggest Rally To $1,950
Ethereum price found support near $1,750 against the US dollar. ETH is again rising and attempting an upside break above the $1,850 resistance.
Ethereum remained well-bid above the $1,750 support zone.
The price is trading above $1,780 and the 100-hourly Simple Moving Average.
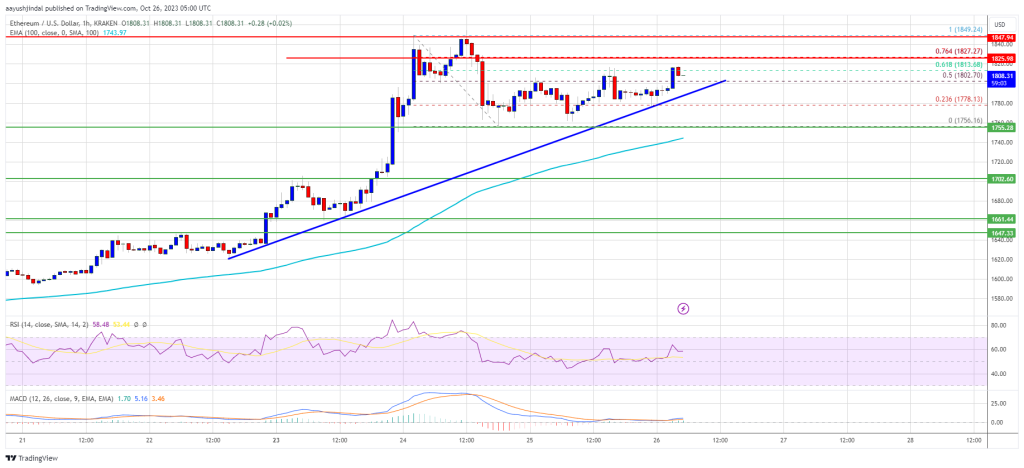
There is a key bullish trend line forming with support near $1,795 on the hourly chart of ETH/USD (data feed via Kraken).
The pair could continue to move up if it clears the $1,825 and $1,850 resistance levels.
Ethereum Price Could Restart Rally
Ethereum started a downside correction below the $1,800 level. ETH tested the $1,750 support where the bulls emerged. A low was formed near $1,756 and the price started a fresh increase, like Bitcoin.
There was a move above the $1,780 and $1,785 resistance levels. The price was able to climb above the 50% Fib retracement level of the downside correction from the $1,849 swing high to the $1,756 low. There is also a key bullish trend line forming with support near $1,795 on the hourly chart of ETH/USD.
Ethereum is now trading above $1,780 and the 100-hourly Simple Moving Average. On the upside, the price is facing resistance near the $1,825 level. It is close to the 76.4% Fib retracement level of the downside correction from the $1,849 swing high to the $1,756 low.
Source: ETHUSD on TradingView.com
The first major resistance is near the $1,850 zone. A close above the $1,850 resistance could spark another rally. The next key resistance is near $1,880, above which the price could accelerate higher. In the stated case, Ether could rise toward the $1,950 level. Any more gains might open the doors for a move toward $2,000.
Another Decline in ETH?
If Ethereum fails to clear the $1,825 resistance, it could start another decline. Initial support on the downside is near the $1,800 level and the trend line region.
The next key support is $1,750 and the last swing low. The main support is now forming near the $1,740 level and the 100-hourly Simple Moving Average. A downside break below the $1,740 support might send the price further lower. In the stated case, Ether could drop toward the $1,700 level. Any more losses may perhaps send the price toward the $1,660 level.
Technical Indicators
Hourly MACD – The MACD for ETH/USD is gaining momentum in the bullish zone.
Hourly RSI – The RSI for ETH/USD is now above the 50 level.
Major Support Level – $1,750
Major Resistance Level – $1,850


