Crypto Corner Café

Taste The Future

Blockchain

Ethereum Price Avoids Trend Reversal But Key Hurdle Still Intact

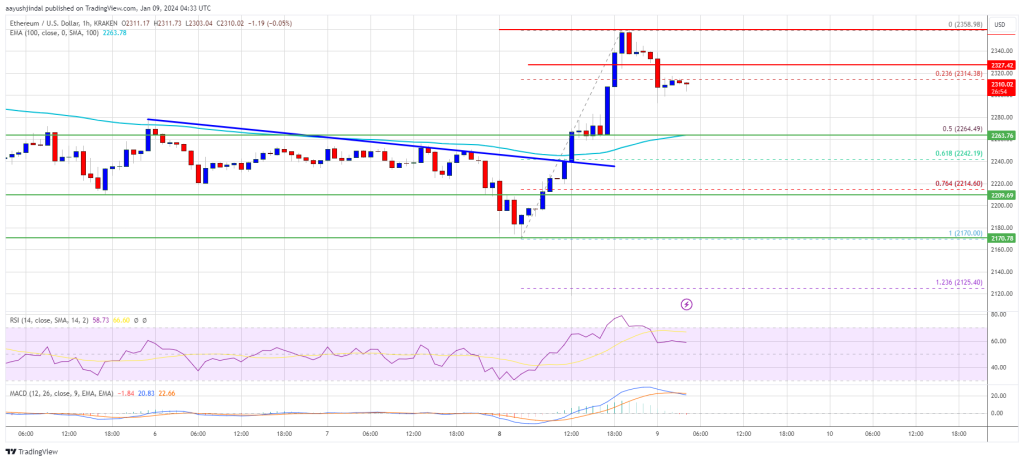
Ethereum price managed to stay above $2,170 and recovered losses. ETH consolidating and still facing many hurdles near $2,350 and $2,400.

Ethereum is attempting a fresh increase above the $2,300 resistance level.
The price is trading above $2,250 and the 100-hourly Simple Moving Average.
There was a break above a connecting bearish trend line with resistance near $2,245 on the hourly chart of ETH/USD (data feed via Kraken).
The pair could gain bullish momentum if there is a close above the $2,350 level.

Ethereum Price Regains Strength

Ethereum price extended its decline below the $2,200 level. However, ETH remained stable near the $2,180 and $2,170 levels. A low was formed near $2,170 and the price started a fresh increase, like Bitcoin.

There was a decent increase above the $2,240 level. There was also a break above a connecting bearish trend line with resistance near $2,245 on the hourly chart of ETH/USD. The pair climbed above the $2,320 resistance, but the bears were active near $2,350.

A high was formed near $2,358 and the price is now correcting gains. There was a minor decline below the $2,320 level. The price moved below the 23.6% Fib retracement level of the upward move from the $2,170 swing low to the $2,358 high.

ETH is now trading above $2,250 and the 100-hourly Simple Moving Average. If there is a fresh increase, the price might face resistance near the $2,350 level. The next major resistance is now near $2,400.

Source: ETHUSD on TradingView.com

The main uptrend hurdle sits at $2,450. A close above the $2,450 resistance could start a decent upward move. The next key resistance is near $2,540. If the bulls push Ethereum above $2,540, there could be a rally toward $2,720. Any more gains might send the price toward the $2,800 zone.

Another Decline in ETH?

If Ethereum fails to clear the $2,350 resistance, it could start a fresh decline. Initial support on the downside is near the $2,280 level.

The first key support could be the $2,260 zone or the 50% Fib retracement level of the upward move from the $2,170 swing low to the $2,358 high. A downside break and a close below $2,260 might send the price further lower. In the stated case, Ether could test the $2,170 support. Any more losses might send the price toward the $2,050 level.

Technical Indicators

Hourly MACDThe MACD for ETH/USD is losing momentum in the bullish zone.

Hourly RSIThe RSI for ETH/USD is now above the 50 level.

Major Support Level – $2,260

Major Resistance Level – $2,350

Read More
Blockchain

Bitcoin Price Rallies 5% and $48K Now Seems Imminent

Bitcoin price was able to clear the $44,500 and $44,700 resistance levels. BTC is up over 5% and might soon attempt a move toward $48,000.

Bitcoin is gaining pace above the $45,500 resistance zone.
The price is trading above $45,000 and the 100 hourly Simple moving average.
There was a break above a key contracting triangle with resistance near $44,000 on the hourly chart of the BTC/USD pair (data feed from Kraken).
The pair could continue to move up toward the $48,000 level unless there is a close below $44,000.

Bitcoin Price Starts Fresh Increase

Bitcoin price started a fresh increase above the $43,500 resistance zone. BTC gained bullish momentum above the $44,000 and $44,500 levels to move into a positive zone.

There was a break above a key contracting triangle with resistance near $44,000 on the hourly chart of the BTC/USD pair. The bulls pumped the price to a new multi-day high at $47,306 and the price is now consolidating gains.

Bitcoin is now trading above $45,000 and the 100 hourly Simple moving average. It is also above the 23.6% Fib retracement level of the upward move from the $43,208 swing low to the $47,306 high.

On the upside, immediate resistance is near the $47,000 level. The first major resistance is $47,200. A clear move above the $47,200 resistance could send the price toward the $48,000 resistance. The next resistance is now forming near the $48,800 level.

Source: BTCUSD on TradingView.com

A close above the $48,800 level could send the price further higher. The next major resistance sits at $49,250. Any more gains above the $49,250 level could open the doors for a move toward the $50,000 level.

Another Drop In BTC?

If Bitcoin fails to rise above the $47,200 resistance zone, it could start a fresh decline. Immediate support on the downside is near the $46,400 level.

The next major support is near $45,900. If there is a move below $45,900, the price could gain bearish momentum. In the stated case, the price could drop toward the $45,250 support or the 50% Fib retracement level of the upward move from the $43,208 swing low to the $47,306 high in the near term.

Technical indicators:

Hourly MACD – The MACD is now gaining pace in the bullish zone.

Hourly RSI (Relative Strength Index) – The RSI for BTC/USD is now above the 50 level.

Major Support Levels – $46,400, followed by $45,250.

Major Resistance Levels – $47,000, $47,200, and $48,000.

Read More
Blockchain

Former SEC Chair Affirms: ‘Nothing Left To Decide,’ Bitcoin ETF Approval Imminent

As anticipation builds around major asset managers’ potential approval of Bitcoin ETF applications, former US Securities and Exchange Commission (SEC) chair Jay Clayton has added his voice to the discussion. 

Clayton, who served as SEC chair from 2017 to 2020 during the Trump administration, expressed his belief in the inevitable approval of Bitcoin ETFs in a recent interview with CNBC.

Clayton Highlights Key Factors In Bitcoin ETF Approval

According to Clayton, approving Bitcoin ETFs is not a matter of if but when. He emphasized the robustness and efficacy of the Bitcoin trading market, stating that it has significantly improved over the past five years. 

Clayton also highlighted the importance of the technology supporting these ETFs, particularly the custody, creation, and redemption processes. 

Clayton views the ability to tokenize and digitize underlying assets as a major step forward, with implications beyond the crypto space. Clayton believes that this development has the potential to bring about significant changes in the broader financial industry.

Clayton’s recent comments align with his previous statements, demonstrating a consistent stance favoring Bitcoin ETF approval. 

During his tenure as SEC chair, Clayton expressed skepticism about the BTC market but acknowledged the emergence of reputable institutions in the crypto industry as a game-changing development. 

Clayton emphasized the efficiency of a spot Bitcoin ETF for investors. He noted that approving a Bitcoin Spot ETF would become difficult to resist if institutions can demonstrate their effectiveness compared to the futures market. 

Clayton also recognized the significance of institutional players entering the crypto industry, as their involvement lends credibility and addresses some of the SEC’s concerns regarding market manipulation.

Moreover, Clayton highlighted the increasing demand from retail investors to gain regulated exposure to Bitcoin through investment products. He also noted that reputable financial industry providers are eager to offer Bitcoin ETFs to the public. 

These factors underscore the market’s readiness for regulated investment vehicles that can provide broader access to cryptocurrencies while maintaining investor protections.

Trading Expected To Commence This Week

CNBC has reported that trading of Bitcoin ETFs could commence within days. The news aligns with former SEC Chair Jay Clayton’s optimistic outlook on Bitcoin ETF approval, adding to the growing anticipation surrounding these investment products. 

According to CNBC correspondent Kate Rooney, two sources close to the process have indicated that Wednesday will likely be the day of the ultimate approval. 

According to CNBC’s sources, this coincides with the application deadline for Ark Invest and 21 Shares, raising the possibility of a trading launch between Thursday and Friday. 

As the SEC receives updates on the filings, Rooney concluded that several applications are expected to be given the green light. 

Overall, the imminent approval would indicate a shift in acceptance of cryptocurrencies within the regulatory landscape and present an opportunity for investors to access Bitcoin through regulated investment vehicles. 

As of this writing, the excitement surrounding the approval has sent Bitcoin to the $46,900 mark, up more than 6.8% in the past 24 hours.

Featured image from Shutterstock, chart from TradingView.com 

Read More
Blockchain

Ethereum Poised For Breakout? Analyst Pinpoint Key Levels For Monumental Surge

So far, Ethereum appears to be showing signs of an impending bullish run, according to Crypto Tony, a renowned analyst in the crypto space. Crypto Tony suggests that Ethereum’s journey to bullish momentum could commence if it successfully maintains its position above the crucial level of $2,130.

Fortunately, the asset trades above this price level and appears to be climbing further above it, with its current trading price of $2,264 at the time of writing.

Key Levels For Major ETH Rally

The $2,130 price mark, as disclosed by Crypto Tony, is seen as a pivotal point for Ethereum, as maintaining this level could signal “strength and stability,” setting the stage for further gains.

This optimism further escalates should Ethereum reclaim the range high at $2,500, a price level Crypto Tony revealed that would reinforce the bullish sentiment in the Ethereum market. Notably, Crypto Tony’s bullish outlook aligns with the sentiments of other analysts in the crypto community.

$ETH / $USD – Update

The ETH range is simple. Remain above $2,130 and we are bullish .. Reclaim the range high at $2,500 and we are really bullish pic.twitter.com/YKOph2YbRY

— Crypto Tony (@CryptoTony__) January 8, 2024

For instance, Ali Chart, another notable crypto analyst, has identified $3,830 and $5,100 price levels as Ethereum’s following major targets based on the Market Value to Realized Value (MVRV) price bands.

For context, MVRV is a key on-chain metric or indicator that compares a cryptocurrency’s market value (market cap) to its realized value, offering an alternative approach to assess the network’s valuation by considering the price at which each unit last moved.

The MVRV ratio is a crucial indicator that can be utilized especially for gauging the relative valuation of a crypto asset like Ethereum. When the MVRV ratio is high, it often suggests that the cryptocurrency’s price may be overvalued, and when it’s low, the asset could be undervalued.

According to the #Ethereum MVRV Pricing Bands, the next key price targets for $ETH are $3,830 and $5,100! pic.twitter.com/cLo4crWkPF

— Ali (@ali_charts) January 1, 2024

According to a chart recently shared by Ali Chart on X, Ethereum is currently on an upward trajectory, with the next significant MVRV Pricing Bands at 2.4 and 3.2. These levels indicate that Ethereum may become overvalued, correlating to Ali’s price targets for Ethereum at around $3,830 and $5,100, respectively.

Ethereum Whale Movements Backs Bullish Sentiment

Adding to the bullish sentiments are recent whale movements. Spot On Chain has disclosed that an Ethereum whale, identified as ‘0x931’, made a significant purchase of 21,192 ETH, valued at approximately $48 million, at an average price of $2,265.

This accumulation of ETH is a strong indicator of confidence in Ethereum’s future performance, as the whale has now held roughly 79,500 ETH since January 2023, sitting on an unrealized profit of $36.84 million.

Moreover, last week’s on-chain data from Santiment revealed that Ethereum’s largest private wallets now hold a record 56.25 million ETH, representing 46.8% of the crypto’s total circulating supply. This concentration of ETH in large wallets could be interpreted as a sign of long-term holding strategies among major investors.

Amid these developments, Ethereum has been showing signs of recovery from its recent retracement. Despite a week of decline, the altcoin is beginning to exhibit an upward trajectory, with a near 2% increase in the past 24 hours, trading at around $2,272.

This recovery is further evidenced by a surge in trading volume, which has surged from a low of $11 billion last Monday to over $20 billion, indicating a possible increasing buying activity.

Featured image from Unsplash, Chart from TradingView

Read More
Blockchain

Crypto Analyst Identifies XRP Bear Flag To Trigger A Massive Crash To $0.07

XRP, like the rest of the crypto market, is seeing an active retrace that has sent prices back toward levels not seen since last year. As anticipation around a potential Bitcoin Spot ETF approval builds up for this week, expectations are that this retrace will be short-lived. However, not everyone is bullish on a potential recovery as one crypto analyst expects the price of the altcoin to see a massive crash going forward.

XRP Massive Bear Flag Appears

Crypto analyst Bitgolder took to TradingView to share an extremely bearish analysis of the XRP price. This analysis identifies the presence of a bear flag, one of the worst ones seen in the altcoin’s chart in recent times.

As Bitgolder explains, the XRP price chart looks very bad, leading to the obvious bear flag. Some of the reasons for the formation of this bear flag are the fact that there has been a volume drop over the last week, as well as a decline in interest from investors as the altcoin has failed to live up to expectations following Judge Analisa Torres’s ruling that programmatic XRP sales do not qualify as securities.

The crypto analyst explained that the recent price bounce that the coin’s price saw over the last few weeks was in fact not bullish. Rather, it “was just an extended bounce for wave B of this correction from XRP top.” The analyst is also convinced of the weakness being exhibited by XRP, especially given the fact that the altcoin has failed to make a new all-time high in the last bull market while other coins were rallying.

Bitgolder warns investors of a slow bleed that is coming for the XRP price despite how bullish the community seems to be. “It’s going to take a while to bleed out because of how many bag holders there are and how much silly YouTubers keep pumping this thing,” Bitgolder warned. “It’s unfortunate that many are going to lose their shirts on this thing.”

Price Crash To ‘Single Digit Pennies’

Following the slow bleed-out predicted by Bitgolder, the analyst also expects a further dump that will take the price even lower, even down into the single-digit pennies. The chart shared in the analysis shows an initial decline to $0.39. But then a further dump puts the XRP price as low as $0.07.

The reason behind this dump, according to the analyst, will be the fact that the United States Securities and Exchange Commission (SEC) will eventually win out over Ripple in court. Bitgolder believes that XRP will eventually be considered an unregistered security. Either that or the US SEC will file another lawsuit against the crypto firm, which will lead to investors eventually losing faith and dumping their coins.

I used to think that maybe XRP could do some amazing things but after doing more research and looking into on chain metrics I am now convinced this was the biggest pump and dump in history.

However, the analyst also points out that it may not be a straight dump as XRP could still shoot back up to the $0.7 territory once more, which is the top of the bear flag. But Bitgolder refers to this surge as a takeout that would see the rug pulled from under investors once more. “It is hitting some really strong resistance right now so I’m not sure if it can actually break through this,” the analyst concluded.

Read More
Blockchain

Bitcoin Correlation To Nasdaq Continues To Be Negative: What It Means

Data shows the Bitcoin correlation to the Nasdaq has continued to be negative since December. Here’s what this means for the cryptocurrency.

Bitcoin 60-Day Correlation To Nasdaq 100 Is Negative Right Now

In a new post on X, the analytics firm Kaiko has discussed what the trend in the correlation between BTC and Nasdaq has looked like recently. The “correlation” here refers to a metric that keeps track of how tied together the prices of two commodities have been over a given period.

This period can naturally be of any length, but in the context of the current topic, the 60-day correlation is of interest. This indicator version measures the prices’ dependence on each other during the past two months.

When the value of this metric is greater than zero, it means that the price of one asset has been reacting to the other by moving in the same direction. The closer the indicator is to one, the stronger this relationship.

On the other hand, values under zero suggest some correlation between the two assets, but it has been a negative one. This means that the assets have reacted to each other by moving in the opposite direction. In this case, the extreme point is -1, so the closer the indicator is to this mark, the stronger the correlation between the prices.

Lastly, the correlation being exactly zero implies that there is no correlation whatsoever between the two assets. In mathematics, such a condition occurs when two variables are independent.

Now, here is a chart that shows the trend in the 60-day correlation between Bitcoin and Nasdaq 100 over the past year:

As the above graph shows, the 60-day correlation between Bitcoin and Nasdaq is shown in percentage here, with 100% corresponding to a value of 1.

From the chart, it’s apparent that the metric’s value was in a state of overall gradual decline during 2023, up until the final couple of months of the year, when the metric took an especially sharp dive.

Some amount of positive correlation had existed between the two assets before this plummet, but following it, the 60-day correlation took to negative values. However, the indicator remained close to the 0% mark, implying that the two only had a slight negative relationship.

The correlation had started surging and reached almost exactly 0% for a brief period just earlier, but the metric has since again come down and assumed slight negative values.

It would appear that BTC has kicked off 2024 slightly, moving against the traditional markets, which could set the stage for the cryptocurrency to go on and explore its territories this year.

BTC Price

At the time of writing, Bitcoin is trading around the $44,800 mark, up over 5% over the past week.

Read More
Blockchain

Forbes Says Spot Bitcoin ETF Approval Will Send BTC Price To $80,000

Global media company Forbes has published a column predicting a staggering $80,000 price surge for Bitcoin following the approval of Spot Bitcoin ETFs by the United States Securities and Exchange Commission (SEC).

Bitcoin To Rise $80,000

American business magazine and global media company Forbes has recently released a report emphasizing the massive impact the approval of a Spot Bitcoin ETF would have on the price of BTC. According to the publication, the price of Bitcoin could surge as high as $80,000 by the end of 2024. 

The analysis was disclosed by MarketWatch from crypto analysts at AllianceBernstein, one of the largest investment companies. According to analysts Gautam Chhugani and Mahika Sapra, Bitcoin’s price could skyrocket to $80,000 if the US SEC approves Spot Bitcoin ETF applications. 

The crypto experts have also highlighted other factors that could propel the price of Bitcoin to $80,000 including the upcoming Bitcoin halving event in April and growing demand from companies. 

“We expect 2024 to be a breakout inflection year for crypto. Bitcoin ETF flows build-up could be gradual, but the applicants will be fighting hard to get a lead into this massive asset accumulation game, tuning up advertising and Bitcoin branding leading to a snowball effect,” the analysts said. 

AllianceBernstein crypto experts have also predicted approximately $5 billion flowing into Spot Bitcoin ETFs during the first half of 2024. Their analysis suggests the second half may see double inflows of $10 billion, with projections indicating that BTC could attain a $1.5 trillion market cap before the year ends. 

SEC Caution Against FOMO Before BTC ETF Verdict

As the crypto space is gearing up for the US SEC’s final decision on Spot Bitcoin ETF applications on January 10, the regulator has published a report cautioning investors against the Fear Of Missing Out (FOMO) investments. 

In the report which was published in an X post by the US SEC’s Office of Investor Education and Advocacy on January 6, the US SEC highlighted all the negative effects of succumbing to FOMO, offering guidance on how to avoid or overcome the feeling. The report also provided advice on ways to mitigate investment risks and maneuver volatile market swings. 

“Say “NO GO to FOMO” (fear of missing out). Just because others might buy a particular investment, doesn’t mean it’s the right opportunity for you,” the SEC said. 

The regulator explained that FOMO can be a hard feeling to fight. However, it urged investors to always apply willpower when making investment decisions. “As you make investment decisions keep this phrase in mind, “NO GO to FOMO,” the regulator concluded.

Read More
Blockchain

Bitcoin Price Breaks Through $47,000, Bullish Sentiment Builds With Anticipation Of ETF Approval

With the Bitcoin price soaring to new highs, the cryptocurrency community is excitedly buzzing as all signs point towards an imminent approval of the highly anticipated Bitcoin Exchange-Traded Fund (ETF) applications. 

This positive sentiment has propelled the Bitcoin price past the $47,100 mark, reaching levels not seen since April 2022 and inching closer to the coveted $50,000 milestone and its all-time high (ATH) of $69,000.

SEC Fast-Tracks Bitcoin ETF Review

Earlier this morning, several prominent players in the financial industry submitted their final registration of securities amendments for a Spot Bitcoin ETF. 

The list of applicants includes VanEck, Bitwise, Fidelity, Valkyrie, Franklin, Ark Invest, Grayscale, BlackRock, WisdomTree, and Invesco Galaxy. This development has further fueled the bullish Bitcoin price action.

In recent updates regarding the Bitcoin ETF applications, James Seyffart, an ETF expert at Bloomberg, revealed that the 19b-4 filings were pouring onto the SEC website. 

Although the process typically takes a few days to a couple of weeks, this influx of filings indicates that the SEC is expediting its review for this week. 

It is worth noting that the timeframe of January 8th to 10th has been closely watched by industry observers, and the accelerated pace of the SEC’s actions during this period adds to the anticipation surrounding the Bitcoin ETF approval.

Standard Chartered Expects $200,000 Bitcoin Price

As the Bitcoin price continues its upward trajectory, accompanied by widespread anticipation of imminent ETF approval, British multinational bank Standard Chartered has made a significant statement

The bank believes that ETF approval will serve as a pivotal catalyst for Bitcoin’s price surge, heralding a transformative moment for institutional participation in the cryptocurrency. 

Standard Chartered expects this approval to drive substantial inflows and contribute to significant price gains for Bitcoin.

Standard Chartered views the approval of Bitcoin ETFs as a watershed moment in normalizing institutional investment in Bitcoin. With regulatory clearance for ETFs, institutional money is expected to pour into the cryptocurrency market, further validating Bitcoin as an asset class.

Standard Chartered predicts that the price gains resulting from the approval of spot Bitcoin ETFs in the United States will be of a similar magnitude as witnessed previously. 

However, the bank anticipates these gains to materialize over a shorter period of one to two years, considering the accelerated development of the Bitcoin ETF market. 

In line with their end-2024 projection of Bitcoin reaching $10,000, Standard Chartered expects the approval of ETFs to drive inflows that could potentially elevate the price to around $20,000 by the end of 2025.

Bitcoin has reached the $47,100 mark, up a staggering 6.5% in the last 24 hours alone, coupled with an 8.7% increase in the last seven days.

Featured image from Shutterstock, chart from TradingView.com

Read More
Blockchain

Was Solana A Q4 2023 “Bubble” That Has Popped?

The crypto market has recently been a roller coaster, especially in H2 2023. Solana, a high-throughput blockchain, emerged as one of the best performers in the top 10 coins by market cap.

In Q4 2023, Solana soared, reaching highs of around $125 before cooling off to spot rates. However, some think the uptrend is over, with SOL edging lower under increasing liquidation pressure.

The Solana Bubble Has Popped, Is This True?

Lido.eth, while taking to X on January 7, said Solana is a “Q4 2023 bubble” that has “already popped.” The analyst added that this formation doesn’t mean SOL is “worthless or won’t be used anymore.” However, based on Lido.eth’s assessment, the Solana “growth story has ended,” calling serious questions into the project’s immediate potential. 

In H2 2023, Solana grew on renewed interest in the high-performance blockchain. Propelled by rising activity in decentralized finance (DeFi) and non-fungible token (NFT) scenes, SOL reversed losses recorded in November 2022.

Moreover, as the crypto community tracked the Securities and Exchange Commission (SEC) and whether they would approve the first spot Bitcoin ETF, altcoins, including SOL, became major beneficiaries.

Arthur Hayes, the founder of the cryptocurrency exchange BitMEX, also believes that the Solana rally is over. In December 2023, Hayes tweeted that he had rotated funds from Solana to Ethereum, citing “divine inspiration.” The BitMEX co-founder also said ETH may rally to reach $5,000 but without giving a specific timeline as to when this lofty target will be reached.

SOL Remains In An Uptrend, Back To $125?

Despite these bearish sentiments, some Solana supporters believe the platform has a “bright future.” They point to the upcoming launch of the Firedancer client. 

This validator client will make the network more robust and increase efficiency. It will aim to decentralize Solana further, making it more reliant by eliminating weak points resulting from client concentration. From a price action perspective, continuing the overall crypto uptrend could also buoy SOL prices in 2024.

Looking at the Solana price chart, the uptrend remains, but sellers dominate, at least in the short term. To quantify, SOL is down 30% from the December 2023 peak when it topped at around $125. 

With prices trending inside the bear bar of January 3, sellers have the upper hand from an effort-versus-result perspective. For the uptrend to resume, there must be a clear, high-volume close above $100. If not, steep losses below $85 might trigger a sell-off that could price toward $60 or worse.

Read More
Blockchain

A Bullish Beginning? $151 Million Poured Into Crypto Funds In 2024’s First Week

The first week of 2024 marked a notable milestone in crypto asset investments. Investment products in this particular sector witnessed inflows amounting to $151 million, according to a recent report from CoinShares.

Crypto Asset Funds Sees Surge In Inflows

This $151 million surge in inflow, as highlighted by James Butterfill, Head of Research at CoinShares, is particularly noteworthy in light of the Grayscale vs. US Securities and Exchange Commission (SEC) lawsuit, with these inflows contributing to a total of $2.3 billion since the case began in October 2022.

This amount accounts for 4.4% of the firm’s total managed assets. Even without a spot exchange-traded fund (ETF) launch in the US, Butterfill revealed that American exchanges contributed to over half of these inflows, at 55%. German and Swiss exchanges followed, contributing 21% and 17% of the inflows, respectively.

Bitcoin emerged as the leader in investment inflows, amassing $113 million. This substantial sum equates to 3.2% of the total assets under management (AuM) in the last nine weeks.

James Butterfill pointed out an interesting trend that challenges the anticipation of the US SEC approval of a spot Bitcoin ETF being a “buy the rumor, sell the news” event. Butterfill noted in the report:

If many truly believed that launch of the [spot] ETF in the US would a “buy the rumour, sell the news” event, we surely would expect to see inflows into short-bitcoin ETPs, instead, outflows over the last 9 weeks have amounted to US$7m.

Notably, this is because “buy the rumor, sell the news” implies that investors buy assets ahead of an anticipated event (like the spot ETF launch) and sell them when the actual event occurs, often leading to a price decline.

However, the observation here by Butterfill is quite the opposite. Instead of seeing inflows (more investment) into short-Bitcoin exchange-traded products (ETPs) (which benefit from a decline in Bitcoin’s price), there have been outflows amounting to $7 million over the last nine weeks.

This indicates that investors might not expect a significant price drop following the spot Bitcoin ETF launch in the US, contradicting the “buy the rumor, sell the news” expectation.

Ethereum And Altcoins: A Mixed Bag Of Sentiments

Ethereum’s performance in the crypto asset investment space has also been noteworthy. The second-largest crypto by market cap saw inflows of $29 million, with the last nine weeks bringing in $215 million. This influx indicates a significant shift in investor sentiment towards Ethereum.

While Solana, on the other hand, faced outflows amounting to $5.3 million, Cardano, Avalanche, and Litecoin witnessed inflows. Cardano saw $3.7 million, Avalanche $2 million, and Litecoin $1.4 million in inflows. The blockchain equity sector also started the year on a strong note, recording inflows of $24 million in the past week.

Despite Bitcoin’s dominance in inflows, the flagship crypto has recently experienced a net outflow of $32.8 million, with short Bitcoin investment products also seeing a minor outflow last month.

However, Bitcoin’s recent $113 million inflow has shown the asset’s move to rebound. Even in price performance, Bitcoin has increased by 5.2% over the past week and appears to be continuing its upward trajectory by 1.1% in the first 24 hours, with its trading price nearing the $45,000 mark.

Contrastingly, Ethereum, after a 2% decline over the past week, is showing signs of recovery, increasing by nearly 1% in the past day. Other altcoins such as Solana, Cardano, Avalanche, and Litecoin have been less fortunate, experiencing significant losses, with Avalanche and Cardano being the top losers, down by 27.3% and 17% in the past week.

Litecoin and Solana, though also in the red, have seen slightly lesser declines. Solana is down by 10% over the past week and 1.6% in the past 24 hours, while Litecoin mirrors this trend, down by 10.8% over the week and 0.4% in the last day.

Featured image from iStock, Chart from TradingView

Read More