Crypto Corner Café

Taste The Future

Blockchain

Analyst’s Crystal Ball: Bitcoin Price Targets $600,000 After ETF Approval

Bullish tremors shook the cryptocurrency world today as Bitcoin, fueled by the historic approval of spot ETFs and a bold prediction by analyst Michaël van de Poppe, appears poised for a potential moonshot.

Van de Poppe, whose pronouncements carry weight in the digital realm, envisions an ascent of the world’s leading cryptocurrency to staggering heights – a price range of $300-$600K within the current cycle.

Related Reading: Bitcoin ETF: Navigating The Promise And Pitfalls Of Mainstream Adoption

ETF Excitement Sparks Bitcoin Trading Surge

This electrifying forecast sent a ripple of excitement through the crypto community, reflected in the top coin’s vibrant trading volume. Up a whopping 35%, the $51.7 billion figure paints a vivid picture of investor interest piqued by the ETF developments.

Range is defined.
$48K has been reached, perhaps we’ll go there again with the dealflow on the ETF approval today for #Bitcoin.

Dips at $36-40K are amazing to get.

Perhaps we’ll go to $300-600K this cycle. pic.twitter.com/C0SSroiYGa

— Michaël van de Poppe (@CryptoMichNL) January 11, 2024

Traders were quick to capitalize on the bullish sentiment, driving substantial price movements and creating a dynamic market atmosphere. The surge in trading activity not only underscores the immediate impact of the ETF forecast but also highlights the growing influence of institutional and retail investors alike.

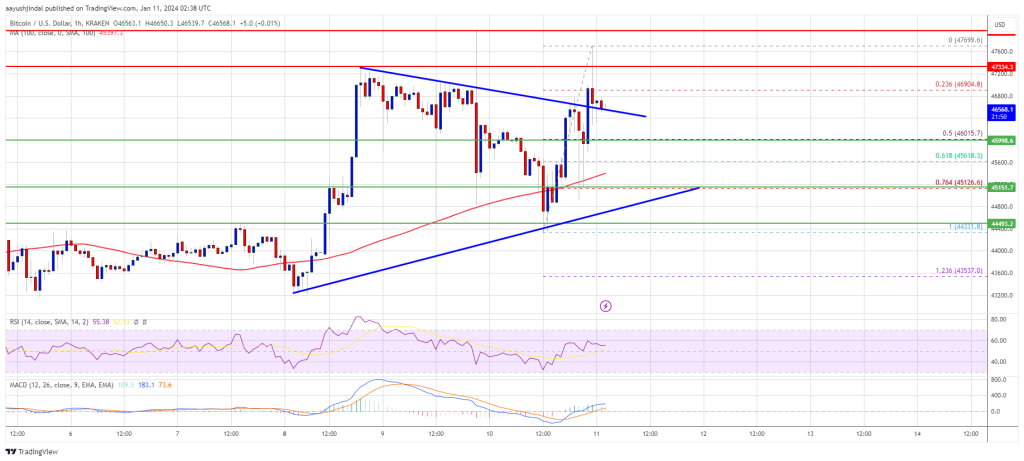
While Bitcoin’s current price of $46,286 shows a modest daily gain, its 9.72% monthly surge hints at an underlying anticipation.

The catalyst for this optimism lies in the January 10th SEC decision to greenlight several spot Bitcoin ETFs.

This long-awaited move removes a barrier for many mainstream investors, allowing them to participate in the Bitcoin story without directly holding the digital asset. It’s akin to opening a new door, inviting a fresh wave of potential capital into the crypto ecosystem.

However, amidst the celebratory mood, a note of caution resonates from SEC Chair Gary Gensler. While acknowledging the ETF approval, he reminds investors of the crypto’s inherent risks and the need for careful consideration before diving into the volatile cryptocurrency waters.

2⃣ Investments in crypto assets also can be exceptionally risky & are often volatile. A number of major platforms & crypto assets have become insolvent and/or lost value. Investments in crypto assets continue to be subject to significant risk.

— Gary Gensler (@GaryGensler) January 8, 2024

ETF Milestone: Bitcoin’s Symbolic Validation Unfolds

This serves as a crucial reminder for all, seasoned veterans and newcomers alike, to approach their investments with prudent risk management.

The ETF launch isn’t just about new access. It’s a symbolic validation, with industry giants like Grayscale BTC Trust, Hashdex BTC ETF, and Bitwise ETF receiving the SEC’s nod. This marks a significant milestone, solidifying cryptocurrency’s place in the wider financial landscape.

Featured image from iStock

Read More
Blockchain

Bitcoin ETF Approval Triggers $1.2 Billion Trading Volume And New Highs For BTC Price

In a highly anticipated move, the United States Securities and Exchange Commission (SEC) approved all 11 Bitcoin ETF applications, and the market response has been nothing short of remarkable. The approval has led to significant trading volume and propelled Bitcoin to a new 22-month high.

Within minutes of the Bitcoin ETFs going live, Bitcoin surged over 8% to reach $48,400, representing a new record since the end of the crypto bear market. The early price movement aligns with the predictions made by the majority of experts in the crypto industry.

Bitcoin ETF Trading Makes Spectacular Debut

Bloomberg ETF expert James Seyffart reported an astonishing $1.2 billion in trading volume for spot Bitcoin ETFs within 30 minutes of trading. Seyffart captured the excitement with his “Cointucky Derby” analogy, highlighting the performance of different ETFs.

Grayscale’s GBTC Bitcoin Trust took the lead in the “Cointucky Derby,” recording an impressive trading volume of $446 million in the initial minutes. It was closely followed by BlackRock’s Bitcoin Trust, which achieved a trading volume of $388 million within the first half-hour.

Fidelity secured the third spot with a trading volume of $230 million, outperforming Hashdex and Wisdom Tree, which recorded $1 million and $1.1 million in trading volume, respectively.

While the exact breakdown of the trading volume remains uncertain, Seyffart noted that the evening’s data might provide more insights. 

However, the Bloomberg ETF expert speculated that a significant portion of the trading volume could be attributed to new flows into the ETFs. Additionally, he suggested that a notable portion of GBTC’s trading volume might be due to outflows.

Is Bitcoin On A Clear Path To $50,000?

With the Bitcoin ETF race in full throttle, Bitcoin appears to be on a promising trajectory toward the $50,000 milestone, which could serve as a significant catalyst for Bitcoin bulls and the broader crypto industry.

Currently, having surpassed the $48,000 mark, Bitcoin’s price has reached a level where minimal resistance levels are hindering its ascent to $50,000. 

The next notable hurdle lies well above $50,700, followed by potential attempts to reach $53,000. Given the expected spot buys in the Bitcoin market following the approval of Bitcoin ETFs, combined with a considerable separation between major resistance lines, these price levels may be easily breached.

Once beyond the $50,000 threshold, Bitcoin could potentially progress to $51,000, then $53,000, and subsequently $56,000, before ultimately setting its sights on the highly anticipated $60,000 milestone. 

This series of price targets may be readily attainable for the largest cryptocurrency in the market, as it navigates through the anticipated market dynamics.

Ultimately, the SEC’s approval of the Bitcoin ETFs has brought renewed optimism to the market, with investors and industry experts closely monitoring the impact of these ETFs on the broader cryptocurrency landscape. 

The surge in trading volume and Bitcoin’s impressive price movement signify growing interest from investors seeking regulated and traditional investment avenues in the cryptocurrency market.

Featured image from Shutterstock, chart from TradingView.com

Read More
Blockchain

2024 Bitcoin Preview: Crypto Analyst Weighs In On BTC Price Action

Amid the excitement surrounding the approval of Bitcoin Spot Exchange-Traded Funds (ETFs), Polish crypto analyst Adrian Zduńczyk has shed his insights on the price action of BTC in 2024 and beyond.

Bitcoin Price Action In 2024 And Beyond

Zduńczyk, who is the Chief Executive Officer (CEO) of Birb Nest shared his insights in a recent interview with Thinking Crypto founder Tony Edward. In the interview, Zduńczyk revealed his short-term expectations for Bitcoin, the impact of ETF approval, and post-halving expectations for price.

Zduńczyk began by drawing attention to the recent surge in Bitcoin prices while also noting a minor decline. He emphasized the significance of differentiating between speculations, expectations, and actual trading.

He further talked about the use of technical indicators to spot possible market reversals. These include the rate of change and the Relative Strength Index (RSI).

Zduńczyk noted how the market trend has persisted, pointing out crucial metrics such as the 200-day moving average. According to him, the 200-day moving average has been indicating favorable trends since the year started. The price of Bitcoin has increased by a notable 190% year to date, despite a slight correction. This indicates the strength of the bull market that has been present since January.

When asked about the impact of Bitcoin spot ETF on the asset’s price, he highlighted seasonal trends in Bitcoin’s performance by establishing a correlation with historical data. He explained that he would rather go with the facts than opinions. This is because “it is difficult to comment on opinions,” which by definition is “different from the facts.”

Due to this, Zduńczyk has suggested that the community should focus on the facts this time rather than opinions. This is because facts rely on seasonal studies and prices do the same.

Observing the upward tendency in January over time, he provided an explanation of the seasonal pattern in the January barometer. As a result, he proposed an 80% chance of a favorable year if January ends well.

All-Time High Price Target Post BTC Halving

Zduńczyk provided insights into the possibility of Bitcoin reaching a new all-time high in 2025. He made this claim after analyzing its past four-year cycles and their relationship to the presidential stock market cycle.

The CEO stated that Bitcoin has always experienced “powerful rallies” after each halving. He further backed up his claims with a chart demonstrating BTC price rallies since the halving began.

Furthermore, Zduńczyk highlighted that it would not be shocking to see a three-to-five-fold increase following the halving price. However, he has expressed caution as no one knows exactly how high Bitcoin will go.

So far, Zduńczyk predicts an all-time high price for BTC between $150,000 to $200,000 post-halving. In addition, he stated that the trends are unprecedented as the price could go higher than that or even lower.

Read More
Blockchain

Is Cardano The Next Solana? Institutional Investors Clamor For ADA Exposure

Crypto asset investment products started the year on a positive note, with Cardano making a comeback despite going on a price decline last week. According to the latest digital asset fund flow from CoinShares, crypto products saw total inflows of $151 million in the first week of 2024. 

Unsurprisingly, a larger part of this inflow went into Bitcoin, with Ethereum closely following behind. However, Cardano products also picked up steam during the week, attracting notable inflows compared to other altcoins. 

Cardano Attracting Institutional Altcoin Investors

Institutional investors poured a notable $3.7 million into Cardano-based investment products last week, far greater than its average in 2023. Aside from Ethereum, which received a $29.6 million net inflow, Cardano saw the most inflow among altcoins, followed by Avalanche with $2 million.

Litecoin and XRP also saw modest inflows of $1.3 million and $0.9 million respectively, while multi-asset products received a net inflow of $5.4 million. 

It would seem most of the attention Solana received in 2023 was diverted into Cardano in the week. According to previous weekly reports, Solana frequently saw the most weekly inflow in the last quarter of 2023, even surpassing Bitcoin and Ethereum at some point. 

However, it would seem this sentiment failed to show itself in the first week of the year, as data from CoinShares showed Solana registered a net flow of $5.3 million. Similarly, Short Bitcoin products saw a net outflow of $1 million, pushing its total outflows over the last nine weeks to $7 million.

As stated earlier, Bitcoin received the most inflows. Bitcoin started the year with a weekly net inflow of $113 million, and inflows over the last nine weeks representing 3.2% of assets under management. Blockchain equities have also had a good start to the year, seeing US$24m inflows over the last week.

In terms of geographical location, the US saw the most activity. Exchanges in the country saw a weekly net inflow of $83 billion, representing 55% of the total inflow. Germany and Switzerland followed with $32.5 million and $24.9 respectively, representing 21% and 17% of the total inflow.

What’s Next For ADA?

The report from Coinshares attributes the inflow to proponents of spot Bitcoin ETFs who continue to push a bullish sentiment for the cryptocurrency pending approval in the US. Now that these ETFs have been approved, it is up to the market to determine what they bring to the table.

Cardano has also largely benefited from a steady growth in its ecosystem, development activity, and in DeFi. At the time of writing, Cardano (ADA) is trading at $0.5926. The crypto has outperformed most large market cap altcoins in the past 24 hours and is up by 15.55% in the timeframe. According to various predictions, Cardano (ADA) is set for a surge in 2024 with one analyst forecasting a price target of $6.

Read More
Blockchain

Bulls Charge As Ethereum Barrels Past $2,600 – Is An ETF The Secret Weapon?

Ethereum (ETH) continued its upward trajectory Wednesday, clocking a 10% gain in 24 hours to breach past the vaunted $2,600 mark. Market watchers attribute this surge to a confluence of factors, primarily fueled by anticipation of a forthcoming Ethereum exchange-traded fund (ETF) in the wake of the expected approval for a Bitcoin ETF in the US.

In a historic move that cryptocurrency aficionados hope will bring more individual and institutional investors into the market, the US Securities and Exchange Commission has approved the first spot bitcoin exchange traded funds on Thursday.

Ethereum ETF Buzz Sparks Strategic Moves

“There’s a noticeable trend towards frontrunning the ether ETF,” noted Alex Onufriychuk, CEO of Kaminari, in a Telegram message. This sentiment aligns with the prevailing belief that Ethereum, the second-largest cryptocurrency by market cap, would be the next candidate for an ETF after Bitcoin.

Adding fuel to the fire, a prominent investor, dubbed a “whale” in the crypto universe, made a strategic move by transferring 9,705 ETH (nearly $23 million) from Binance to Compound. This was followed by a 12 million Tether (USDT) loan, seemingly used to further accumulate ETH. The whale subsequently executed three profitable ETH transactions, netting roughly $5 million.

This decisive action signaled two things: confidence in Ethereum’s future and the potential for profit-taking, which could introduce short-term volatility. Despite the risk, the whale’s activity bolstered positive market sentiment.

Further validating this optimism, Ethereum’s network metrics experienced a surge. Both network growth and token velocity saw increases, indicating heightened interest from new addresses and more token movement. These on-chain metrics paint a promising picture for ETH’s future.

ETH Futures Surge Amid ETF Optimism

Also adding to the bullish case, Open Interest for ETH futures contracts jumped 15% in recent days, reaching $4.57 billion at the time of writing. This signifies more traders entering the market and anticipating significant price gains following a potential ETF approval.

According to reports, crypto traders expect Ethereum’s price to rise after a favorable ETF judgment, even though Bitcoin is getting more attention in the media. If this situation plays out, the price of ETH could soon go beyond $2,600.

However, it’s crucial to remember that the cryptocurrency market remains volatile, and unforeseen factors could still impact prices.

The timeline for an Ethereum ETF approval is uncertain, and regulatory hurdles could create delays. Additionally, broader market conditions and news on Ethereum development could also play a role.

Investors should carefully consider their risk tolerance and conduct thorough research before making any investment decisions, particularly in the dynamic and unpredictable world of cryptocurrencies.

Featured image from Medium

Read More
Blockchain

First ETF Trading Day Could Blast Bitcoin Price Past $50,000: Here’s Why

The crypto space witnessed a historic moment yesterday with the approval of 11 spot Bitcoin Exchange-Traded Funds (ETFs), a development that’s been eagerly anticipated since the Winklevoss twins filed for the first proposed Bitcoin ETF back on July 1, 2013. This pivotal event coincides with the 15th anniversary of Hal Finney’s tweet “Running Bitcoin,” marking a symbolic milestone in the digital currency’s journey.

Despite the monumental approval by the US Securities and Exchange Commission (SEC), Bitcoin’s price reaction was muted, maintaining stability around the $46,000 mark. This suggests that the approval had already been factored into the market price. However, the landscape could shift dramatically with today’s commencement of trading for these ETFs.

Spot ETFs, as opposed to future ETFs, necessitate the acquisition of physical Bitcoins by the issuers, thereby exerting direct buying pressure on the market. This aspect, combined with the high conviction among long-term investors (“hodlers”) and the historic low Bitcoin reserves on crypto exchanges, sets the stage for potentially volatile price movements.

Staggering Bitcoin Inflow Projections For Day 1

Projections for ETF inflows are staggering. Bloomberg anticipates a record-breaking $4 billion inflow on the first trading day for spot Bitcoin ETFs, with issuers collectively contributing $312.8 million in Bitcoin seeding. BlackRock’s ETF is particularly notable, with an expected $2 billion in inflows, as per Bloomberg Intelligence.

Standard Chartered recently projected that 2024 could see $50-100 billion in spot Bitcoin ETF inflows, with a potential Bitcoin price reaching $200,000 by the end of 2025. Mike Alfred, a Bitcoin expert, commented on the potential scale of these inflows:

Bitwise has confirmed they have $100M+ of investor commitments for tomorrow on day 1. I’m certain Blackrock is hoping for $3-4B. Invesco/Galaxy will also come out swinging. That’s a lot of corn. Hope the exchanges are ready.

Tuur Demeester of Adamant Research highlighted the significance of the ongoing fee war among issuers, suggesting that the intense competition reflects expectations of substantial capital inflows. “The intensity of this Bitcoin ETF bidding war is telling me the issuers believe that the winner’s low fees will be compensated by HUGE $$ inflows,” he remarked.

Alistair Milne from Altana Digital echoed these sentiments, anticipating record-breaking inflows and a resultant surge in global interest in Bitcoin. “Tune in tomorrow when we’ll try to break the record for first day ETF inflows, create global FOMO and initiate the Bitcoin supercycle,” Milne wrote via X.

Meanwhile, on-chain analyst Axel Adler Jr. may have found a reason for Bitcoin’s lagging performance so far. He pointed out that “miners have decided to take advantage of the cash inflow into the market.”

Next Target $50,000?

Raghu Yarlagadda, CEO of FalconX, in an interview with Bloomberg Technology, emphasized the crucial impact of net inflows on BTC’s price in the coming week:

What we’ve been hearing is most people are pricing in net inflows into Bitcoin in the first week or so at $1 to $2 billion. So if the net inflows are less $1 to $2 billion, it will have an adverse effect on price, and if it is more than $1 to $2 billion, it will have a positive effect on price.

1/ Based on customer conversations, $1 to $2 billion of spot #BitcoinETF inflows in the first week are priced into Bitcoin at $45K. Inflows could be more with ETF fee wars beginning this morning. 2024 is setup well for crypto with ETF approval, BTC halving, Ethereum upgrade, and… pic.twitter.com/L71Lkscfh5

— Raghu Yarlagadda (@2Ragu) January 8, 2024

British HODL, a known analyst on X, provided a deeper insight into the current market dynamics, explaining the lack of immediate price movement post-ETF approval and outlining scenarios for significant price changes depending on the inflows after the ETFs start trading.

“For anyone wondering, Bitcoin price has not moved because: Leverage was wiped out yesterday, everyone who wanted in before the ETF, seems to be in. Only after 9.30am tomorrow can the ETFs actually start accepting capital and thus start acquiring Bitcoin,” he stated and added that if Bloomberg is right with $4 billion coming in on the first day, “we *could* see a price of $50k-$57k by close of trading on Friday. The buying pressure has not even STARTED yet.”

At press time, BTC continued its sideways trend and traded at $46,267.

Read More
Blockchain

DOT Price (Polkadot) Pumps 15% As Bulls Aim For Surge To $10

Polkadot (DOT) is gaining pace above the $7.50 resistance against the US Dollar. The price is up nearly 15% and might rise further toward $10.00.

DOT is showing heavy bullish signs from the $6.65 support against the US Dollar.
The price is trading above the $8.00 zone and the 100 simple moving average (4 hours).
There was a break above a key bearish trend line with resistance near $7.80 on the 4-hour chart of the DOT/USD pair (data source from Kraken).
The pair could continue to rally unless the bears are able to defend the $8.88 resistance zone.

Polkadot Price Restarts Rally

After a steady decline, DOT price found support near the $6.65 zone. A low was formed at $6.64 and Polkadot recently started a fresh increase. The price was able to clear the $6.85 and $7.00 resistance levels to move into a positive zone, like Bitcoin and Ethereum.

There was a break above a key bearish trend line with resistance near $7.80 on the 4-hour chart of the DOT/USD pair. The pair even surpassed the 50% Fib retracement level of the downward move from the $9.58 swing high to the $6.64 low.

DOT is now trading above the $8.00 zone and the 100 simple moving average (4 hours). Immediate resistance is near the $8.45 level. The next major resistance is near $8.88 or the 76.4% Fib retracement level of the downward move from the $9.58 swing high to the $6.64 low.

Source: DOTUSD on TradingView.com

A successful break above $8.88 could start another strong rally. In the stated case, the price could easily rally toward $9.50 in the near term. The next major resistance is seen near the $10.00 zone.

Are Dips Supported in DOT?

If DOT price fails to start a fresh increase above $8.45, it could start a fresh decline. The first key support is near the $7.80 level and the same trend line.

The next major support is near the $7.50 level, below which the price might decline to $7.00. Any more losses may perhaps open the doors for a move toward the $6.65 support zone.

Technical Indicators

4-Hours MACD – The MACD for DOT/USD is now gaining momentum in the bullish zone.

4-Hours RSI (Relative Strength Index) – The RSI for DOT/USD is now above the 50 level.

Major Support Levels – $7.80, $7.500 and $7.00.

Major Resistance Levels – $8.45, $8.88, and $9.50.

Read More
Blockchain

Ethereum Price Rallies 5% and Outperforms Bitcoin – Is This Strong Bullish Sign?

Ethereum price climbed higher above the $2,450 resistance. ETH outpaced Bitcoin and seems to be setting up for a larger increase toward $2,880.

Ethereum is gaining pace above the $2,450 resistance level.
The price is trading above $2,500 and the 100-hourly Simple Moving Average.
There was a break above a key rising channel with resistance near $2,440 on the hourly chart of ETH/USD (data feed via Kraken).
The pair is already up over 5% and might rise further above the $2,650 resistance.

Ethereum Price Gains Strength

Ethereum price started a decent increase above the $2,350 resistance. Recently, BTC’s spot ETFs were approved. However, there was no major increase in Bitcoin, but ETH gained bullish momentum.

There was a break above a key rising channel with resistance near $2,440 on the hourly chart of ETH/USD. The pair surged over 5% and even cleared the $2,500 resistance zone. There was a spike above the $2,600 resistance zone. A new multi-week high was formed near $2,642 and the price is now consolidating gains.

There was a minor decline below $2,600, but Ethereum stayed above the 23.6% Fib retracement level of the recent rally from the $2,346 swing low to the $2,642 high. Ethereum is now trading above $2,500 and the 100-hourly Simple Moving Average.

If there is a fresh increase, the price might face resistance near the $2,650 level. The next major resistance is now near $2,720. A clear move above the $2,720 level might send ETH toward $2,780. A close above the $2,780 resistance could push the price further into a bullish zone.

Source: ETHUSD on TradingView.com

The next key resistance is near $2,840. If the bulls push Ethereum above $2,840, there could be a rally toward $2,920. Any more gains might send the price toward the $3,000 zone.

Are Dips Limited in ETH?

If Ethereum fails to clear the $2,650 resistance, it could start a downside correction. Initial support on the downside is near the $2,580 level.

The first key support could be the $2,500 zone or the 50% Fib retracement level of the recent rally from the $2,346 swing low to the $2,642 high. A downside break and a close below $2,500 might send the price further lower. In the stated case, Ether could test the $2,440 support. Any more losses might send the price toward the $2,350 level.

Technical Indicators

Hourly MACDThe MACD for ETH/USD is gaining momentum in the bullish zone.

Hourly RSIThe RSI for ETH/USD is now above the 50 level.

Major Support Level – $2,500

Major Resistance Level – $2,650

Read More
Blockchain

Celsius Seeks Repayment: Creditors Urged To Return 27.5% Of Funds

Surprisingly, bankrupt crypto lender Celsius Network customers are now facing legal action from bankruptcy managers after making substantial withdrawals within 90 days before the company’s bankruptcy declaration. 

The bankruptcy managers have demanded that affected customers return some of their funds or potentially face further legal consequences.

Customers Face Celsius Network’s Settlement Demands

The filing, published on Tuesday, revealed that customers who withdrew over $100,000 within the specified 90-day period before July 12, 2022, find themselves at the center of the legal dispute. 

These customers have been notified through an official filing outlining the procedures for settling their withdrawal preference exposure.

Withdrawal preference exposure noted in the notice refers to the aggregate value of assets withdrawn by customers from the Celsius Network platform during the specified period, minus any subsequent deposits made after the first withdrawal. 

The bankruptcy managers have determined that customers with withdrawal preference exposure greater than $100,000 must settle their claims or obtain a court order ruling to avoid potential liability.

The bankruptcy plan, known as the Modified Joint Chapter 11 Plan of Reorganization of Celsius Network LLC and Its Debtor Affiliates, offers an Account Holder Avoidance Action Settlement. 

Under this settlement, the Debtors will release avoidance actions against account holders meeting certain criteria, including accepting the plan on all claims and providing a payment equal to 27.5% of their withdrawal preference exposure.

The distribution agent is not obligated to make distributions to account holders with unresolved withdrawal preference exposure until their claims are settled, a court rules in their favor, or the withdrawal preference exposure is resolved with the litigation administrator after the plan’s effective date.

Settle Now Or Face Consequences

Celsius Network, in collaboration with the committee, has extended the payment deadline to allow affected customers to settle their withdrawal preference exposure and receive a release of all avoidance actions. The plan’s effective date is anticipated to occur around January 31, 2024.

Customers wishing to make the settlement payment must also submit the election form by January 25, 2024. The Debtors will start accepting completed election forms on January 17, 2024. Failure to submit the form may result in the rejection of the settlement payment.

It is important to note that failure to settle withdrawal preference exposure by January 31, 2024, may lead to further correspondence or actions by the litigation administrator after the plan’s effective date.

As customers grapple with the unexpected legal action, the crypto community awaits further developments in this ongoing bankruptcy case. 

The Account Holder Avoidance Action Settlement outcome will shed light on resolving withdrawal preference exposure claims and the subsequent distribution of funds.

Featured image from Shutterstock, chart from TradingView.com 

Read More
Blockchain

Bitcoin Price Stuck Below $48K Despite ETF Approval, Is This Bearish?

Bitcoin price remained in a range above the $45,000 support. BTC failed to climb higher above the $48,000 resistance despite approval of spot ETF.

Bitcoin is still struggling to clear the $47,800 and $48,000 resistance levels.
The price is trading above $45,600 and the 100 hourly Simple moving average.
There was a break above a major contracting triangle with resistance near $46,550 on the hourly chart of the BTC/USD pair (data feed from Kraken).
The pair could start a fresh decline if the bears continue to protect the $48,000 resistance.

Bitcoin Price Upsides Capped

Bitcoin price remained stable above the $45,500 resistance zone. Finally, the SEC approved all 11 spot ETF. BTC did climb higher above the $46,500 and $46,600 resistance levels after the news.

There was a break above a major contracting triangle with resistance near $46,550 on the hourly chart of the BTC/USD pair. However, the bears were still active near the $47,350 and $47,800 levels. A high was formed near $47,699 and the price is now showing a few bearish signs.

There was a minor decline below the $47,000 level. Bitcoin declined below the 23.6% Fib retracement level of the recent increase from the $44,333 swing low to the $47,699 high.

The price is now trading above $45,600 and the 100 hourly Simple moving average. On the upside, immediate resistance is near the $47,000 level. The first major resistance is $47,350. A clear move above the $47,350 resistance could send the price toward the $47,800 resistance.

Source: BTCUSD on TradingView.com

The next resistance is now forming near the $48,000 level. A close above the $48,000 level could send the price further higher. The next major resistance sits at $49,250.

Another Decline In BTC?

If Bitcoin fails to rise above the $47,350 resistance zone, it could start a fresh decline. Immediate support on the downside is near the $46,550 level.

The next major support is $46,000 or the 50% Fib retracement level of the recent increase from the $44,333 swing low to the $47,699 high. If there is a move below $46,000, the price could gain bearish momentum. In the stated case, the price could drop toward the $45,150 support in the near term.

Technical indicators:

Hourly MACD – The MACD is now losing pace in the bullish zone.

Hourly RSI (Relative Strength Index) – The RSI for BTC/USD is now above the 50 level.

Major Support Levels – $46,500, followed by $46,000.

Major Resistance Levels – $47,000, $47,350, and $47,800.

Read More