Crypto Corner Café

Taste The Future

Blockchain

Bitcoin Goes To The Doctor: 5 Key Metrics For BTC In 2024

The Bitcoin network and its underlying assets have evolved since its launch in 2009, and keeping up with the changes and updates can be challenging. In a post, financial strategist Lyn Alden broke down five key metrics to help BTC investors assess the network’s current state.   

Beyond Price: A Look At The Bitcoin Network Vitality

As Lyn Alden suggests, a deeper dive into the Bitcoin network is essential for any investor. This approach offers a more nuanced understanding of Bitcoin’s status, moving past the “superficialities of price fluctuations” to gauge its true potential and challenges.

Alden claims that price may not capture the complete story but remains a critical signal of adoption and market positioning. Bitcoin competes not just with other cryptocurrencies but also with traditional assets like gold and fiat currencies.

Its fluctuating price reflects its relative youth and volatility compared to more established currencies. However, its fixed supply of 21 million Bitcoin provides an alternative to the constantly inflated supply of fiat currencies, such as the US dollar. The analyst stated:

The Bitcoin network itself might be serving as a heartbeat of clockwork order in a world of chaos, but price is nonetheless a measure of its adoption.

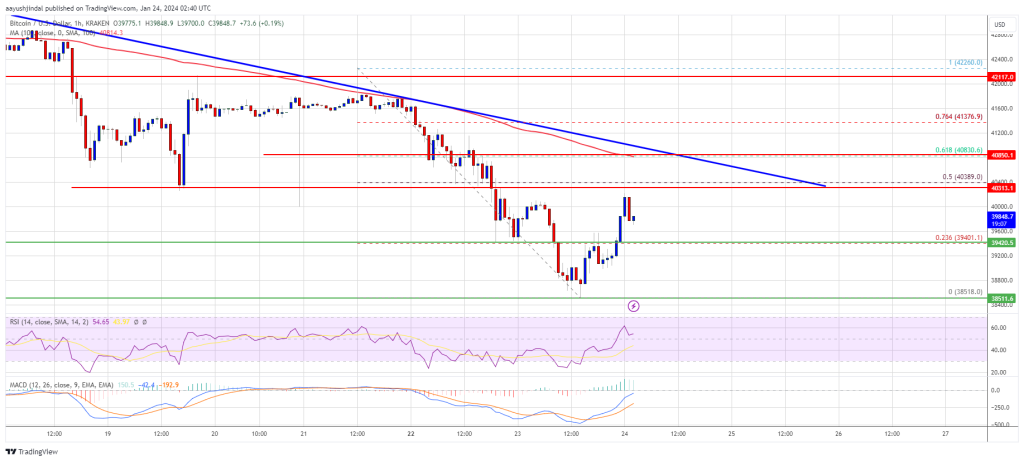
Bitcoin has consistently shown an upward trend, historically making it one of the best-performing assets, as seen in the chart below. The uptrend in the BTC price shows that the project has successfully operated as an alternative to traditional forms of money.

A key aspect to consider is liquidity – how much daily trading volume occurs and how much transaction value is circulated on-chain. High liquidity indicates a robust, widely used network. On the latter, Alden pointed out:

(…) now that bitcoin has billions of dollars of trading volume, there are trillion-dollar pools of capital that can’t put meaningful percentages into it; it’s still too small and illiquid for them. If they start putting a few hundred million dollars or a couple billions of dollars per day into it, that’s enough to tilt the supply/demand toward the buy side and seriously inflect the price upward. Since inception, the Bitcoin ecosystem has had to achieve certain levels of liquidity before it even gets on the radar of bigger pools of capital. It’s like leveling up.

The narrative surrounding Bitcoin is ever-evolving. It’s been viewed as both a payment method and a savings tool, reflecting its multifaceted utility. The balance between these functions – being able to execute transactions globally while serving as a reliable store of value – is vital.

The growing number of conversion points, where Bitcoin can be exchanged for goods, services, or fiat currencies, plays a crucial role in its adoption and practical use.

Bitcoin’s fundamental value proposition lies in its security and decentralization. The network must remain resilient against attacks and maintain its decentralized nature to continue being a credible and valuable digital asset. Despite facing technical challenges and bugs in its history, Bitcoin has demonstrated remarkable robustness, maintaining 100% uptime since 2013.

What About The Bitcoin User?

As Bitcoin evolves, so does the ease of its use. Developing user-friendly hardware wallets, improved software interfaces, and increased Bitcoin ATMs have significantly enhanced the user experience. This evolution is critical for Bitcoin’s wider adoption beyond tech-savvy individuals to the general public.

On this key metric, Alden points to the progress in BTC hardware wallets, which allow people to store their private keys while maintaining the usability of their coins. Setting up a BTC wallet is becoming easier and will likely continue moving in that direction.

The legal landscape surrounding Bitcoin varies significantly across different jurisdictions. While some governments have embraced it, others remain skeptical. However, Bitcoin’s global nature offers a kind of resilience to localized regulatory challenges. Its decentralized nature makes it a formidable entity to regulate or ban effectively.

In conclusion, while challenges in miner decentralization and user experience persist, the overall trend is positive. Alden believes the network continues to grow in liquidity, technical robustness, and global acceptance.

For investors and enthusiasts alike, Bitcoin remains a “dynamic and promising field, ripe with opportunities for growth and innovation.” As Alden points out, Bitcoin’s open-source nature invites continuous refinement and enhancement, making it a “resilient and adaptive digital asset.”

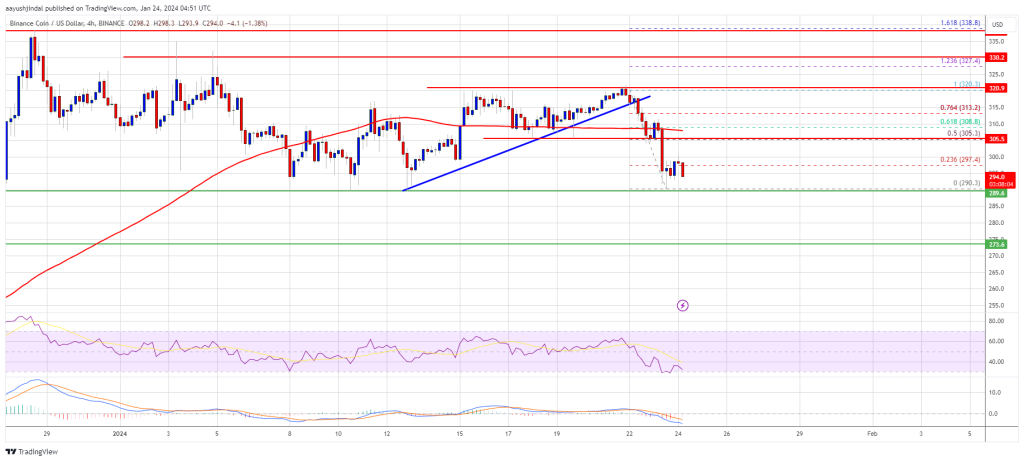
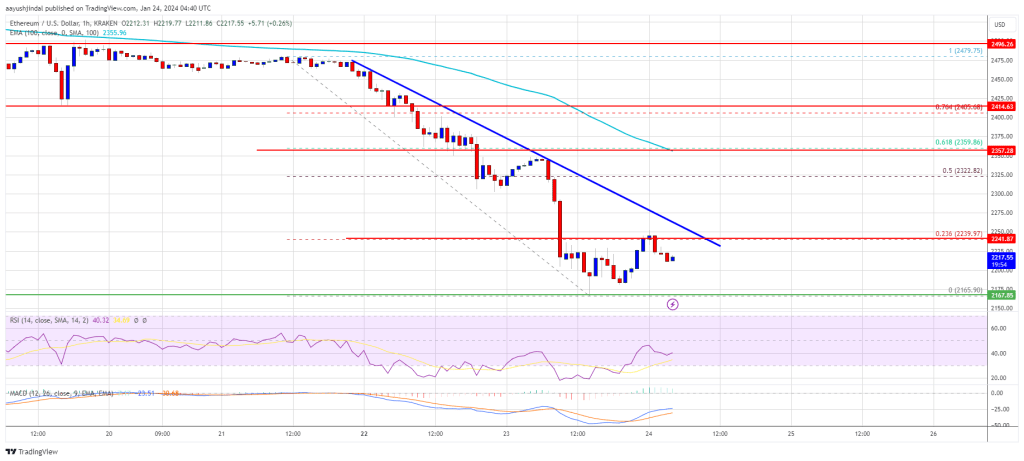
Cover image from Unsplash, chart from Tradingview

Read More
Blockchain

US Bank Foresees Major Bitcoin Price Drop To $20,000

The crypto space is currently facing bearish signals as the price of Bitcoin has failed to maintain crucial levels at $42,000, slipping to $39,909 at the time of writing. United States financial service provider Deutsche Bank, foresees even more declines in the upcoming months, projecting the value of Bitcoin to dip below $20,000. 

Deutsche Bank Predicts Massive Bitcoin Decline

Reports from Bloomberg, referencing a recent survey made from January 15 to January 19, 2024, by Deutsche Bank reveals investor’s sentiments regarding the volatility and future trajectory of BTC’s price. The survey, which appraised over 2000 people in the United States, United Kingdom, and the Eurozone, revealed that a third of the surveyed people expect to see a significant drop in the price of Bitcoin to values below $20,000. 

The substantial decline is anticipated to occur around January 2025. Although the majority of people foresee a significant plunge in the value of Bitcoin, the survey also indicates that 15% of people believe that Bitcoin’s price will consolidate between $40,000 and $75,000 by the end of 2024. Additionally, about 10% of the respondents think that Bitcoin could fall between $20,000 and $40,000. 

It’s important to note that the price of BTC has been experiencing major declines over the past few weeks. At the time of writing, the cryptocurrency is trading below $40,000 after surging over $45,500 earlier in January this year. 

This unprecedented decline is raising concerns in the crypto space as the price of Bitcoin is moving contrary to what most crypto investors and enthusiasts previously projected. Various crypto analysts predicted that the price of Bitcoin could surge to $50,000 following the approval of Spot Bitcoin ETFs. However, Bitcoin gave up most of its post-ETF approval gains and had been experiencing severe declines since. 

Analyst Reveals Key Factors That Could Break BTC Price Descent

Popular crypto analyst, Ali Martinez has taken to X (formerly Twitter) to disclose key technical price elements that could halt further declines in the price of Bitcoin. Martinez shared a chart published on TradingView depicting intricate price movements and patterns for Bitcoin. 

The crypto analyst revealed that a weekly closing price below $38,000 on the Bitcoin chart may signify a potential price drop, with the next significant support level expected around $33,000. He mentioned that this key area is a critical zone marked by a convergence of three important technical indicators, including a lower boundary of a parallel channel, a 0.5 Fibonacci retracement level, and a 50-week simple moving average.

According to Martinez, the combination of these critical factors creates a great line of defense for Bitcoin’s price, potentially providing a support zone to prevent future declines in the cryptocurrency.

Read More
Blockchain

XRP Bears Looming: Analyst Predicts Potential Drop To $0.28

Amid the bearish sentiment encompassing the crypto market, XRP has experienced a notable decline to the pivotal $0.51 price, which has led to several predictions from analysts concerning the price action of the token.

Could The Price Of XRP Fall To $0.28?

One of the well-known crypto analysts who has shared a daring prediction regarding the price action of XRP is JD. JD recently took to the social media platform X (formerly Twitter) to share his insights on the crypto asset with the crypto community.

In his projections, the analyst looked at the potential for additional declines in an attempt to forecast where XRP will go next. According to JD, the digital asset might be forming a “hidden bullish divergence” on a weekly basis.

On the weekly period, JD pointed out that XRP has been trapped in a symmetrical triangular pattern since 2021. His chart’s data indicates that the crypto asset is presently moving toward the direction of the triangle’s lower trendline.

JD highlighted an orange box he drew in November of last year, which overlaps the bottom trendline. The analyst also noted that the orange box is situated between Fibonacci 0.618 and 0.786.

The box, according to him, is a desirable level for dollar-cost averaging (DCA) move, and a decline into the box is conceivable. He stated that once XRP hits the box, he intends to open a “buy-the-dip” campaign, “heavily” filling his bags around $0.28 and $0.33.

He also mentioned several other price levels for his personal DCA, such as $0.45, $0.51, and $0.59. This simply suggests that the analyst is confident about the asset in the long run.

The post read:

A wick down the orange box is very possible. (Orange box has been posted since November 2023). My personal DCA: 0.28 – 0.33 (HEAVILY!), 0.45, 0.51, 0.59.

Nonetheless, he has urged the community not to time the bottom and highlighted a signal for investors to buy more XRP. “Don’t time bottom. When ‘Dumb Money’ complains, during the fear, that’s the signal to buy more,” he stated.

Floor Price For The Digital Asset

Even though the entire crypto market is currently experiencing a bearish trend, XRP is one of the most affected assets. The trend is mostly attributed to the waning enthusiasm around the Bitcoin Spot Exchange-Traded Funds (ETFs).

The token has recently experienced severe losses, falling below the $0.55 support level. Due to the trend, analysts are now predicting significant drops in XRP’s valuation in the upcoming days.

Another analyst who has predicted a decline in the price of the asset is XRP Shark. According to the analyst, the token could fall to a price level between $0.35 and $0.45.

He believes that the aforementioned levels are the “bottom area” of the decline. However, XRP Shark has expressed optimism toward the token, while noting a “violent” recovery.

As of the time of writing, XRP was sitting at $0.5129, demonstrating a decline of 10.27% in the past week. Despite the decline, its trading volume is presently up by over 15% in the past 24 hours.

Read More
Blockchain

Real Reasons For Bitcoin Price Crash Revealed, Not GBTC: Arthur Hayes

In his latest essay, Arthur Hayes, the founder of BitMEX, articulates a contrarian perspective on the recent downturn in Bitcoin’s price, refuting the mainstream narrative that attributes the decline to outflows from the Grayscale Bitcoin Trust (GBTC). Instead, Hayes points to macroeconomic maneuvers and monetary policy shifts as the real drivers behind Bitcoin’s volatility.

Monetary Policy And Market Reactions

Hayes kickstarts his analysis by shedding light on the US Treasury’s recent strategic shift in borrowing, a decision announced by Janet Yellen on November 1. This pivot towards Treasury bills (T-bills) has triggered a substantial liquidity injection, compelling money market funds to reallocate their investments from the Fed’s Reverse Repo Program (RRP) to these T-bills, offering higher yields.

Hayes articulates the significance of this move, stating, “Yellen acted by shifting her department’s borrowing to T-bills, thus adding hundreds of billions of dollars’ worth of liquidity so far.” However, he contrasts this tangible financial maneuver with the Federal Reserve’s mere rhetoric about future rate cuts and the tapering of quantitative tightening (QT), pointing out that these discussions have not translated into actual monetary stimulus.

While the traditional financial markets, particularly the S&P 500 and the Nasdaq 100, responded positively to these developments, Hayes argues that Bitcoin’s recent price trajectory serves as a more accurate barometer of the underlying economic currents. He remarks, “The real smoke alarm for the direction of dollar liquidity, Bitcoin, is throwing a cautionary sign.”

He notes the cryptocurrency’s decline from its peak and correlates it with the fluctuations in the yield of the 2-year US Treasury, suggesting a deeper economic interplay at work. “Coinciding with Bitcoin’s local high, the 2-year US Treasury yield hit a local low of 4.14% in mid-January and is now marching upwards,” Hayes remarked.

Dissecting True Reasons Behind The Bitcoin Dip

Addressing the narrative surrounding GBTC, Hayes emphatically dismisses the notion that outflows from GBTC are the primary catalyst for Bitcoin’s price movements. He clarifies, “The argument for Bitcoin’s recent dump is the outflows from the Grayscale Bitcoin Trust (GBTC). That argument is bogus because when you net the outflows from GBTC against the inflows into the newly listed spot Bitcoin ETFs, the result is, as of January 22nd, a net inflow of $820 million.”

This realization shifts the focus to economic mechanisms at play. The crux of Hayes’s argument lies in the anticipation surrounding the Bank Term Funding Program (BTFP)‘s expiration and the Federal Reserve’s hesitancy to adjust interest rates to a range that would alleviate the financial strain on smaller, non-Too-Big-to-Fail (TBTF) banks.

Hayes elucidates, “Until rates are reduced to the aforementioned levels, there is no way these banks can survive without the government support provided via the BTFP.” He predicts a looming mini-financial crisis in the event of the BTFP’s cessation, which he believes will compel the Federal Reserve to pivot from rhetoric to tangible action—namely, rate cuts, a tapering of QT, and potentially a resumption of quantitative easing (QE).

“I believe Bitcoin will dip before the BTFP renewal decision on March 12th. I didn’t expect it to happen so soon, but I think Bitcoin will find a local bottom between $30,000 and $35,000. As the SPX and NDX dump due to a mini financial crisis in March, Bitcoin will rise as it will front-run the eventual conversion of rate cuts and money printing talk on behalf of the Fed into the action of pressing that Brrrr button,” Hayes writes.

Strategic Trading Moves In A Turbulent Market

In a revealing glimpse into his tactical trading strategies, Hayes shares his approach to navigating the tumultuous market landscape. He discloses his positions, including the purchase of puts and the strategic adjustment of his BTC holdings. He concludes:

A 30% correction from the ETF approval high of $48,000 is $33,600. Therefore, I believe Bitcoin forms support between $30,0000 to $35,000. That is why I purchased 29 March 2024 $35,000 strike puts. […] Bitcoin and crypto in general are the last freely traded markets globally. As such, they will anticipate changes in dollar liquidity before the manipulated TradFi fiat stock and bond markets. Bitcoin is telling us to look for Yellen and not Talkin’.

At press time, BTC traded at $39,963.

Read More
Blockchain

Lone Survivor: Ronin (RON) Rallies 20% As Top 100 Cryptos Bleed

Today’s surge in the price of RON has caught the attention of the cryptocurrency market, with the Ronin token going up by more than 200% in the last month.

In its first nine months, Ronin has racked up 250,000 unique daily active addresses, $5 billion in total value locked (TVL), over 2 million wallet downloads, and 15% of all NFT transactions on the market.

Its DEX Katana is the second-most popular decentralized exchange by weekly active users and allows for millions of in-game transactions.

Ronin: Gaming Blockchain Thrives Amidst Market Turmoil

Ronin (RON) is a blockchain designed for gaming that has gained significant traction in the cryptocurrency market. Launched by Sky Mavis, the creator of Axie Infinity, Ronin is tailored to optimize near-instant transactions and negligible fees, making it an ideal choice for Web3 games.

At the time of writing, RON was down a measly 0.2% in the last 24 hours, however it sustained an impressive 20% rally in the last seven days, emerging as the lone survivor in today’s crypto carnage, data from Coingecko shows.

A look at the chart shows the top 10 cryptocurrencies bathed in crimson, with Bitcoin leading the top losers with a nearly 7% loss. Down below, in the 98th spot, is Ronin with a solid gain in the weekly timescale.

In the face of broader fluctuations and uncertainties within the cryptocurrency landscape, RON has not only weathered the storm but has also demonstrated a noteworthy ascent in value.

This commendable performance positions it as an outlier, defying the broader trends that have impacted various digital assets. Investors and observers alike may find solace in the relative stability and positive trajectory exhibited by RON during a time when many other cryptocurrencies experience heightened volatility.

However, it’s important to note that the cryptocurrency market remains inherently unpredictable, and the coming weeks and months promise to be compelling for Ronin followers eagerly awaiting the cryptocurrency’s next moves.

Ronin Blockchain Crypto Wallet Update

Meanwhile, Sky Mavis has revealed an update for the cryptocurrency wallet on the Ronin blockchain. Support for multi-party computation (MPC), an in-app web browser, multichain support, and a redesigned look are among the new features.

Currently supported by the Ronin wallet are Polygon, Ethereum, and Binance’s BNB Chain. With the most recent update, customers can utilize a single wallet to manage and move assets across many blockchain networks.

Users can access decentralized apps (dApps) and communicate with blockchain-based services straight from the wallet using the latest Ronin wallet version’s in-app web browser.

Featured image from Shuttertsock

Read More
Blockchain

BNB Price Could See Major Drawdown If It Fails To Stay Above This Support

BNB price started a fresh decline from $320 resistance zone. The price is now retesting the $290 support and is at risk of more downsides.

BNB price is gaining bearish momentum from the $320 resistance.
The price is now trading below $310 and the 100 simple moving average (4 hours).
There was a break below a key bullish trend line with support at $315 on the 4-hour chart of the BNB/USD pair (data source from Binance).
The pair might continue to move down if it fails to stay above the $290 support.

BNB Price Takes Hit

In the past few days, BNB price made more than three attempts to clear the $320 resistance zone. However, the bears remained active and protected more gains.

As a result, there was a bearish reaction below the $315 level, like Bitcoin and Ethereum. There was a break below a key bullish trend line with support at $315 on the 4-hour chart of the BNB/USD pair. The pair even declined below the $300 level and tested the key support at $290.

A low is formed near $290.3, and the price is now struggling to correct higher. BNB price is now trading below $310 and the 100 simple moving average (4 hours). Immediate resistance is near the $298 level or the 23.6% Fib retracement level of the recent decline from the $320 swing high to the $290 low.

Source: BNBUSD on TradingView.com

The next resistance sits near the $305 level. It is close to the 50% Fib retracement level of the recent decline from the $320 swing high to the $290 low. A clear move above the $305 zone could send the price further higher. In the stated case, BNB price could test $320. A close above the $320 resistance might set the pace for a larger increase toward the $335 resistance. Any more gains might call for a test of the $350 level.

More Downsides?

If BNB fails to clear the $305 resistance, it could continue to move down. Initial support on the downside is near the $290 level.

The next major support is near the $285 level. The main support sits at $272. If there is a downside break below the $272 support, the price could drop toward the $250 support. Any more losses could initiate a larger decline toward the $220 level.

Technical Indicators

4-Hours MACD – The MACD for BNB/USD is gaining pace in the bearish zone.

4-Hours RSI (Relative Strength Index) – The RSI for BNB/USD is currently below the 50 level.

Major Support Levels – $290, $285, and $272.

Major Resistance Levels – $298, $305, and $320.

Read More
Blockchain

Ethereum Price Plunge To $2K Imminent as Key Support Line Crumbles

Ethereum price extended losses and tested the $2,150 support. ETH is struggling to recover and might continue to move down toward the $2,000 support zone.

Ethereum started a fresh decline below the $2,350 and $2,250 levels.
The price is trading below $2,250 and the 100-hourly Simple Moving Average.
There is a key bearish trend line forming with resistance near $2,240 on the hourly chart of ETH/USD (data feed via Kraken).
The pair attempt a fresh increase if it clears the $2,240 and $2,280 levels.

Ethereum Price Extends Losses

Ethereum price remained in a bearish zone below the $2,400 pivot level. ETH extended its decline and traded below the $2,250 support level, like Bitcoin.

It even spiked below the $2,000 level. A new weekly low was formed near $2,165 and the price is now consolidating losses. There was a minor increase above the $2,220 level. The price tested the 23.6% Fib retracement level of the downward wave from the $2,480 swing high to the $2,165 low.

Ethereum is now trading below $2,250 and the 100-hourly Simple Moving Average. On the upside, the price is facing resistance near the $2,240 level. There is also a key bearish trend line forming with resistance near $2,240 on the hourly chart of ETH/USD.

The next hurdle could be $2,280, above which the price could aim for a decent recovery. The next major resistance is now near $2,360 or the 61.8% Fib retracement level of the downward wave from the $2,480 swing high to the $2,165 low.

Source: ETHUSD on TradingView.com

A clear move above the $2,360 level might start a decent increase. In the stated case, the price could rise toward the $2,415 level. Any more gains might send the price toward the $2,550 zone.

More Losses in ETH?

If Ethereum fails to clear the $2,440 resistance, it could start another decline. Initial support on the downside is near the $2,200 level.

The next key support could be the $2,165 zone. A downside break below the $2,165 support might send the price further lower. In the stated case, Ether could test the $2,120 support. Any more losses might send the price toward the $2,000 level.

Technical Indicators

Hourly MACDThe MACD for ETH/USD is gaining momentum in the bearish zone.

Hourly RSIThe RSI for ETH/USD is now below the 50 level.

Major Support Level – $2,165

Major Resistance Level – $2,480

Read More
Blockchain

Bitcoin Price At Risk? Grayscale’s $335M Coinbase Transfer Stirs $30,000 Plunge Potential

The Bitcoin price has experienced a notable shift as selling pressure mounts, with BTC bears gaining the upper hand. Asset manager Grayscale, the owner and manager of the Grayscale Bitcoin Trust (GBTC), is a significant contributor to this trend. 

Since the trading of spot Bitcoin exchange-traded funds (ETFs) began on January 12, Grayscale has been on a selling spree, as evidenced by substantial transfers of BTC to the United States-based crypto exchange Coinbase.

Bitcoin Price Under Pressure As Grayscale Selling Spree Continues

According to Akrham Intelligence data, in addition to the previously reported 69,994 BTC ($2.9 billion) transfers, Grayscale sent an additional 8,593,075 BTC (approximately $335.19 million) to the exchange on Tuesday, suggesting the possibility of further selling activities.

These developments have affected the Bitcoin price, which has experienced a significant downtrend, declining by 20% over the past week and a half. 

On Tuesday, the largest cryptocurrency dropped as low as $38,500, placing considerable pressure on a crucial support level. Despite the bearish pressure, the $38,500 support level has demonstrated resilience so far, with the cryptocurrency rebounding to $39,300 at the time of writing. 

Nevertheless, the duration of Grayscale’s selling spree remains uncertain, and if market sentiment continues to turn negative, Bitcoin could potentially revisit the $30,000 mark. This figure is just above the key $29,000 level that marked the beginning of the bull run that took Bitcoin to its 22-month high of $49,000 on January 11th.

Bears On The Rise

If the $38,500 threshold succumbs to Grayscale’s selling pressure and profit-taking, market observers should closely monitor the $37,750 level as the next resistance. 

Failure to hold above this level would open the door to a potential decline toward the major resistance at $35,600, which could further prevent a dip to the next support level at $33,000.

However, if these support levels are breached and the Bitcoin price continues its downtrend, the next significant key levels to watch for bullish momentum would be $29,000 to $30,000. A breakdown below these levels could signal an end to the current bull market structure and grant the bears the upper hand in the mid-term, at least until the anticipated halving event in April. 

Historically, halving events have acted as major catalysts for the Bitcoin price, and their influence has been demonstrated.

As the Bitcoin market faces intensified selling pressure and Grayscale’s ongoing selling spree, market participants remain cautious about the potential for a significant price plunge. The coming days and weeks will be critical in determining whether Bitcoin can regain its bullish momentum or if it will succumb to further downward pressure.

Featured image from Shutterstock, chart from TradingView.com

Read More
Blockchain

Exploit On Polygon Contracts Extract $15M, Here Are The Details

The play-and-own mobile gaming platform GAMEE suffered an exploit of its GMEE token contracts on Polygon that led to the theft of 600 million GMEE tokens and left the crypto community pondering questions.

GAMEE Confirms $15M Exploit On Polygon

On January 22, GAMEE Token’s official X (formerly Twitter) account advised its users to refrain from engaging with the digital asset while their team investigated the GMEE token-related security comprise it had just suffered.

The GMEE token is an ERC-20 utility token “designed to be the currency of access, action, and governance within the GAMEE ecosystem,” as their website states.

$GMEE | URGENT

There has been a security incident involving the GMEE token. As a precautionary measure, we advise all users to refrain from engaging with $GMEE until further notice.

Our team is actively investigating the situation, and updates will be provided soon.

— GMEE Token (@GAMEEToken) January 22, 2024

Before the official announcement, crypto users quickly noticed the token’s sudden price crash and the transactions behind it. This left GAMEE users and the general crypto community wondering if an exploit had occurred.

In the early hours of January 23, GAMEE’s team returned to the X platform to explain what happened and the steps to come.

The thread explains that their preliminary investigation indicated that the GMEE token contracts on Polygon had been compromised via unauthorized GitLab access.

This compromise resulted in the theft of 600 million GMEE tokens worth approximately $15.28 million at the time of the exploit. The compromised tokens were immediately converted to ETH and MATIC and exchanged via various decentralized exchanges (DEXs) in the following hours, drastically impacting the GMEE token price.

The team behind GAMEE explained that after noticing the Polygon GMEE deployer address was compromised, they secured the token contract ownership and all associated contracts by transferring ownership to a “new secure address.”

The team also clarified that only proprietary team token reserves were affected, and the exploit did not affect assets owned by the community, as “GAMEE does not custody or manage any community-owned assets.”

GAMEE expressed its understanding of how the impact of the unauthorized transactions could have affected the GAMEE community, as it led to price volatility and limited use of the GMEE token while investigations were taking place.

The next steps for GAMEE will consist of an impacted user identification process to evaluate the best way to support the affected part of the community. Additionally, they plan to provide a real-time update on the details that further investigations will provide as an effort to keep trust and transparency.

Lastly, the user was advised to exercise caution “given the volatile market conditions and potential liquidity impacts driven by CEX measures.”

GMEE’s Violent Price Drop

Around the time of the exploit, the GMEE token had been trading at $0.02554112, according to CoinGecko’s data, and it had been previously sitting at the $0.027-$0.026 range throughout the weekend.

Shortly after the exploit, the prince crashed to $0.01155577, reaching its lowest point of $0.00897251 in the early hours of today.

It’s worth noting that many saw the price crash as a possibly once-in-a-lifetime opportunity to profit. Various users shared that they had bought the dip and even advised others to do it. One X user said, “One man’s trash is another man’s treasure.”

At writing time, the GMEE token trades at $0.016999, a 31.5% decline in the last 24 hours.

Read More
Blockchain

Bitcoin Price Faces Crucial Test, Indicators Suggest Many Roadblocks To Recovery

Bitcoin price dived toward the $38,500 support zone. BTC is attempting a recovery wave and might struggle to climb above the $40,500 resistance.

Bitcoin price extended its decline and tested the $38,500 support zone.
The price is trading below $40,000 and the 100 hourly Simple moving average.
There is a key bearish trend line forming with resistance near $40,450 on the hourly chart of the BTC/USD pair (data feed from Kraken).
The pair might struggle to recover above the $40,000 and $40,500 resistance levels.

Bitcoin Price Turns Red

Bitcoin price remained in a bearish zone below the $40,000 support zone. BTC extended its decline and traded below the $49,200 level. Finally, it tested the $38,500 support zone, as discussed in yesterday’s post.

A new weekly low was formed near $38,518 and the price is now correcting losses. It is slowly recovering above the $39,000 level. It cleared the 23.6% Fib retracement level of the downward move from the $42,260 swing high to the $38,518 low.

Bitcoin is now trading below $40,000 and the 100 hourly Simple moving average. Immediate resistance is near the $40,000 level. The first major resistance is near the $40,350 level or the 50% Fib retracement level of the downward move from the $42,260 swing high to the $38,518 low.

Source: BTCUSD on TradingView.com

There is also a key bearish trend line forming with resistance near $40,450 on the hourly chart of the BTC/USD pair. A clear move above the $40,450 resistance could send the price toward the $40,850 resistance. The next resistance is now forming near the $41,250 level. A close above the $41,250 level could push the price further higher. The next major resistance sits at $42,000.

Another Decline In BTC?

If Bitcoin fails to rise above the $40,450 resistance zone, it could start another decline. Immediate support on the downside is near the $39,400 level.

The next major support is $39,000. If there is a close below $39,000, the price could gain bearish momentum. In the stated case, the price could revisit the $38,500 support in the near term.

Technical indicators:

Hourly MACD – The MACD is now losing pace in the bearish zone.

Hourly RSI (Relative Strength Index) – The RSI for BTC/USD is now above the 50 level.

Major Support Levels – $39,400, followed by $38,500.

Major Resistance Levels – $40,350, $40,450, and $40,850.

Read More