Crypto Corner Café

Taste The Future

Blockchain

Bitcoin Whales Go On Buying Spree As Price Dips, Here’s How Much They Bought

A recent development shows that Bitcoin whales have refused to be deterred by the recent price action of the flagship cryptocurrency. Instead, they have chosen to see it as an opportunity to accumulate more BTC. This move could turn out to be really profitable based on a recent analysis by crypto analyst Ali Martinez

An Increase In Bitcoin Whales

Ali Martinez stated in an X (formerly Twitter) post that 46 new entities now hold 1,000 BTC or more, which represents a 3% increase in just two weeks. Data from BitInfoCharts further shows that there are now 1,898 wallet addresses holding this amount of Bitcoin or more. This is significant as it suggests that more people have become bullish on the crypto token despite the recent market correction

These whales no doubt have enough reason to be bullish on BTC, as Martinez’s recent Bitcoin analysis suggests that the tide could turn soon enough. The analyst highlighted in an X post how, historically, price corrections for Bitcoin have “consistently been followed by further upside gains” in bull markets. 

As such, he noted that dips like this might offer “strategic buying opportunities for those looking to capitalize on Bitcoin’s potential growth.”

Meanwhile, the Spot Bitcoin ETF issuers have helped contribute to the increase in this figure, considering they have had to accumulate BTC for their respective funds. Data from on-chain analytics firm Arkham Intelligence shows that the world’s asset manager, BlackRock, currently holds over 44,000 BTC for their Bitcoin ETF. 

BTC Still Has More Bullish Momentum 

While many in the crypto community continue to speculate whether the bull market is back, there is reason to believe that BTC’s bullish momentum is not fading anytime soon. In his most recent X post, Ali shared how the next market peak could land around 2025 if Bitcoin is to mirror past bull runs. Going by this projection, Bitcoin is said to have 600 days of bullish momentum still ahead. 

In the meantime, Bitcoin bulls will have to overcome the selling pressure from Bitcoin whales like Grayscale. The asset manager had to offload a significant portion of its BTC holdings due to the amount of outflows it keeps recording from its Spot Bitcoin ETF. GBTC investors like FTX are reported to be taking profits, considering that the fund had traded at a significant discount to Bitcoin’s price before now.  

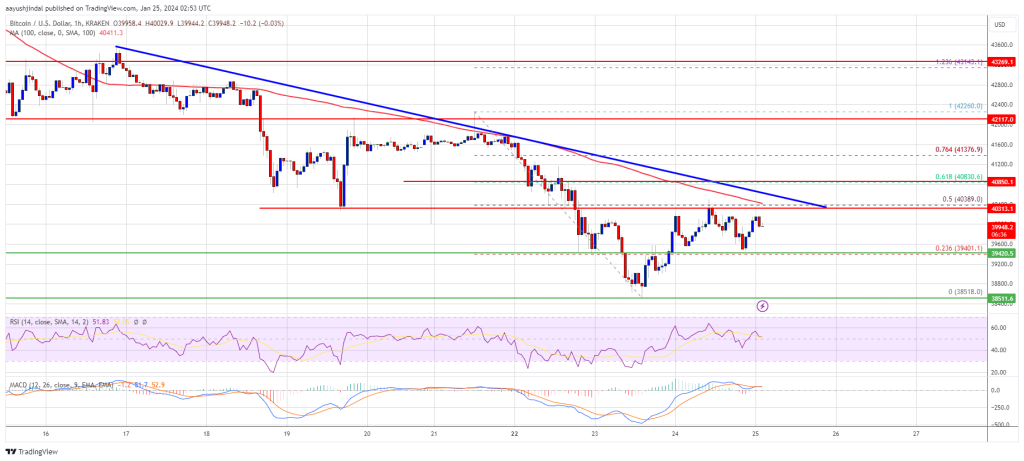
At the time of writing, Bitcoin is trading at around $39,000, up in the last 24 hours, according to data from CoinMarketCap. 

Read More
Blockchain

XRP Faces Bearish Pressures Amid Market Downturn: Analysts Divided On Next Move

XRP, the native cryptocurrency of the Ripple network, became a focal point in the face of the recent downturn in the broader market, facing the consequences of breaching a crucial support level and prompting uncertainties regarding its immediate outlook.

In tandem with Bitcoin’s descent below the $40,000 mark and Ethereum’s stumble beneath $2,200, XRP mirrored the trend, slipping below the pivotal $0.51 threshold for the first time since January 3.

XRP Vulnerability Sparks Differing Views

This abrupt breakdown laid bare the vulnerability of XRP’s current standing, triggering a wave of speculation about its potential trajectory in the near term.

Amid the market turbulence, analysts have offered a spectrum of conflicting predictions, leaving investors to navigate a complex landscape characterized by mixed signals.

The varying assessments of XRP’s future add an additional layer of uncertainty to an already tumultuous market environment, compelling investors to carefully weigh their options and stay attuned to the dynamic nature of cryptocurrency markets.

JD, a technical analyst, identified a long-term triangular pattern in XRP’s price chart. He predicts a potential further decline towards the lower trendline of this pattern, with the $0.28-$0.33 range identified as a potential “buy-the-dip” zone.

#XRP – May be creating “Hidden Bullish Divergence” on weekly (candle body close below red line would negate divergence)

A “wick” down the orange box is very possible. (Orange box been posted since November 2023!)

My personal DCA: 0.28 – 0.33 (HEAVILY!), 0.45, 0.51, 0.59

Don’t… pic.twitter.com/ipMsM0p7ZE

— JD (@jaydee_757) January 23, 2024

Ali Martinez, a veteran market observer, warned of a potentially steeper descent if XRP fails to hold above $0.55. Based on his Jan. 18 analysis, a breach of this level could trigger a significant drop, plummeting the token towards the $0.34 mark.

$XRP is currently grappling to maintain its footing at the crucial $0.55 support level. Should this support fail to hold, be prepared for a possible sell-off scenario that could see #XRP descending toward $0.34! pic.twitter.com/6oKObjpnnm

— Ali (@ali_charts) January 18, 2024

Alternatively, XRP Shark, another analyst, presented a more optimistic outlook. While acknowledging the possibility of a drop to the $0.35-$0.45 range, XRP Shark sees this as a potential buying opportunity and predicts a subsequent substantial recovery for the token.

Looking to load up a bit on XRP in the coming time between .35-.45 I personally think that will be the bottom area of this move down and a violent move to the upside is following. Invalidation below .30 cents (would be pretty bad to see it go past that level) pic.twitter.com/OA0SbXOEOZ

— XRP_Shark (@XRP_Shark) January 22, 2024

At the time of writing, XRP was trading at $0.51, down 0.4% and 9.3% in the last 24 hours and seven days, respectively, according to data from Coingecko.

XRP Faces Critical $0.51 Threshold

The $0.51 threshold is one of the most important price zones for XRP because a retreat from this level could push the token below the psychological $0.50 level.

Despite the varied predictions, one consensus emerges: the short-term outlook for XRP appears bearish. With analysts anticipating further declines if crucial support levels are not held, investors should brace for potential volatility in the immediate future.

However, a closer look reveals glimmers of potential hope. Both XRP Shark and JD anticipate a future rebound for the token, albeit at different price points. This suggests that while the near-term may be turbulent, the longer-term prospects for XRP may not be devoid of promise.

Featured image from Pixabay, chart from TradingView

Read More
Blockchain

Solana Price Soars By 11% – Here’s Why

The Solana (SOL) price has witnessed an 11% increase, rebounding to $89.21, following a local low of $78 yesterday. This surge comes amidst a broader market recalibration and can be largely attributed to an announcement from the Solana Foundation. The foundation unveiled a new tokenization feature, stirring significant interest within the crypto community and prompting a bullish market response.

Why The Feature Is So Important

Tokenization, a concept heralded by BlackRock CEO Larry Fink as the future of digital markets, is poised to revolutionize the financial and securities landscape. In recent interviews, Fink emphasized the significance of this advancement, stating, “Tokens represent the next frontier in the evolution of digital assets and markets, offering unprecedented opportunities for innovation and streamlined payments.”

Embracing this visionary perspective, the Solana Foundation unveiled via X (formerly Twitter), “The future of tokenization is now: Introducing token extensions, ready-to-use advanced token functionality on Solana.”

1/ The future of tokenization is now: Introducing token extensions, ready-to-use advanced token functionality on Solana.https://t.co/zNw9qWgvjA

Token extensions empower developers to rapidly build customized token experiences & designed to meet business compliance needs. pic.twitter.com/dHkKoNS28X

— Solana (@solana) January 24, 2024

These token extensions are designed to provide developers with the tools to craft bespoke token experiences, ensuring compliance with business needs while leveraging Solana’s high throughput and cost-effective blockchain infrastructure. The announcement further elaborated, “Token extensions open up new possibilities for businesses and developers, enabling functionalities that were previously inconceivable on public blockchains.”

Crypto analyst @0xjaypeg elucidated the strategic importance of Solana’s latest move, emphasizing, “Solana is coming for enterprise with token extensions.” He praised Solana’s strategic approach, noting, “It’s clear they are pushing their advantages hard to carve out a niche and moat that other blockchains can’t compete with as effectively.”

He added, “The last piece here is to get a well known enterprise user (such as Shopify) to adopt token extensions and make it crystal clear how much $ they save – Solana txns are much cheaper than merchant credit card fees.”

SOL Price Analysis: Bears Still In Control

The 4-hour chart of SOL/USDT indicates that the price has rebounded from a low of $78.02, which serves as the immediate support level. The Fibonacci retracement levels, drawn from a swing high of $125.88 to the swing low, suggest potential resistance levels.

Notably, SOL’s price got rejected at the 0.236 Fibonacci level at $89.31 – the single most important level for the bulls at the moment. Only if the Solana price reclaims this price level, there’s hope that the bulls can print a new higher high.

A closer examination of the Exponential Moving Averages (EMA) reveals that SOL’s price has currently found support at the 20 EMA. The 50, 100, and 200 EMAs are positioned above the current price, indicating that SOL is still in a broader downtrend despite the recent rally. A sustained move above these EMAs could hint at a potential trend reversal.

Volume analysis shows that the recent price increase was accompanied by substantial trading activity, which may validate the strength of the move. Furthermore, the Relative Strength Index (RSI), a momentum oscillator, is hovering near the 50 level, which typically represents a balance between buyers and sellers. A push above this midpoint could suggest increasing bullish momentum.

Technical traders will be monitoring the $101.95 level, which corresponds to the 0.5 Fibonacci retracement level, as the most crucial resistance in the mid-term. If SOL recaptures this level, it would create a higher high, a strong bullish sign.

The subsequent levels to watch are $107.59 (0.618 Fibonacci level) and $115.63 (0.786 Fibonacci level). A failure to maintain the current momentum could see SOL retracing towards the aforementioned support at $78.02 again.

Read More
Blockchain

Recovery Dim? Ethereum Faces Potential Slide Towards $2,000

Ethereum, the linchpin of the decentralized application ecosystem, finds itself navigating a precarious path this week. The cryptocurrency’s value, having breached the pivotal $2,250 support level, now teeters on the edge of a decisive crossroads, caught between the prospect of a resurgence and the looming threat of a more pronounced downturn.

Analyzing the technical landscape reveals a cautious narrative, as ominous bearish trendlines emerge on the hourly charts of the Kraken exchange, while a resilient resistance at $2,240 presents a formidable obstacle.

Ethereum: Uphill Battle And Key Levels To Watch

The journey to reclaim lost ground demands a Herculean effort from Ethereum, necessitating the conquering of the initial hurdle at $2,240 and then engaging in a formidable battle against the $2,280 resistance. The digital asset’s fate hangs in the balance, with the outcome likely to shape its trajectory in the coming days.

However, should Ethereum stumble in this uphill climb, a safety net awaits at $2,200, providing a temporary buffer against a further decline to $2,000.

But amidst the technical turmoil, a ray of sunshine pierces through the clouds. Market sentiment around Ethereum remains surprisingly upbeat. Despite the price dip, the volume of net profits locked in by ETH investors has hit a multi-year high, suggesting a shift in focus from short-term gains to long-term holding.

Ethereum’s High-Wire Act: Key Metrics

This newfound patience is further corroborated by the skyrocketing net unrealized profit/loss (NUPL) metric for short-term token-holders. This figure, reflecting the potential profitability of investors based on their purchase price, has for the first time since the November 2021 all-time high, surpassed 0.25, signifying a surge in confidence among those who recently acquired ETH.

The current scenario resembles a high-wire act, except the stakes are considerably higher. Technical charts flash cautionary signals, but market sentiment whispers sweet nothings of optimism. Whether Ethereum finds its footing and ascends, or takes a misstep and plummets, remains to be seen.

At A Glance

Ethereum faces near-term technical challenges with resistance points at $2,240 and $2,280.
Support lies at $2,200 and $2,165, with a breach below $2,000 a possibility.
Despite the price dip, market sentiment around Ethereum remains positive.
Record-high net profits locked in and rising NUPL for short-term holders suggest long-term optimism.

While Ethereum’s path forward remains shrouded in uncertainty, the technical picture paints a potentially bleak outlook. With resistance levels looming large and support thin on the ground, a slide towards the psychologically significant $2,000 mark cannot be ruled out. However, the resilient optimism amongst investors, evidenced by locked-in profits and rising NUPL, suggests a hidden strength that could fuel an unexpected comeback.

Featured image from Pixabay, chart from TradingView

Read More
Blockchain

Ethereum Price is Primed For a Correction And Only 1 Thing is Holding it Back

Ethereum price is attempting an upside correction from the $2,150 support. ETH could gain pace if it clears the $2,240 resistance zone.

Ethereum started an upside correction from the $2,165 zone.
The price is trading below $2,240 and the 100-hourly Simple Moving Average.
There was a break above a connecting bearish trend line with resistance near $2,235 on the hourly chart of ETH/USD (data feed via Kraken).
The pair might start a steady increase if it clears the $2,240 resistance zone.

Ethereum Price Holds Support

Ethereum price extended its decline below the $2,240 support zone. ETH spiked below $2,200 before the bulls appeared near the $2,165 level. The price formed a short-term base and started an upside correction like Bitcoin.

There was a move above the $2,200 resistance level. Besides, there was a break above a connecting bearish trend line with resistance near $2,235 on the hourly chart of ETH/USD. However, the bears are active near the $2,240 resistance. They defended the 23.6% Fib retracement level of the downward move from the $2,480 swing high to the $2,165 low.

Ethereum is now trading below $2,240 and the 100-hourly Simple Moving Average. On the upside, the price is facing resistance near the $2,240 level.

The next hurdle could be $2,300 or the 100-hourly Simple Moving Average, above which the price might rise and test the 50% Fib retracement level of the downward move from the $2,480 swing high to the $2,165 low at $2,320. The next major resistance is now near $2,360.

Source: ETHUSD on TradingView.com

A clear move above the $2,360 level might start a decent increase. In the stated case, the price could rise toward the $2,420 level. Any more gains might send the price toward the $2,500 zone.

Another Drop in ETH?

If Ethereum fails to clear the $2,240 resistance, it could start another decline. Initial support on the downside is near the $2,200 level.

The next key support could be the $2,165 zone. A downside break below the $2,165 support might start another substantial decline. In the stated case, Ether could test the $2,080 support. Any more losses might send the price toward the $2,000 level.

Technical Indicators

Hourly MACDThe MACD for ETH/USD is losing momentum in the bearish zone.

Hourly RSIThe RSI for ETH/USD is now below the 50 level.

Major Support Level – $2,165

Major Resistance Level – $2,240

Read More
Blockchain

SOL Price Recovery Could Soon Fade If Solana Fails To Clear This Hurdle

Solana is attempting a recovery wave from the $80 zone. SOL price could struggle to clear the $92 and $94 resistance levels in the near term.

SOL price started a fresh decline from the $104 resistance against the US Dollar.
The price is now trading below $95 and the 100 simple moving average (4 hours).
There was a break above a key bearish trend line with resistance at $85.00 on the 4-hour chart of the SOL/USD pair (data source from Kraken).
The pair could start another decline if it fails to clear the $92 or $94 resistance.

Solana Price Faces Key Hurdles

Solana price started a fresh decline like Bitcoin and traded below the $95 support zone. There was a clear move below the $92 and $90 support levels.

Finally, SOL price found support near the $79 zone. A low was formed near $78.96, and the price is now attempting a recovery wave like Ethereum. There was a move above the $84 resistance. The price climbed above the 23.6% Fib retracement level of the downward move from the $103.40 swing high to the $78.96 low.

Besides, there was a break above a key bearish trend line with resistance at $85.00 on the 4-hour chart of the SOL/USD pair. It is now trading below $95 and the 100 simple moving average (4 hours).

Immediate resistance is near the $91.20 level. It is close to the 50% Fib retracement level of the downward move from the $103.40 swing high to the $78.96 low. The first major resistance is near the $94 level or the 100 hourly SMA.

Source: SOLUSD on TradingView.com

The main resistance is now near $98. A successful close above the $98 resistance could set the pace for another major increase. The next key resistance is near $112. Any more gains might send the price toward the $120 level.

Another Decline in SOL?

If SOL fails to rally above the $91.20 resistance, it could start another decline. Initial support on the downside is near the $84.80 level.

The first major support is near the $80.00 level, below which the price could test $75.00. If there is a close below the $68 support, the price could decline toward the $72.50 support in the near term.

Technical Indicators

4-Hours MACD – The MACD for SOL/USD is gaining pace in the bearish zone.

4-Hours RSI (Relative Strength Index) – The RSI for SOL/USD is below the 50 level.

Major Support Levels – $84.80, and $80.00.

Major Resistance Levels – $91.20, $94.00, and $98.00.

Read More
Blockchain

Bitcoin ETF Day 8 Update: Market Rebound Signals Bottom As Grayscale Selling Slows Down

Since the approval of Bitcoin ETF applications by the US Securities and Exchange Commission (SEC) on January 11, followed by the commencement of trading a day later, the ETF race has witnessed impressive trading volumes on each trading day.

As the market recovers from a sharp correction, recent developments indicate a notable slowdown in Grayscale selling, which could potentially signal a rebound for the Bitcoin price following the recent 20% drop.

Market expert James Mullarney and Bloomberg ETF expert Erich Balchunas provide key insights into Bitcoin ETF fund flows after 8 days, shedding light on the evolving dynamics and investor sentiments surrounding this development.

Hope For Bitcoin Bulls 

One of the key observations made by James Mullarney is the deceleration in Grayscale’s selling activities. While Grayscale continues to sell, the pace of their selling has significantly reduced, indicating a potential shift in their strategy. 

This is seen as a positive sign for the market, as a slowdown in Grayscale selling could contribute to stabilizing Bitcoin prices and restoring investor confidence.

Amidst this backdrop, major players in the asset management industry, such as BlackRock and Fidelity, have showcased their resilience and commitment to Bitcoin. 

BlackRock, one of the world’s largest asset managers, currently holds 44,000 BTC in assets under management (AUM), indicating their growing exposure to the cryptocurrency. 

Similarly, Bitcoin ETF issuer Fidelity, renowned for its digital asset services, stands strong with 40,000 BTC AUM, demonstrating their continued confidence in Bitcoin and its long-term potential.

Moreover, the dynamics of the recent sell-off are noteworthy. The majority of the selling pressure observed in the market involved FTX, which completed day 8 of trading. 

However, as the market enters day 9, the expectation is for a significant reduction in selling pressure from FTX and Grayscale, potentially contributing to a more stable market environment, according to Mullarney. 

The emergence of Bitcoin ETFs as significant holders of the cryptocurrency is another positive aspect to consider. ETFs have not only absorbed the 101,600 BTC sold by Grayscale but have also increased their holdings by an additional 21,100 BTC in just 8 days. 

According to  Mullarney, this indicates growing institutional interest in Bitcoin, as ETFs continue to accumulate significant amounts of the cryptocurrency.

Bitcoin ETF Issuers Counter Grayscale Selling

Despite Grasycale’s selling spree, Mullarney highlights that the Bitcoin ETF managers alone are acquiring 15 times the daily Bitcoin supply, surpassing 13,444 BTC against the 900 BTC daily creation rate. 

This notable inflow of BTC demonstrates the strong demand from institutional investors and highlights the potential impact of ETFs on the overall Bitcoin market. 

Interestingly, the new ETFs have absorbed a net total of 122,000 BTC in just 8 days, overcoming the impact of Grayscale’s release and contributing to a positive net inflow.

Bloomberg ETF expert Erich Balchunas adds further insights to the analysis. Balchunas notes that the volume of Grayscale Bitcoin Trust (GBTC) has decreased, which could be a sign of exhaustion in selling. 

However, $515 million was withdrawn from GBTC yesterday, resulting in a total outflow of $3.96 billion since its conversion to an ETF. On a more positive note, there was a net inflow of $409 million on the ninth day, indicating renewed investor interest.

Featured image from Shutterstock, chart from TradingView.com

Read More
Blockchain

Bitcoin Price At Make-Or-Break Moment, Key Levels To Watch

Bitcoin price started an upside correction from the $38,500 support zone. BTC could gain bullish momentum if it clears the $40,500 resistance zone.

Bitcoin price is attempting a recovery wave from the $38,500 support zone.
The price is trading below $40,000 and the 100 hourly Simple moving average.
There is a major bearish trend line forming with resistance near $40,400 on the hourly chart of the BTC/USD pair (data feed from Kraken).
The pair might struggle to recover above the $40,400 and $40,500 resistance levels.

Bitcoin Price Attempts Recovery

Bitcoin price extended its decline below the $40,000 support zone. BTC even spiked below the $49,200 level and tested the $38,500 support zone. A new weekly low was formed near $38,518 and the price started an upside correction.

There was a recovery wave above the $39,200 and $39,500 levels. However, Bitcoin is now trading below $40,000 and the 100 hourly Simple moving average.

Immediate resistance is near the $40,400 level. There is also a major bearish trend line forming with resistance near $40,400 on the hourly chart of the BTC/USD pair. The trend line is close to the 50% Fib retracement level of the downward wave from the $42,260 swing high to the $38,518 low.

The next key resistance could be $40,500, above which the price could rise and test $40,850. It is close to the 61.8% Fib retracement level of the downward wave from the $42,260 swing high to the $38,518 low.

Source: BTCUSD on TradingView.com

A clear move above the $40,850 resistance could send the price toward the $41,500 resistance. The next resistance is now forming near the $42,000 level. A close above the $42,000 level could push the price further higher. The next major resistance sits at $42,500.

Another Drop In BTC?

If Bitcoin fails to rise above the $40,400 resistance zone, it could start another decline. Immediate support on the downside is near the $39,400 level.

The next major support is $38,500. If there is a close below $38,500, the price could gain bearish momentum. In the stated case, the price could visit the $37,000 support in the near term.

Technical indicators:

Hourly MACD – The MACD is now losing pace in the bearish zone.

Hourly RSI (Relative Strength Index) – The RSI for BTC/USD is now above the 50 level.

Major Support Levels – $39,400, followed by $38,500.

Major Resistance Levels – $40,400, $40,500, and $40,850.

Read More
Blockchain

Ethereum Is The Biggest Winner In Post-ETF Approval Market: Glassnode

While Bitcoin has struggled since the much-anticipated spot ETFs have gone live, Ethereum has emerged as a winner in the sector.

Ethereum Has Done Better Against Both Bitcoin And Altcoins Recently

In its latest weekly report, the on-chain analytics firm Glassnode has discussed how Bitcoin, Ethereum, and the altcoins have performed against each other recently.

The cryptocurrency sector as a whole has enjoyed a net rise since BlackRock first filed for its exchange-traded fund (ETF) last year.

This period was filled with speculation about whether the various spot ETFs would go through. Still, starting mid-October, the assets rose as confidence that approval would be achieved went up.

“Bitcoin’s market cap has increased by +68.8% since BlackRock first filed for their ETF, and the aggregate Altcoin Market Cap followed suit, rising by +68.9%,” reads the report. “However, Ethereum has seen more sluggish relative momentum, underperforming the wider altcoin space by -17%.”

Next, Glassnode has talked about the “market cap dominance” of these asset classes, which measures the percentage share they occupy in the total valuation of the cryptocurrency sector.

Since the FTX collapse in November 2022, Bitcoin’s market cap dominance has notably risen. However, BTC hasn’t taken a share of Ethereum as the second-largest coin’s dominance has moved mostly sideways in this period. Instead, the altcoins and stablecoins are the ones who have lost dominance to Bitcoin.

The BTC spot ETFs finally gained approval earlier this month, but the event turned out to be a sell-the-news one for the asset. In this post-ETF era, though, a new narrative has appeared in the sector in the form of the ETH spot ETFs.

“Shortly after the approval of the Bitcoin ETF, several issuers have filed or suggested a willingness to advocate for a spot ETF for Ethereum,” notes Glassnode. “Although obtaining approval for an ETH-based ETF might be more challenging due to the SEC possibly considering Ether as more of an investment contract, the markets appeared to express optimism.”

As the chart below shows, Ethereum’s dominance against Bitcoin has gone up.

As the graph shows, ETH’s market cap dominance versus BTC has increased by about 2.9% since the latter’s spot ETFs gained approval from the US SEC.

The altcoin side of the sector has seen a net rise in this period as well, but the alts haven’t been able to keep up with ETH, as the latter has generally outperformed them.

In total, Ethereum has earned 4.2% in global dominance. “This makes ETH the biggest winner in the post-ETF approval market movements,” explains the analytics firm.

ETH Price

At the time of writing, Ethereum is trading at around $2,230, up 1% in the last 24 hours.

Read More
Blockchain

Solana Unveils Token Extensions As SOL Bounces Back, Surging 5%

The Solana Foundation, a non-profit organization dedicated to decentralization, adoption, and security on the Solana network, has launched token extensions.  

Solana Token Extensions Gains Traction

According to a January 24 announcement, token extensions provide developers, enterprises, financial institutions, and Solana-native development teams with a comprehensive suite of turnkey solutions for advanced token functionality. Anatoly Yakovenko, co-founder of Solana and CEO of Solana Labs, commented on the launch, stating: 

Token extensions build on the characteristics that make Solana the ideal destination for developers. Solana is the first network to offer this level of integrated developer and user experience in a single token program. We’re already seeing the potential to build using token extensions via deployments from some of the most recognizable names in crypto.

Industry giants Paxos and GMO-Z.com Trust Company Inc. (GMO Trust) are leading the way in adopting token extensions. As announced by the Solana Foundation, these companies are “leveraging the benefits” of token extensions to issue stablecoins on the Solana blockchain. 

As previously reported, Paxos, a regulated blockchain and tokenization infrastructure platform, expanded its stablecoin issuance to the network in December. Similarly, GMO Trust announced the launch of the first regulated Japanese yen stablecoin and their own US dollar stablecoin on the Solana network. 

New Standards For Blockchain Compliance? 

Sheraz Shere, Head of Payments at the Solana Foundation, emphasized the appeal of the Solana network for enterprise-grade companies entering the web3 space. Shere stated: 

Companies like Visa, Worldpay, Stripe, Google, and Shopify have already seen the performance advantages inherent to the Solana network and have launched solutions and applications that are only possible on Solana. With token extensions, we are expanding what is possible for enterprise adoption of blockchain by natively enabling features that matter to large regulated enterprises.

Token extensions, designed to cater to builders across diverse industries such as stablecoins, real-world assets (RWA), and payments, offer a range of interesting features:

Transfer Hooks: Enables token issuers to exert control over token interactions, empowering developers to create intricate and flexible token mechanisms.
Transfer Fees: Provides the ability to charge fees for each token transfer, offering sustainable revenue models for different types of tokens built using token extensions.
Confidential Transfers: Utilizes zero-knowledge proofs to encrypt the transfer amount while publicly sharing the source, destination, and token type. This ensures compliance while preserving privacy.
Permanent Delegate Authority: Grants token issuers absolute authority over their tokens, particularly for those requiring revocation ability, such as licenses or credentials.
Non-transferability: Restricts token transfers to the issuer only, making it ideal for unique user identification and credentialing purposes.

Ultimately, with the launch of token extensions, Solana aims to position itself as a force in blockchain development, offering builders the tools to create new applications across various industries. 

The SOL token experienced a sharp drop of over 28% in the past 30 days, leading to a decline to the $79 level. However, the token has recovered in the past 24 hours with a 5% bounce, leading to a current trading price of $87.

Featured image from Shutterstock, chart from TradingView.com 

Read More