Crypto Corner Café

Taste The Future

Blockchain

XRP Breakout: Analyst Forecasts Potential Price Surge To $11

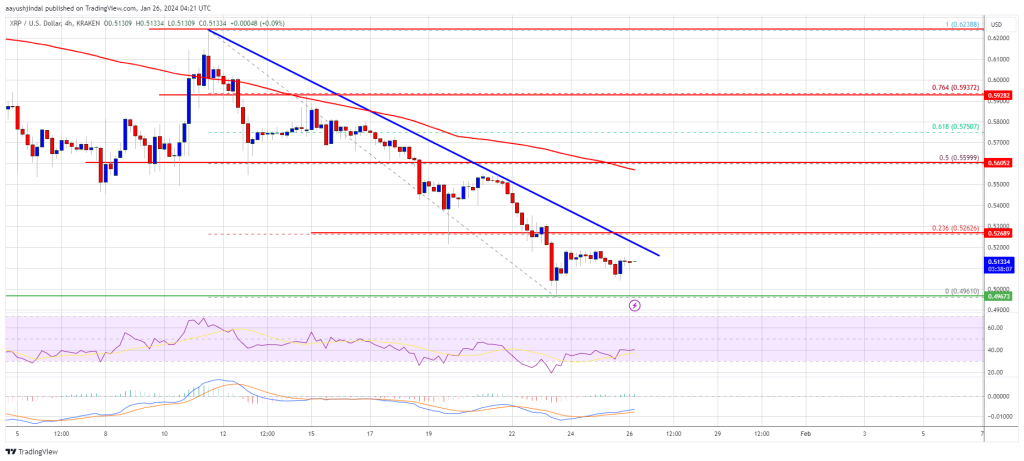
Amid the general decline surrounding the entire cryptocurrency market, XRP has been observed as one of the most affected tokens, with its price falling as low as $0.51 at a swift rate.

Potential Price Surge For XRP

The price of XRP has been witnessing a significant bearish trend for quite some time now. This has led to several speculations from market analysts about the token’s future.

However, a well-known crypto analyst, XForceGlobal, has predicted a rally for XRP that could take the asset to the pivotal $11 price mark. The analyst took to the social media platform X (formerly Twitter) to share his bold projections with the crypto community.

In his macro analysis, XForceGlobal identified that XRP has been forming a symmetrical triangle since 2021. He noted a triangle scenario as the main focus of his forecast.

This symmetrical triangle was formed as a result of the upper descending trendline and the lower ascending trendline. According to data from the expert’s weekly chart, after XRP fell to a low of $0.1013 in March 2020, the token created the lower ascending trendline of the triangle.

However, it was not until the asset’s decline from $1.96 in April 2021 that the upper descending trendline was formed. Since then, XRP has not been able to break above or below the triangle.

XForceGlobal projects that as XRP approaches the triangle’s peak, it will initially plummet further to retest the lower trendline. After that, the expert predicts a significant upswing leading to an ascending breakout.

Furthermore, he asserts that the larger triangles’s ability to withstand three years of data is the largest accumulation of any token.

XForceGlobal stated:

The larger triangle scenario now has a solid three years of data which makes it the largest accumulation of any coin without breaking any major lows at the time of writing.

With his analysis, XForceGlobal has put his “conservative price” for the asset between “$9 to $11” in case the breakout happens. “I would be conservative with my targets in the coming years of around $9-$11 if the triangle scenario happens,” he stated.

The Crypto Asset Has Seen A Massive Breakdown

Another crypto analyst, Crypto Rover, has taken to X to share the effects of the decline that XRP has been observing. He underscored that the decline has seen a “massive breakdown” since the Q2 of 2021.

Rover shared a chart of the digital asset to further emphasize his analysis. As seen by Rover, XRP fell from a peak of about $1.82 in mid-April 2021 to the present price of $0.51.

Since then, the token seems to have been trading in a symmetric triangle. With the price breaking through the triangle’s base, further decline could happen if not controlled.

At the time of writing, XRP was trading at $0.5125, showing a 6.10% decrease over the past week. Its market cap is up by 0.38%, while its trading volume is down by over 3%, according to CoinMarketCap.

Read More
Blockchain

Bitcoin Price: Head Fund Manager Predicts ‘Opportunity Of The Year’ Soon

Charles Edwards, the founder of hedge fund Capriole Investments, offered an in-depth analysis of the Bitcoin market yesterday. His review offers a granular perspective on the aftermath of the historic ETF launches, the pivotal role of major players like Grayscale, and the interplay of market mechanics shaping Bitcoin’s trajectory.

Bitcoin Market Summary: ETF Launch

Edwards acknowledged the ETF launches as a pivotal moment, characterizing it as “ETF Mania.” He emphasized the hindsight realization that the ETF launch triggered a short-term “sell the news event.” Edwards elucidated, “A portion of this can be attributed to the Grayscale outflows of over $4B, approximately half of which was forced selling by the FTX bankruptcy estate and another couple billion likely to cover Grayscale’s debt obligations.”

However, he projects a shift in the outflow rate from Grayscale, stating, “I expect the current rate of outflow will drop to a more sustainable trickle over the next few weeks (after another few billion out).” Edwards also highlighted the end of Grayscale’s multi-year lock-up period, allowing long-term investors to finally close their GBTC positions at market prices.

Regarding Blackrock and Fidelity ETFs, Edwards noted their significance, saying, “The brand names of these two behemoths in the traditional asset management space means every billion they bring in, adds an order of magnitude more credibility (and therefore flows) into Bitcoin and crypto as a whole.”

BTC Technical Analysis

In his high timeframe technicals (HTF) analysis, Edwards observed a strong rejection at mid-range resistance during the ETF launch. He pointed out, “The nearest HTF support at $35K would likely represent a great opportunity to get long for the 2024 Halving year (if we are lucky enough to get there).” Edwards also mentioned, “Alternatively, a strong close above $44K will likely see the trend continue to range highs ($60K).”

For low timeframe technicals (LTF), he dissected the December/January consolidation and the $44K “fakeout” during the ETF launch. Edwards explained, “Fakeouts often resolve in price movements to the other side of the range, as we saw.” He added:

Therefore, the most interesting price point locally is $41K. A daily close above $41K would likely represent a downtrend fakeout and a swift return to range high at $44K (+). If we simply wick into $41K and start trending back down, that would be a great risk-off trigger for a potential move lower toward $35K HTF support.

Fundamentals: The Role Of On-Chain Data

Edwards underscored the importance of fundamentals and on-chain data in understanding market dynamics. He introduced Capriole’s Bitcoin Macro Index, stating, “This Index includes over 50 of the most powerful Bitcoin on-chain, macro market and equities metrics combined into a single machine learning model. This is a pure fundamentals-only value investing approach to Bitcoin. Price isn’t an input.”

According to him, fundamentals have entered a period of slowdown which aligned with the near top at the ETF launch. “That fundamental slowdown continues today with price down -20% from the highs in January so far,” Edwards remarked.

Chart Of The Week

The hedge fund manager also introduced the Advance-Decline (AD) Line as a chart of the week. He explained, “The AD Line is calculated as the cumulative sum through time of each day’s count of advances less declines.” Edwards highlighted its relevance, stating, “Today we are seeing the first such breakout since 2016.”

He drew parallels between the AD Line’s breakout and Bitcoin’s historical performance, noting, “During these periods in 2013 and 2016, Bitcoin was also in a drawdown from all-time-highs (like today) and began two of its largest cyclical rallies in history.”

The Opportunity Of The Year

In conclusion, Edwards offered a nuanced outlook. He cautioned, “Bitcoin at $39-40K is not a screaming buy today.” However, he projected, “The opportunity of the year likely awaits in the $32-35K region, which if we are lucky enough to see, will probably be the last time we ever see it.”

Edwards concluded with a forward-looking perspective, stating, “Pending that, we await patiently for a momentum breakout of $41K (aggressive) and $44K (conservative) for resumption of the meat of the primary 2024 trend. Up.”

At press time, BTC traded at $40,003.

Read More
Blockchain

Shiba Inu On Fire: Over 12 Million SHIB Vaporized – Impact On Price

The Shiba Inu meme coin community is currently abuzz with a palpable sense of excitement, courtesy of two key developments: a surge in token burning and promising advancements in the Shibarium layer-2 solution. While the cryptocurrency market is inherently volatile and unpredictable, these recent developments present a potential trajectory for Shiba Inu’s long-term growth and stability.

Shiba Inu’s Burning Surge: Impactful Trends

Shiba Inu has ignited a fervent blaze of token burning, sending ripples across the cryptocurrency landscape. In the span of just 24 hours, the token witnessed an astounding 12 million SHIB tokens burned.

Source: Shibburn

This surge in incineration is not a fleeting phenomenon; rather, it marks a consistent trend since the beginning of 2024. Over this period, the flames of token destruction have steadily climbed, devouring over 9 billion SHIB tokens, equivalent to 10% of the total burned throughout the entirety of 2023. The overarching goal of this orchestrated effort is to curtail the circulating supply, creating an environment of scarcity that holds the potential for future price appreciation.

However, amidst the excitement, whispers of skepticism linger on the periphery of this fiery spectacle. The cryptocurrency market, characterized by its capricious nature, is subject to a multitude of influencing factors. While token burning contributes to scarcity and has the potential to stimulate demand, external forces such as macroeconomic trends and broader market sentiment wield significant influence.

The fiery dance of Shiba Inu is sustained by two distinct mechanisms:

Transaction Fees: Each Shiba Inu transaction contributes a portion of its value to the pyre, forever eliminating these tokens from circulation. This process, while manual, plays a crucial role in the ongoing burn rate.
Shibarium: This recently launched layer-2 solution introduces a transformative token burning mechanism designed to automate the scorching process. This automation is a pivotal step in optimizing Shiba Inu’s scalability and transaction speeds, potentially broadening its appeal and stoking the flames of adoption.

Shibarium Milestone: 300 Million Transactions

The Shibarium inferno continues to blaze with vigor, surpassing a noteworthy milestone of 300 million total transactions. This achievement underscores the growing traction of the layer-2 solution within the Shiba Inu ecosystem, adding fuel to the flames of optimism regarding its future impact.

At the time of writing, SHIB was trading at $0.058, up 0.3% in the last 24 hours, but sustained a 3.6% loss in the last seven days, data from Coingecko shows.

The burning of such a substantial volume of tokens raises questions about the potential impact on Shiba Inu’s price dynamics. The deliberate effort to reduce the circulating supply through this intense token destruction suggests a strategic move towards scarcity, a factor that traditionally influences demand and could potentially lead to price appreciation.

Featured image from Pixabay, chart from TradingView

Read More
Blockchain

XRP Price Takes Hit, Can Buyers Save The Key $0.50 Support?

XRP price is consolidating above the $0.50 support. The price could gain bearish momentum if there is a close below the $0.50 support.

XRP is showing bearish signs below the $0.525 and $0.550 resistance levels.
The price is now trading below $0.525 and the 100 simple moving average (4 hours).
There is a connecting bearish trend line forming with resistance near $0.520 on the 4-hour chart of the XRP/USD pair (data source from Kraken).
The pair start a fresh increase if it clears the $0.520 and $0.525 resistance levels.

XRP Price Revisits Key Support

In the past few days, XRP price saw a fresh decline below the $0.550 support. The bears were able to push the price into a short-term bearish zone below $0.525, like Bitcoin and Ethereum.

The price even spiked below the $0.500 support. A low was formed near $0.4961, and the price is now consolidating losses. It is back above the $0.500 level and showing signs of a minor recovery wave. It is now trading below $0.525 and the 100 simple moving average (4 hours).

On the upside, immediate resistance is near the $0.520 zone. There is also a connecting bearish trend line forming with resistance near $0.520 on the 4-hour chart of the XRP/USD pair. The trend line is close to the 23.6% Fib retracement level of the downward wave from the $0.6240 swing high to the $0.4960 low.

The first key resistance is near $0.532, above which the price could rise toward the $0.560 resistance. It is close to the 50% Fib retracement level of the downward wave from the $0.6240 swing high to the $0.4960 low.

Source: XRPUSD on TradingView.com

A close above the $0.560 resistance zone could spark a strong increase. The next key resistance is near $0.594. If the bulls remain in action above the $0.594 resistance level, there could be a rally toward the $0.620 resistance. Any more gains might send the price toward the $0.650 resistance.

Another Drop?

If XRP fails to clear the $0.525 resistance zone, it could start a fresh decline. Initial support on the downside is near the $0.500 zone.

The next major support is at $0.495. If there is a downside break and a close below the $0.495 level, XRP price might accelerate lower. In the stated case, the price could retest the $0.450 support zone.

Technical Indicators

4-Hours MACD – The MACD for XRP/USD is now losing pace in the bearish zone.

4-Hours RSI (Relative Strength Index) – The RSI for XRP/USD is now below the 50 level.

Major Support Levels – $0.500, $0.495, and $0.450.

Major Resistance Levels – $0.520, $0.525, and $0.560.

Read More
Blockchain

Ethereum’s Path To Recovery: Analyst Highlights 3 Key Factors Pointing To A Price Boom

Michael van de Poppe, a prominent crypto analyst, recently outlined three key factors that could herald a bullish phase for Ethereum, the second-largest crypto by market capitalization. One crucial factor he identifies is Bitcoin’s current behavior.

The analyst pointed out that as the market leader, Bitcoin’s recent signs of bottoming out tend to precede altcoin rallies, hinting at a potential upswing for Ethereum. Moreover, Van de Poppe highlights the growing anticipation surrounding spot Ethereum exchange-traded funds (ETFs).

According to Van de Poppe, the increasing buzz about these spot ETFs is a significant catalyst that could drive Ethereum’s value over the coming weeks.

Additionally, Ethereum is on the cusp of rolling out critical network upgrades. These updates, aimed at reducing transaction costs by up to 90%, are expected to improve the network’s efficiency and scalability significantly.

The momentum towards $ETH is probably going to come in the next few weeks.

Arguments:
#Bitcoin bottoming out is a trigger for altcoins to make a new run.
– Ethereum Spot ETF hype.
– Ethereum launching new upgrades to reduce 90% of the costs. pic.twitter.com/N8bDi52F8M

— Michaël van de Poppe (@CryptoMichNL) January 25, 2024

Latest Update On Ethereum Deacon Upgrade

Regarding updates, Ethereum’s development team is making strides with the upcoming Dencun upgrade, a significant “hard fork” that aims to enhance the blockchain’s efficiency.

Tim Beiko, a core Ethereum developer, updated the community earlier today on the progress. Dencun, which incorporates “proto-danksharding,” is set to reduce transaction costs on layer 2 solutions, making Ethereum more accessible and affordable for users.

According to the developer, the upgrade is scheduled to activate on the Sepolia testnet on January 30 and the Holesky testnet on February 7, with mainnet implementation following if these tests succeed.

More testnet blobs on the way .oO

Dencun will activate on Sepolia Jan 30, and on Holesky Feb 7. If running a node on either network, now’s the time to update it!

Assuming both of these go smoothly, mainnet is next https://t.co/QbEUACix2S

— timbeiko.eth (@TimBeiko) January 25, 2024

Brighter Future Ahead

Despite these positive developments, Ethereum’s market performance mirrors the overall bearish sentiment in the crypto market, led by Bitcoin. ETH has seen a 13.7% decline in the past week, currently trading at $2,216.

However, analysts like Van de Poppe urge caution, particularly regarding the impact of the Bitcoin spot ETF. While there may be short-term selling pressure, Van de Poppe remains optimistic about the long-term prospects.

The analyst suggests that the influx of new capital from diverse market participants could propel Bitcoin, and by extension, Ethereum, to new heights.

The markets need to be more accurate with the impact of the ETF.

There’s some selling pressure in the short term, but in the long term, a massive amount of new money flows into the markets from new participants.

As a result, #Bitcoin might push higher this cycle than we think.

— Michaël van de Poppe (@CryptoMichNL) January 25, 2024

Featured image from Unsplash, Chart from TradingView

Read More
Blockchain

Bank Of England Reconsiders: Potential Freeze On CBDC Launch Raises Concerns

On January 25, the Bank of England (BoE) and HM Treasury published a response to the Consultation Paper regarding a ‘digital pound’ issued in February of 2023.  The consultation paper sought the public’s feedback on introducing a UK central bank digital currency (CDBC).

Is The UK Ready To Introduce Their CBDC?

The BoE and HM Treasury consider that introducing a CBDC could provide people with an “additional choice of safe payment that is fit for the future,” unlock development opportunities for businesses, and make day-to-day payments more “convenient” while reducing costs for those who accept them.

The consultation response highlighted that the consultation marked the beginning of the design phase of the digital pound project and, according to the BoE and HM Treasury, the developing process of a CBDC and its platform will present lasting benefits for the digital economy of the country, regardless of the decision that is ultimately taken.

The consultation collected over 50,000 responses from the public, including individuals, businesses, and academia. The feedback illustrated some general concerns the respondents had regarding the digital pound.

Due to these concerns, the response by the BoE and UK Treasury determined that “it is too early” to decide whether to introduce a digital pound, as the feedback makes clear “that legislation introduced by the Government for a digital pound would need to provide protections to guarantee users’ privacy and control of their money.”

Respondents Concern Over A Digital Pound

The feedback received from the respondents brought forward two key concerns: privacy and the possibility of cash being replaced.

The response clarified that a digital pound would not replace cash, any existing form of money, or payment like debit and credit cards. However, it would complement physical money and other payment methods “as a new form of digital money for use by households and businesses for their everyday payment needs.”

To guarantee this, the response explained that “the Government has legislated to safeguard access to cash, ensuring that it would remain available even if a digital pound were launched.”

Regarding user privacy, the response acknowledged the importance of ensuring trust in a CBDC issued by the central bank is essential. Therefore, to guarantee that privacy is a core design feature of a digital pound, the following measures were made: the BoE and HM Treasury won’t have access to users’ data.

The BoE committed to exploring technological options to prevent the bank from accessing users’ data through its core infrastructure, and the BoE and UK Treasury would not program the digital pound.

The BoE and HM Treasury assured their commitment “to maintaining an open and collaborative approach throughout this design phase” by increasing both organization’s engagement with experts from the industry, civil society, academics, and technical specialists.

Lastly, the response confirms that experiments will be undertaken with companies “to test how a digital pound could work in the real world.”

The launch of the CBDC will be decided after the design phase culminates around 2025. If the decision to build a digital pound is taken, its introduction will come only after both Houses of Parliament have passed the relevant legislation.

Read More
Blockchain

Ethereum Price Could See Technical Correction But Upsides Might Be Limited

Ethereum price is attempting a recovery wave above the $2,200 zone. ETH could start a decent increase if it settles above the $2,240 resistance.

Ethereum started an upside correction from the $2,165 zone.
The price is trading below $2,250 and the 100-hourly Simple Moving Average.
There is a short-term bearish trend line forming with resistance near $2,225 on the hourly chart of ETH/USD (data feed via Kraken).
The pair might start a decent increase if it clears the $2,240 resistance zone.

Ethereum Price Eyes Recovery

Ethereum price managed to form a support base above the $2,165 level. ETH seems to be consolidating losses near the $2,200 level and might aim for a recovery wave, like Bitcoin.

There was a minor upside correction above the $2,200 level, but the bears are still active near the $2,240 resistance zone. There is also a short-term bearish trend line forming with resistance near $2,225 on the hourly chart of ETH/USD.

Ethereum is now trading below $2,250 and the 100-hourly Simple Moving Average. On the upside, the first major resistance is near the $2,240 level. It is close to the 23.6% Fib retracement level of the key drop from the $2,480 swing high to the $2,165 low.

The next major resistance is near the $2,280 or the 100-hourly Simple Moving Average, above which the price might rise and test the 50% Fib retracement level of the key drop from the $2,480 swing high to the $2,165 low. If the bulls push the price above the $2,320 resistance, they could aim for $2,360.

Source: ETHUSD on TradingView.com

A clear move above the $2,360 level might start a decent increase. In the stated case, the price could rise toward the $2,420 level. Any more gains might send the price toward the $2,500 zone.

Another Failure in ETH?

If Ethereum fails to clear the $2,240 resistance, it could start another decline. Initial support on the downside is near the $2,200 level.

The next key support could be the $2,165 zone. A daily close below the $2,165 support might start another major decline. In the stated case, Ether could test the $2,080 support. Any more losses might send the price toward the $2,000 level.

Technical Indicators

Hourly MACDThe MACD for ETH/USD is losing momentum in the bearish zone.

Hourly RSIThe RSI for ETH/USD is now above the 50 level.

Major Support Level – $2,165

Major Resistance Level – $2,240

Read More
Blockchain

Why Cardano Could Be The Next Big Crypto Winner: An Influencer’s Perspective

In a recent video from the crypto-based YouTube channel Cheeky Crypto, the host underscores Cardano’s (ADA) approach, which separates it from its contenders, particularly its reliance on “academic rigor” and “research-driven development.”

Dropping out his reasons for being bullish on Cardano, the host highlighted the blockchain’s core use cases; starting in the video, the host defined Cardano as a proof-of-stake (PoS) blockchain platform developed using a “methodical, evidence-driven approach,” firmly anchored in the principles of “scientific research and academic thought.”

According to the host, the Cardano development team aims to “restore trust in the global economic system.” This involves creating technologies that “foster secure, transparent, and sustainable international business practices.”

Cardano To Become A Frontrunner

Diving deeper into the video, the Cheeky Crypto host disclosed that aside from advanced technology, the platform is also about making a “real-world impact,” especially in developing regions.

According to the host, the platform has initiated projects to provide financial services to the world’s “unbanked population,” which is estimated to be about $1.7 billion people. Cardano’s partnership with World Mobile in Africa is an example of such highlighting. The host noted:

They (Cardano) are working with projects like World mobile to connect more people to the world as well as in my opinion create new economies and change many people’s lives.

The Cheeky Crypto host also points out Cardano’s contribution to the decentralized applications (DApps) sector. With a keen “focus on security and scalability,” Cardano is creating a more stable environment for DApps., the host stated.

Discussing the blockchain’s functionality, the host identifies it as a “third-generation cryptocurrency,” addressing common challenges faced by “layer one blockchain adoption.” Pointing out these challenges, the host disclosed:

This issue covers a number of blockchain concerns including topics like scalability, interoperability, sustainability and security. So Cardano seeks to basically solve these issues through the development of design principles and engineering best practices.

Concluding the use cases the host highlighted that make him bullish on Cardano, he mentioned that initially, the blockchain could process only a limited number of transactions per second. The team developed Hydra, a layer-two scaling solution employing state channels for off-chain transaction processing to overcome this.

Hydra’s introduction marks a notable leap, enabling Cardano to theoretically handle over a million transactions per second, enhancing the network’s capacity dramatically. According to the host, these use cases are why Cardano could be one of the “front runners” in the crypto sector in the future.

Cardano’s ADA Navigates Bearish Waters

Meanwhile, despite these technological strides, ADA, Cardano’s native token, has been experiencing a bearish price action. Currently trading at $0.460, ADA has lost nearly 10% of its value over the past week. Analyst Ali has recently drawn parallels between ADA’s current consolidation phase and its pattern in late 2020.

According to Ali’s analysis, should Cardano follow its late 2020 trajectory, ADA could witness a substantial upswing, potentially reaching new highs.

#Cardano‘s current consolidation phase mirrors its late 2020 behavior. If history repeats itself, we might see $ADA resuming its upward trend around April. This pattern continuation could potentially lead to an upswing toward $0.80, a brief correction to $0.60, then $7! pic.twitter.com/RuRA2EDMNP

— Ali (@ali_charts) January 19, 2024

Featured image from Unsplash, Chart from TradingView

Read More
Blockchain

Bitcoin Price Eyes Recovery But Can BTC Bulls Regain Strength?

Bitcoin price is aiming for an upside break above the $40,500 resistance. BTC bulls could face heavy resistance near $40,850 and $41,350.

Bitcoin price is attempting a recovery wave from the $38,500 support zone.
The price is trading just above $40,000 and the 100 hourly Simple moving average.
There is a crucial bearish trend line forming with resistance near $40,250 on the hourly chart of the BTC/USD pair (data feed from Kraken).
The pair could struggle to settle above the $40,400 and $40,500 resistance levels.

Bitcoin Price Eyes Upside Break

Bitcoin price remained well-bid above the $38,500 support zone. BTC formed a base and recently started a consolidation phase above the $39,000 level.

The price was able to recover above the 23.6% Fib retracement level of the downward move from the $42,261 swing high to the $38,518 low. The bulls seem to be active above the $39,200 and $39,350 levels. Bitcoin is now trading just above $40,000 and the 100 hourly Simple moving average.

However, there are many hurdles near $40,400. Immediate resistance is near the $40,250 level. There is also a crucial bearish trend line forming with resistance near $40,250 on the hourly chart of the BTC/USD pair.

The next key resistance could be $40,380 or the 50% Fib retracement level of the downward move from the $42,261 swing high to the $38,518 low, above which the price could rise and test $40,850. A clear move above the $40,850 resistance could send the price toward the $41,250 resistance.

Source: BTCUSD on TradingView.com

The next resistance is now forming near the $42,000 level. A close above the $42,000 level could push the price further higher. The next major resistance sits at $42,500.

Another Failure In BTC?

If Bitcoin fails to rise above the $40,380 resistance zone, it could start another decline. Immediate support on the downside is near the $39,420 level.

The next major support is $38,500. If there is a close below $38,500, the price could gain bearish momentum. In the stated case, the price could dive toward the $37,000 support in the near term.

Technical indicators:

Hourly MACD – The MACD is now losing pace in the bearish zone.

Hourly RSI (Relative Strength Index) – The RSI for BTC/USD is now above the 50 level.

Major Support Levels – $39,420, followed by $38,500.

Major Resistance Levels – $40,250, $40,400, and $40,850.

Read More
Blockchain

Q4 Triumph For Fantom (FTM): Circulating Market Cap Outpaces All Cryptos With 140% Surge

In the fourth quarter of 2023, the cryptocurrency market experienced a notable resurgence, accompanied by the anticipation of a potential Bitcoin ETF approval. Among the standout performers during this period was Fantom (FTM), a Layer-1 protocol launched in 2018. 

According to a recent report by Messari, Fantom witnessed significant growth, with its circulating market cap soaring by 140% quarter-over-quarter, from $0.5 billion to $1.3 billion.

This performance surpassed all cryptocurrencies’ overall market cap growth at 54% in Q4. Additionally, Fantom climbed up the market cap rankings, ascending five spots from 63 to 58 by the end of the quarter.

FTM’s Potential For Future Growth

The circulating supply of FTM remained relatively stable quarter-over-quarter, with changes in supply dynamics between Q4 2022 and Q1 2023. 

Notably, Fantom introduced the Ecosystem Vault and Gas Monetization program during Q4 2023, reducing the burn rate of transaction fees and reallocating a portion of fees to the Gas Monetization program and Ecosystem Vault. 

The number of daily active addresses on the Fantom network experienced a 27% decline quarter-over-quarter, averaging 32,700 in Q4’23. However, a steady increase in daily active addresses throughout December indicates potential future growth as the crypto market emerges from the bearish phase. 

Average daily transactions on Fantom reversed their declining trend, surging by 126% to 531,000. This increase was primarily attributed to the emergence of Fantom Inscription FRC20s, with November 25 marking an all-time high of 5.11 million transactions, including 4.99 million inscriptions. 

In terms of new addresses, Q4’23 saw a 10% increase to an average of 21,100 daily new addresses. Messari suggests that the surge in daily new addresses can be attributed to the launch of Estfor Kingdom, a popular blockchain-based game on Fantom that gained traction in late Q3’23. December also witnessed an uptick in daily new addresses, likely influenced by improved market conditions.

Fantom DeFi Ecosystem 

Per the report, Fantom’s Total Value Locked (TVL) denominated in USD increased by 58% quarter-over-quarter, from $51 million in Q3 to $81 million in Q4. However, TVL denominated in FTM decreased by 29% in the same period, primarily due to asset price fluctuations. 

Q4’23 also witnessed shifts in the top DeFi applications on Fantom, with new entrants such as Equalizer Exchange, WigoSwap, and SpiritSwap gaining market share. Notable protocols by TVL included Spookyswap, Beethoven X, Equalizer Exchange, WigoSwap, Tomb Finance, and SpiritSwap. 

These protocols collectively gained $29 million in TVL, accounting for nearly 100% of Fantom’s TVL growth in Q4. Equalizer and WigoSwap experienced the most significant market share increases.

The average daily decentralized exchange (DEX) volume on Fantom declined by 10% to $10.2 million in Q4 2023. Still, emerging new DEXs like Equalizer Exchange and WigoSwap contributed to the ecosystem’s overall growth.

In summary, Fantom’s performance was notable in the fourth quarter of 2023. The protocol experienced a surge in market cap, robust revenue growth, and an expanding DeFi ecosystem. However, its native token has declined significantly. 

Despite the recent sharp correction across the cryptocurrency market, Fantom’s native token FTM has not been an exception. Presently, the token is trading at $0.3306, reflecting a decline of over 3% within the last 24 hours, 37% over the past 30 days, and a year-to-date decrease of 18%.

Featured image from Shutterstock, chart from TradingView.com

Read More