Crypto Corner Café

Taste The Future

Blockchain

Crypto Analyst Predicts Bitcoin To Reach $60,000, Here’s Why

Amid the recent rally that Bitcoin (BTC) experienced at the start of the week, several well-known cryptocurrency analysts seem to be bullish about the largest crypto asset, delivering multiple positive predictions for BTC in the short and long term.

Bitcoin Poised To Hit The $60,000 Price Mark

One of the famous crypto analysts who has recently shared exciting and positive predictions for Bitcoin is Ali Martinez. Martinez, known for his enthusiasm for cryptocurrency, took to the social media platform X (formerly Twitter) to share his projections with the community.

The analyst’s prediction delves into the Market Value to Realized Value (MVRV) ratio pricing band for Bitcoin. Ali Martinez has examined historical patterns seen in the previous bull markets that could send the price of BTC soaring.

According to him, the historical pattern seems to be appearing now in Bitcoin’s MVRV chart. He asserted that the BTC’s price has recovered from the mean MVRV level at $40,500, which is a similar form showing in the present market.

He added that with this form, it is possible for Bitcoin to rise in the direction of the 1.0 standard deviation line. Due to this, Martinez anticipates the price of BTC to reach a fresh yearly high of $60,000 price mark.

The post read:

We are witnessing a similar pattern now. With the recent bounce from the mean MVRV at $40,500, there is potential for BTC to surge to the 1.0 standard deviation line at $60,000.

Martinez’s latest Bitcoin analysis has since sparked fresh sentiment from the crypto community toward the digital asset. His forecast came in light of BTC experiencing a rally, taking its price to $43,000 as of Tuesday, January 30.

Investors and traders are now keeping a careful eye on these events in hopes of identifying future BTC market opportunities. This also suggests the introduction of new investors and traders in BTC.

In another X post, the expert highlighted the emergence of fresh Bitcoin addresses. He noted that about “67 new entities” now hold 1,000 BTC and above, which indicates “a 4.50% rise in two weeks.”

Analyst Delve Into BTC’s Price Action

Negentropic, the co-founder of Glassnode, has revealed his latest projections for BTC’s price action. Negentropic reported that a substantial liquidity pool for long positions had formed as Bitcoin crossed $42,200, suggesting a “neutral impulse.”

This action points to BTC‘s plan to cross the $42,000 liquidity barrier, which might bring up more market change and volatility. He further noted that due to the action, liquidations totaling “$659 million” took place.

Furthermore, as optimism rises, he expects that liquidations in short positions might reach a whopping $1 billion. As a result, it will position the market for a possible upward trend.

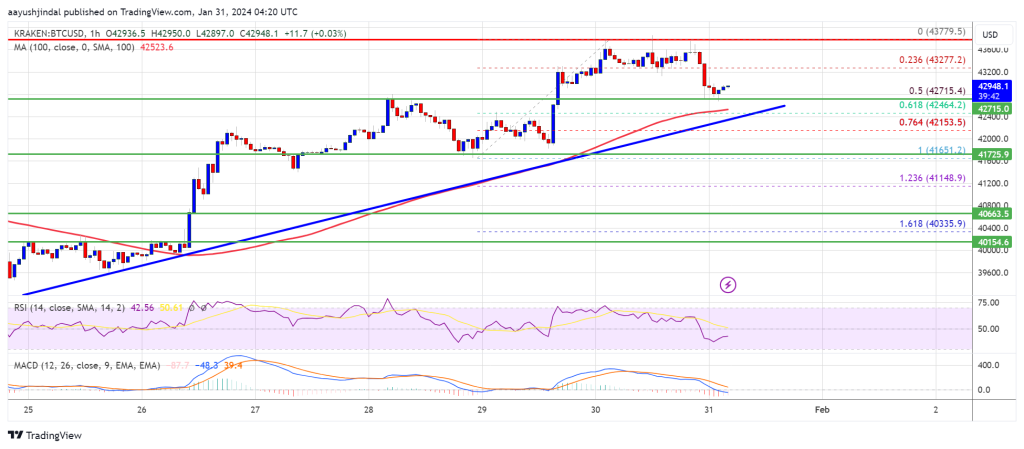
Currently, Bitcoin’s price is trading at $42,979, demonstrating an increase of over 7% in the past week. However, its market cap and trading volume are each down by 1%, according to CoinMarketCap.

Read More
Blockchain

Ripple IPO: Wall Street Veteran Explains Why Shares Could Surge 2000% Before Public Listing

Pro-XRP Wall Street financial analyst Linda Jones recently shared her thoughts on a potential Ripple Initial Public Offering (IPO). Specifically, she elaborated on her belief that the crypto firm was currently undervalued and how the company’s stocks could still rise before it went public. 

Why Ripple’s Stock Could Be Worth 20 Times Its Current Price

Linda Jones used Coinbase’s IPO as a mirror to explain why Ripple’s stock could be worth 20 times its current valuation. She noted that Coinbase was valued at $86 billion when it initially went public, and its stocks traded for as high as $429 during that period. If Ripple were to follow a similar path, then its stock price would be worth more than the $35, which it is currently valued at by private equity platform Linqto, Jones claimed. 

Interestingly, the analyst factored in Ripple’s escrowed XRP holdings while trying to estimate how much the crypto firm could eventually be valued. According to her, Ripple could be valued as high as $107 billion if those escrowed funds (said to be worth $21 billion) are added to the $86 billion (if Ripple were to be valued similarly to Coinbase).

Going by Jones’ analysis, Ripple having a valuation of $107 billion means that the company’s stocks could trade at $600 on the first day of being publicly listed. The analyst then went on to lay out a possible scenario where Ripple is valued at more than $107 billion, the amount under consideration. 

How Ripple Could End Up Being Worth Half A Trillion 

Linda Jones also mentioned that Ripple could end up being worth half a trillion if the SEC’s case against Ripple were to end soon and XRP rises back to its all-time high (ATH). If the latter happens, Ripple’s escrowed XRP holdings will be worth around $150 billion. That could ultimately increase Ripple’s value to about $500 billion, the analyst claims. 

Jones believes that Ripple being valued at $500 billion during the IPO isn’t farfetched, considering that there are companies that are already valued at up to a trillion. She further compared Ripple to the likes of Apple, Microsoft, and Nvidia, suggesting that the crypto firm could match up to these blue chip companies. 

The financial analyst’s belief in Ripple’s potential is why she boldly claims that purchasing Ripple’s stock now is a great investment, as it will only go “up” from here. She also predicts that there could be a new record for a company at its valuation, and Ripple could be that company. 

Read More
Blockchain

XRP Price Turns Red As Risk of More Downsides Escalate

XRP price is moving lower below the $0.5200 support. The price could gain bearish momentum if there is a close below the $0.50 support.

XRP is showing bearish signs below the $0.525 and $0.512 resistance levels.
The price is now trading below $0.520 and the 100 simple moving average (4 hours).
There was a break below a key contracting triangle with support at $0.5220 on the 4-hour chart of the XRP/USD pair (data source from Kraken).
The pair is now at risk of more downsides below the $0.5000 support zone.

XRP Price Takes Hit

In the past few days, XRP price heavy bearish moves below the $0.550 support. The bears remained active near the $0.5500 resistance and protected a recovery wave, unlike Bitcoin and Ethereum.

There was a fresh decline from the $0.5389 high and the bears pushed the price below $0.5200. There was a steady decline and there was a break below a key contracting triangle with support at $0.5220 on the 4-hour chart of the XRP/USD pair.

The price is now trading below $0.520 and the 100 simple moving average (4 hours). A low is formed near $0.5012, and the price is now consolidating losses. On the upside, immediate resistance is near the $0.520 zone. It is near the 50% Fib retracement level of the downward wave from the $0.5389 swing high to the $0.5012 low.

The first key resistance is near $0.530 or the 76.4% Fib retracement level of the downward wave from the $0.5389 swing high to the $0.5012 low, above which the price could rise toward the $0.5380 resistance.

Source: XRPUSD on TradingView.com

A close above the $0.5380 resistance zone could spark a strong increase. The next key resistance is near $0.5550. If the bulls remain in action above the $0.5550 resistance level, there could be a rally toward the $0.5800 resistance. Any more gains might send the price toward the $0.6000 resistance.

Key Downside Break?

If XRP fails to clear the $0.5200 resistance zone, it could continue to move down. Initial support on the downside is near the $0.502 zone.

The next major support is at $0.500. If there is a downside break and a close below the $0.500 level, XRP price might accelerate lower. In the stated case, the price could retest the $0.450 support zone.

Technical Indicators

4-Hours MACD – The MACD for XRP/USD is now gaining pace in the bearish zone.

4-Hours RSI (Relative Strength Index) – The RSI for XRP/USD is now below the 50 level.

Major Support Levels – $0.505, $0.500, and $0.450.

Major Resistance Levels – $0.520, $0.538, and $0.550.

Read More
Blockchain

Ethereum Price Trims Gains But 100 SMA Could Trigger Fresh Increase

Ethereum price extended its increase above the $2,320 resistance zone. ETH is correcting gains but the 100 hourly SMA might provide support and start a fresh increase.

Ethereum started an extended recovery wave above the $2,320 resistance zone.
The price is trading above $2,300 and the 100-hourly Simple Moving Average.
There was a break below a key bullish trend lien with support at $2,325 on the hourly chart of ETH/USD (data feed via Kraken).
The pair might start a fresh increase if it manages to stay above the $2,300 level.

Ethereum Price Holds Support

Ethereum price remained in a positive zone above the $2,250 resistance zone. ETH cleared the $2,320 resistance to move further into a positive zone, outperforming Bitcoin.

The price traded close to the $2,400 level. A high was formed near $2,390 and the price is now correcting gains. There was a move below the $2,350 level. The price broke the 50% Fib retracement level of the upward move from the $2,235 swing low to the $2,390 high.

Besides, there was a break below a key bullish trend lien with support at $2,325 on the hourly chart of ETH/USD. However, Ethereum is still above $2,300 and the 100-hourly Simple Moving Average.

Source: ETHUSD on TradingView.com

On the upside, the first major resistance is near the $2,325 level. The next major resistance is near $2,350, above which the price might rise and test the $2,400 resistance. If the bulls push the price above the $2,400 resistance, they could aim for $2,450. A clear move above the $2,450 level might send the price further higher. In the stated case, the price could rise toward the $2,550 level.

More Losses in ETH?

If Ethereum fails to clear the $2,325 resistance, it could continue to move down. Initial support on the downside is near the $2,300 level and the 100 hourly SMA.

The next key support could be the $2,295 zone or the 61.8% Fib retracement level of the upward move from the $2,235 swing low to the $2,390 high. A daily close below the $2,295 support might start another steady decline. In the stated case, Ether could test the $2,200 support. Any more losses might send the price toward the $2,120 level.

Technical Indicators

Hourly MACDThe MACD for ETH/USD is gaining momentum in the bearish zone.

Hourly RSIThe RSI for ETH/USD is now below the 50 level.

Major Support Level – $2,300

Major Resistance Level – $2,325

Read More
Blockchain

3 Signs That A Bitcoin Supply Shock Could Be Just Days Away

The Bitcoin community is currently abuzz with discussions of an impending supply shock, a market phenomenon where demand outstrips supply, potentially leading to a substantial price increase. Indicators from various sectors within the market are currently converging, suggesting that such an event may be closer than many anticipate. Here’s an in-depth look at three signs for an impending supply shock:

#1 Surging Demand For Bitcoin ETFs

Bitcoin ETFs have been creating an exceptionally large demand since their launch. Initially, this demand surge was somewhat moderated due to significant outflows from the Grayscale Bitcoin ETF (GBTC). However, day 13 of the Bitcoin ETFs showed once again that the Grayscale outflows are slowly slowing down (yesterday: $220.7 million, previously $191.7 million), while the last two trading days saw net inflows for all ETF issuers of around $250 million.

Dan Ripoll, managing director at Swan, provided a detailed analysis on the sheer magnitude of this. “The Bitcoin spot ETFs have already snatched up 150,500 BTC in just 13 trading days. They are buying at a rate of 12,000 BTC per day. Now, let’s KISS (keep it simple stupid). There are only 900 BTC per day being issued. BTC is being bought up at a rate of 13x daily issuance. In 3 months, the issuance will be cut in half, driving the demand/supply imbalance to a staggering 26x daily issuance!”

Furthermore, Alessandro Ottaviani, a respected Bitcoin analyst, underscored the potential market shift, stating, “Now that the Bitcoin ETF inflow will always be higher than the Grayscale outflow, the only way to accommodate that demand will be through an increase of price. Once we reach $60k and even more after the new ATH, Institutional FOMO will be officially triggered, and it will be something that the human being has never experienced.”

WhalePanda, a renowned crypto analyst, highlighted recent activities, adding credibility to the brewing supply shock: “Yesterday another ~$250 million net inflow into Bitcoin ETFs with Blackrock doing a solid $300 million all by itself. Two days of $250 million inflow, the price didn’t rally much yesterday, but a couple of days like this, and you’ll see what kind of supply shock this will have on BTC.”

#2 Massive Bitcoin Miner Selling Absorbed

Despite a substantial flow of coins from miner wallets to spot exchanges, the market has shown remarkable resilience. According to a report from Cryptoquant:

“Yesterday, the flow of coins in miner wallets going to spot exchanges recorded the highest value since May 16, 2023. In total, more than 4,000 Bitcoins flowed to spot exchanges, around $173 million in selling pressure. However, this selling pressure was calmly absorbed by the market.”

It’s critical to note that despite these interactions, the reserves in mining portfolios have remained consistent since the beginning of January, indicating that the market has effectively absorbed the selling pressure without significant price depreciation.

#3 Stablecoins Aka “Dry Powder” On The Rise

The stablecoin aggregated market cap serves as a precursor to potential market movements. Recently, the stablecoin aggregated market cap has shown a significant rebound, moving from a bottom of $119.5 billion in mid-October 2023 to nearing $130 billion.

This rise in stablecoin reserves is often interpreted as “dry powder,” ready to be deployed into assets like Bitcoin, potentially further accelerating the supply/demand mechanics. Alex Svanevik, founder of on-chain analysis platform Nansen, remarked on the correlation between stablecoin reserves and BTC price: “When stables on exchanges peaked, BTC price peaked.”

At press time, BTC traded at $42,848.

Read More
Blockchain

Can February Be Dogecoin Month? Bullish Indicators Point To Potential Price Explosion

In an exciting turn of events, Dogecoin (DOGE), the popular meme-based cryptocurrency, is once again attracting attention in the market as February approaches. Meme coins, including DOGE, are gearing up for a potential comeback amidst a renewed sense of recovery in the crypto market.

The surge in network expansion, if sustained, has the potential to positively impact the price of DOGE, according to market experts. Over the past week, the number of new addresses in the Dogecoin network has skyrocketed by over 1,000%, showcasing the increasing interest and participation in the cryptocurrency.

This surge reached an all-time high on January 29, with an unprecedented 247,200 new DOGE addresses created in a single day.

According to the most recent data available, Dogecoin is presently being traded at $0.07, accompanied by a 24-hour trading volume amounting to around $1 billion and a market capitalization of $11.50 billion.

Dogecoin Upward Trajectory Signals Positive Trend

Although Dogecoin witnessed a marginal 1.7% decrease in value within the last 24 hours, it has gained 1.4% increase over the course of the past week. This upward trajectory suggests a positive trend that is likely to be well-received by both investors and enthusiasts in the cryptocurrency community.

The projected minimum and maximum prices are expected to hover around $0.0816 and $0.0838, respectively. These figures provide investors with a glimpse into the potential price range for DOGE in the coming months.

A recent post by crypto analyst Ali Martinez on X has shed light on a remarkable surge in growth within the Dogecoin network, indicating signs of a swift reversal in its price trend.

The #Dogecoin network is witnessing a remarkable surge in growth, with new addresses increasing by a staggering 1,100% over the past week!

On January 29 alone, a record-breaking 247,240 new #DOGE addresses were created, marking an all-time high. A sustained uptrend in network… pic.twitter.com/7tNAPzJaP2

— Ali (@ali_charts) January 30, 2024

And in a related development, prominent cryptocurrency exchange Changelly has released its most recent Dogecoin price forecast, predicting a marginal 0.05% increase that could propel the value to $0.08 by January 31, 2024.

Doge’s Momentum: Bullish Signals Amid Skepticism

However, it is important to note that the prevailing market sentiment, as indicated by Changelly’s analysis of technical indicators, leans towards bearish, with a Bearish Bearish score of 55%. The Fear & Greed Index stands at 55, indicating a slight inclination towards greed among market participants.

With the surge in new addresses and the positive outlook from analysts, the cryptocurrency community is eagerly monitoring Dogecoin’s movements.

Enthusiasts and investors alike are eagerly awaiting to see whether the meme coin will “pop” and break through in the coming weeks. The recent surge in network growth and the optimistic market sentiment surrounding Dogecoin indicate that it may continue to be a focal point of interest in the cryptocurrency market.

In the meantime, the question lingers: Can February be Doge’s month? With bullish indicators suggesting a potential price explosion, excitement is palpable. As Dogecoin gains momentum with its growing network and positive sentiment, the coming weeks will be pivotal.

Featured image from Shutterstock, chart from TradingView

Read More
Blockchain

Bitcoin ETFs Experience Day 12 Reversal, GBTC Selling Slows, Fidelity And Blackrock Garner $400 Million

Bitcoin has witnessed a positive turn of events as it reclaimed the $43,000 mark on Tuesday, thanks to a significant reduction in selling pressure from asset manager Grayscale. The reversal in Bitcoin ETFs during day 12 of trading has seen more inflows than outflows. Fidelity and Blackrock recorded a combined $400 million across their Bitcoin ETFs under the ticker names FBTC and IBIT, respectively. 

Bitcoin ETFs Record Third-Largest Money Day

According to market expert James Mullarney, Grayscale Bitcoin Trust (GBTC) has experienced a noticeable reduction in selling pressure, as reflected by the slowing down of GBTC selling. 

Day 12 of trading showed a substantial inflow compared to outflow, marking the third-largest money day ever in net money flow, bringing in $256 million. 

Mullarney further states that adding new Bitcoin ETFs has contributed to a net positive of $1 billion in ETFs, with an estimated 25,000 Bitcoin added to the market. The new Bitcoin ETFs now hold a total of 150,000 BTC in aggregate.

Miners Sell Most Coins Since May 2023

Despite these positive developments with Bitcoin ETFs, there is an ongoing increase in selling pressure from miners. A recent CryptoQuant report reveals that miners have sold the most coins since May 2023. 

The flow of coins from miner wallets to spot exchanges reached its highest value since May 16, 2023, with over 4,000 Bitcoin amounting to approximately $173 million in selling pressure.

Although miners have increased their selling activity, CryptoQuant asserts that the market has absorbed this pressure “calmly”. It is important to note that the reserves in mining portfolios have remained at the same level since the beginning of January. 

CryptoQuant highlights that it is crucial to consider that these actions do not necessarily indicate a “dump” by miners. The firm concluded:

It is true that there were several interactions with exchanges during this period, some quite significant, but this does not correspond to a “dump” on the part of these entities. Furthermore, it is necessary to be careful when reading messages like “miners are dumping coins”, this analyzes may not take into account the return of these coins to miners’ wallets. 

New All-Time High For Bitcoin After November?

Renowned crypto analyst, CryptoCon, cautions against the belief that “this time is different” for Bitcoin, highlighting the recurring nature of its market cycles. With three completed cycles and a fourth underway, CryptoCon emphasizes that historical patterns, including the launch of Bitcoin ETFs, have consistently influenced Bitcoin’s price trajectory.

CryptoCon emphasizes that Bitcoin’s price movements have followed distinct cycles, and he warns against the notion that each cycle will deviate significantly from the preceding ones. 

Despite the anticipation surrounding the launch of ETFs, historical evidence suggests that they have coincided with local price highs rather than instant new all-time highs. 

CryptoCon argues that the repeated occurrence of such patterns should serve as a reminder that “this time is different” often proves to be an illusory belief.

According to CryptoCon’s analysis, a period of sideways movement is expected to commence soon after the completion of the ongoing correction, which saw BTC retrace to the $38,500 level on Tuesday, January 23. 

This phase is predicted to last approximately four months, culminating in a second early price peak in June 2024, according to Crypto Con. 

Following this, the analyst foresees the possibility of new all-time highs occurring after November 28th, 2024. However, it is crucial to note that the cycle’s peak will occur within approximately 21 days from this date, around November 28th, 2025.

Featured image from Shutterstock, chart from TradingView.com

Read More
Blockchain

Bitcoin Bulls Keep Pushing, Why Increase Isn’t Over Yet

Bitcoin price is attempting a fresh increase above the $42,500 resistance. BTC is showing bullish signs and might rally further above the $43,800 resistance.

Bitcoin price is consolidating gains above the $42,500 resistance zone.
The price is trading above $42,750 and the 100 hourly Simple moving average.
There is a key bullish trend line forming with support near $42,650 on the hourly chart of the BTC/USD pair (data feed from Kraken).
The pair could continue to rise if it clears the $43,250 and $43,800 resistance levels.

Bitcoin Price Holds Ground

Bitcoin price started a decent increase above the $42,000 resistance zone. BTC was able to clear the $42,500 and $43,200 resistance levels. However, the bears were active near the $43,800 zone.

A new weekly high was formed near $43,779 before the price started a short-term downside correction. There was a drop below the $43,200 level. It broke the 23.6% Fib retracement level of the upward wave from the $41,650 swing low to the $43,779 high.

Bitcoin is now trading above $42,750 and the 100 hourly Simple moving average. There is also a key bullish trend line forming with support near $42,650 on the hourly chart of the BTC/USD pair. The trend line is near the 61.8% Fib retracement level of the upward wave from the $41,650 swing low to the $43,779 high.

Immediate resistance is near the $43,250 level. The next key resistance could be $43,800, above which the price could start a decent increase. The next stop for the bulls may perhaps be $44,500.

Source: BTCUSD on TradingView.com

A clear move above the $44,500 resistance could send the price toward the $45,000 resistance. The next resistance is now forming near the $45,200 level. A close above the $45,200 level could push the price further higher. The next major resistance sits at $46,500.

Another Bearish Wave In BTC?

If Bitcoin fails to rise above the $43,800 resistance zone, it could continue to move down. Immediate support on the downside is near the $42,800 level.

The next major support is $42,650 or the trend line. The main support could be $42,400 and the 100 hourly SMA. If there is a close below $42,400, the price could gain bearish momentum. In the stated case, the price could dive toward the $41,200 support.

Technical indicators:

Hourly MACD – The MACD is now losing pace in the bullish zone.

Hourly RSI (Relative Strength Index) – The RSI for BTC/USD is now below the 50 level.

Major Support Levels – $42,650, followed by $42,400.

Major Resistance Levels – $43,250, $43,800, and $44,500.

Read More
Blockchain

DOGE Bull Mark Cuban Talks Crypto, NFTs, And More In Community AMA

On January 29, Mark Cuban, the businessman and television personality, took to the X platform (formerly known as Twitter) to have a conversation with his audience and the crypto community online.

What Projects Does Mark Cuban Invest in?

The Ask Me Anything (AMA) session asked about Cuban’s thoughts on various crypto-related topics. Notably, his replies to the community suggested the importance of a project’s utility for the Shark Tank investor.

When asked about his thoughts on crypto, Cuban stated “I hate the speculation but love when there is utility,” similarly replying to a different question about on-chain finance “needs new ideas with more utility.” Additionally, he explained that Bitcoin’s Layer 2 solution aimed at scaling “doesn’t matter at all,” and emphasized his belief that “It’s applications with unique utility that matter.”

Cuban believes blockchain technology is here to stay but identifies two issues. The first concerns the existence of “too many blockchains,” and the second is the lack of an application that makes the technology “indispensable” for all generations.

For these reasons, the businessman thinks blockchain technology’s future is in the air but reaffirms that “it will always have a place.” However, he doesn’t consider blockchain security one of the biggest problems.

During the AMA session, the Shark Tank investor listed Polygon (MATIC), and Injective (INJ) as two projects he’s interested in outside the flagship cryptocurrency and the largest altcoin. When asked about his concerns on the project and growth of injective, Cuban said he didn’t have any, but he hopes “they do well” as he is an investor.

The Doge community took part in the questions, and Cuban admitted that he enjoys being part of the community. He also confirmed that The Dallas Mavericks continue to accept DOGE as a payment method.

I don’t think about it

— Mark Cuban (@mcuban) January 29, 2024

What Emerging Technology Will Thrive in The Next Decade?

Regarding non-fungible tokens (NFTs), the investor explained “They are a collectible in most cases but can be used for other things,” and suggested that people should buy them to collect and not to speculate. Similarly, he expresses the challenges of selling these assets as he hasn’t found “a compelling aspect yet.”

Similarly, Cuban indicated that he is “not a fan” of tokenizing assets, such as sports teams and real estate, as he doesn’t think it “adds enough value.”

Entrepreneurs

— Mark Cuban (@mcuban) January 29, 2024

Cuban shared his views on the future of emerging technologies, affirming that he only sees Artificial Intelligence (AI) significantly impacting entrepreneurship in the next decade. Saying, “There will be two types of companies in the USA. Those who are great at AI and everyone else.”

Lastly, he was constantly asked about his thoughts on X owner and Tesla founder Elon Musk. He addressed their relationship by simply replying: “I don’t not get along with him. I don’t know him. He likes to talk shit on here and so do I.”

Read More
Blockchain

Ethereum ETFs Approval Date Set For May 23, Forecasts Suggest ETH Could Reach $4,000

The Securities and Exchange Commission (SEC) is poised to follow a similar approach to approving spot Bitcoin (BTC) exchange-traded funds (ETFs) for spot Ethereum ETFs, with the expectation that approval will be granted on the initial final deadline of May 23, as per Standard Chartered Bank analysis.

Ethereum ETFs Face Delays, Approval Remains Likely

According to a report by The Block, Geoffrey Kendrick, head of forex and digital asset research at Standard Chartered Bank, stated that they expect pending applications for spot Ethereum ETFs to be approved on May 23, which is considered the equivalent date to January 10 for Bitcoin ETFs. 

Furthermore, Kendrick predicts that if Ethereum prices follow a similar trajectory to Bitcoin leading up to ETF approval, Ethereum could trade as high as $4,000 by the specified date.

Kendrick further supports the approval of spot Ethereum ETFs based on the SEC’s classification of ether as a non-security in its legal actions against crypto companies. 

Additionally, the fact that Ethereum is listed as a regulated futures contract on the Chicago Mercantile Exchange (CME) adds weight to the expectation of approval.

Following the same line, Scott Johnsson, a financial lawyer, offered insights into the potential roadmap for Ethereum ETFs. Johnsson emphasized that while long-term approval for spot Ethereum ETFs is highly likely, there may be short-term delays due to ongoing regulatory actions involving Coinbase/Binance securities exchanges. 

Shorter Path For ETH ETF Approvals?

Johnsson highlighted the regulatory path from a plain spot digital asset to a spot ETF offering, using Bitcoin as an example. Johnsson noted that the process for Bitcoin took seven years, involving multiple steps and disapprovals along the way. 

However, Johnsson noted that the timeline for Ethereum is compressing, with applications open for both futures ETFs and spot ETFs. He suggested certain prerequisites that Johnsson believes may no longer be necessary for spot approval, such as Step 3, which requires the SEC to issue a formal 19b-4 approval for the futures ETF.

Johnsson highlighted two key factors to understand the SEC’s current approach to future approvals, including Ethereum. Firstly, he discussed the threshold question in the context of the Grayscale ruling, which focused on correlation analysis. 

Secondly, Johnsson emphasized the SEC’s view, as bounded by the recent BTC approval order, which considers correlation with the CME, a lengthy sample period, intra-day trading data, and consistency throughout the sample period.

While the specific threshold for sufficiency remains unknown, the correlation analysis for Bitcoin is within an acceptable range. Therefore, it is expected that Ethereum will likely meet this threshold in the foreseeable future, Johnsson suggests. 

Once the required level of correlation is achieved, Johnsson believes that approval for spot Ethereum ETFs is likely to follow shortly after that, with May being the expected month of approval. 

Overall, industry analysts and experts suggest that the SEC’s approval of spot Ethereum ETFs is a matter of time, barring any major legal shifts. 

ETH is currently trading at $2,370, up more than 2% in the past 24 hours and more than 7% in the past seven days, following Bitcoin’s lead.

Featured image from Shutterstock, chart from TradingView.com 

Read More