Crypto Corner Café

Taste The Future

Blockchain

XRP Market Drama: Ups, Downs And The $3 Horizon – Experts Weigh In On The Future

XRP has taken investors on an exciting roller coaster ride this year, taking them on a trip through the highs and lows of the market.

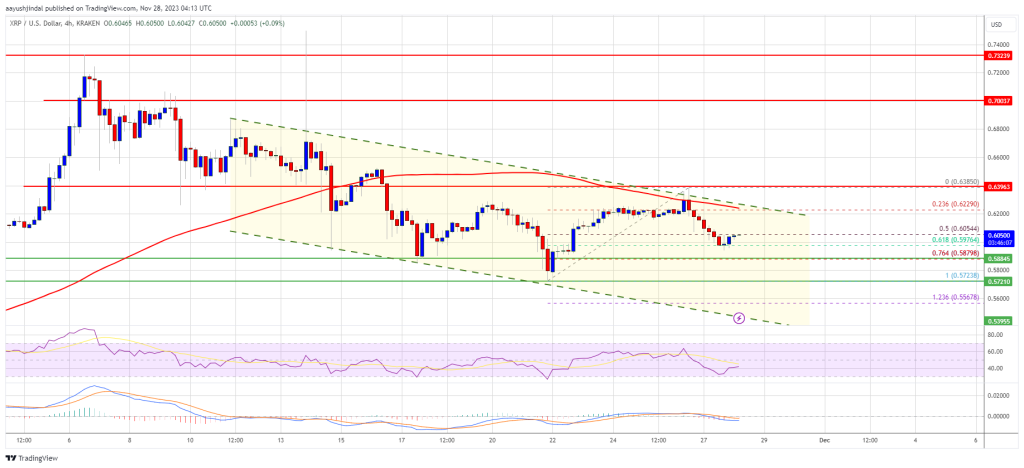
There have been a lot of ups and downs, from a small rise in March to a huge surge in July and another one in the middle of October. Even though this exciting adventure has ended, XRP is now trading at a mere $0.59, a huge drop of 30% from its all-time high of $0.95.

Despite this, the current trajectory of XRP showcases a prolonged consolidative pattern spanning multiple months, hinting at a potential windfall for patient investors. For instance, a bullish head-and-shoulders setup is on the brink of completion, adding a positive dimension to the outlook.

XRP: Buy The Dip?

In the event that the XRP price maintains its upward momentum and successfully breaches resistance, the stage is set for a rapid and substantial rally to the upside, presenting a tantalizing opportunity for those positioned to capitalize on the potential gains.

After looking at the current situation, it looks like XRP is definitely in the “buy the dip” sector. If you think that XRP will continue to rise in value, buying some of the digital asset right now might seem like a great chance to make a lot of money. People who believe that XRP will go up in value over the long term see investing in it now as a good deal.

Even in the face of the recent correction within the cryptocurrency market and the marginal dip in XRP’s price, certain analysts maintain an optimistic stance, suggesting that Ripple’s coin is poised for a surge to unprecedented heights.

#XRP The Train Next Stops: $1.3-$3-$5.8-$27:

Macro View:
Reviving echoes from the 2017 surge, aiming for $27 feels like a plausible target. The markers at $3 and $5.8 stand as critical milestones, yet pushing to $6-$7 might come with some turbulence. These ambitious goals… https://t.co/Aojv3sYmtG pic.twitter.com/c0RSHhlFnA

— EGRAG CRYPTO (@egragcrypto) November 27, 2023

Notably, Twitter user EGRAG CRYPTO stands as an example, outlining the potential upcoming targets for the token, signaling a prevailing belief in the latent upward potential despite recent market fluctuations.

EGRAG said that XRP could go up to $6 or $7 if it went above the “crucial milestones” of $3 and $5.80. Based on how it did during the 2017 bull run, the expert went on to say that he thought the token would explode to $27.

In the current wave of market optimism, XRP is actively participating, driven by growing anticipation surrounding ETFs and witnessing the most substantial surge in inflows since late 2021.


Based on the latest report from CoinShares, digital asset investment products saw an impressive $346 million influx in the previous week alone. Significantly, this marks the highest weekly inflow during a nine-week streak, sparked by heightened expectations of a spot-based ETF launch in the United States.

Notably, this surge is notably the most robust since the bull market observed in late 2021.

This bull run will be a special one for $XRP

Last cycle we saw HEAVY suppression & inactivity due to the whole lawsuit issue

But things have changed since then

In fact, change might be an understatement

As Ripple has flipped this around into the most BULLISH outcome possible… pic.twitter.com/PzDsPVAyyO

— Kyren (@noBScrypto) November 24, 2023

Positive Forecast For XRP

Meanwhile, another Twitter user who thinks Ripple’s coin is going to have a huge surge soon is Kyren. They claim there are a number of reasons why XRP could experience a “unique” bull run in the future.

The re-listing of XRP on key cryptocurrency exchanges, Ripple’s engagement with several central banks worldwide, and the company’s winning streak in its legal battle against the US Securities and Exchange Commission (SEC) are a few of these.

The broader crypto market is currently looking good because investors are looking forward to the Federal Open Market Committee (FOMC) minutes that are coming out soon. The market is also going up because of rumors about the approval of a Bitcoin Spot ETF and other positive events.

(This site’s content should not be construed as investment advice. Investing involves risk. When you invest, your capital is subject to risk).

Featured image from Krzysztof Kubicki/Pexels

Read More
Blockchain

Ethereum Bears Keep Pressing, Why ETH Price Might Revisit This Key Support

Ethereum price is moving lower from $2,130. ETH is showing a few bearish signs and might decline toward the $1,920 support zone.

Ethereum is slowly moving lower below the $2,060 zone.
The price is trading below $2,060 and the 100-hourly Simple Moving Average.
There is a major bearish trend line forming with resistance near $2,040 on the hourly chart of ETH/USD (data feed via Kraken).
The pair could continue to move down toward the $1,920 support zone.

Ethereum Price Extends Decline

Ethereum price started a fresh decline after it struggled near $2,130. ETH formed a high at $2,132 and started a downward movement. There was a move below the $2,100 and $2,080 levels, like Bitcoin.

The price even spiked below the $2,000 support. A low was formed near $1,986 and the price is now consolidating losses. There was a minor recovery wave above the $2,020 level. Ether climbed above the 23.6% Fib retracement level of the recent drop from the $2,132 swing high to the $1,986 low.

Ethereum is now trading below $2,060 and the 100-hourly Simple Moving Average. On the upside, the price is facing resistance near the $2,040 zone. There is also a major bearish trend line forming with resistance near $2,040 on the hourly chart of ETH/USD.

The first key resistance is near the $2,060 level or the 50% Fib retracement level of the recent drop from the $2,132 swing high to the $1,986 low. The next resistance sits at $2,100. A clear move above the $2,100 level could send the price toward the $2,135 resistance zone.

Source: ETHUSD on TradingView.com

The next resistance is near $2,150, above which the price could aim for a move toward the $2,200 level. Any more gains could start a wave toward the $2,250 level.

More Losses in ETH?

If Ethereum fails to clear the $2,040 resistance, it could start a fresh decline. Initial support on the downside is near the $2,000 level.

The next key support is $1,985. A downside break below $1,985 might send Ether toward the $1,920 support. The key support is now at $1,885, below which there is a risk of a move toward the $1,820 level.

Technical Indicators

Hourly MACDThe MACD for ETH/USD is losing momentum in the bullish zone.

Hourly RSIThe RSI for ETH/USD is now below the 50 level.

Major Support Level – $1,985

Major Resistance Level – $2,040

Read More
Blockchain

XRP Price Prediction – Downside Thrust Possible Before Fresh Surge To $0.72

XRP price is moving lower from the $0.732 resistance. The price is now at risk of more losses toward the $0.550 support before the bulls take a stand.

XRP started a downside correction below $0.638 and $0.612.
The price is now trading below $0.625 and the 100 simple moving average (4 hours).
There is a key declining channel forming with resistance near $0.622 on the 4-hour chart of the XRP/USD pair (data source from Kraken).
The pair dive toward the $0.550 support before the bulls take a stand.

XRP Price Turns Red

In the past few days, XRP saw a steady decline from the $0.740 zone. There was a move below the $0.685 and $0.638 support levels. The price even dived below the $0.612 support, underperforming Bitcoin and Ethereum.

There was a recovery wave from $0.572, but the bears were active near $0.638. A high was formed near $0.6385 and the price is now moving lower. There was a break below the 50% Fib retracement level of the upward move from the $0.5723 swing low to the $0.6385 high.

XRP is now trading below $0.625 and the 100 simple moving average (4 hours). There is also a key declining channel forming with resistance near $0.622 on the 4-hour chart.

On the upside, immediate resistance is near the $0.615 level. The first major resistance is near the $0.622 zone or the 100 simple moving average (4 hours) or the channel upper zone. A close above the $0.622 resistance zone could spark a steady increase.

Source: XRPUSD on TradingView.com

The next key resistance is near $0.638. If the bulls remain in action above the $0.638 resistance level, there could be a rally toward the $0.700 resistance. Any more gains might send XRP toward the $0.720 resistance.

More Downsides?

If XRP fails to clear the $0.622 resistance zone, it could start a fresh decline. Initial support on the downside is near the $0.588 zone.

The next major support is at $0.572. If there is a downside break and a close below the $0.572 level, XRP price might accelerate lower. In the stated case, the price could retest the $0.540 support zone.

Technical Indicators

4-Hours MACD – The MACD for XRP/USD is now gaining pace in the bearish zone.

4-Hours RSI (Relative Strength Index) – The RSI for XRP/USD is now below the 50 level.

Major Support Levels – $0.588, $0.572, and $0.540.

Major Resistance Levels – $0.622, $0.638, and $0.700.

Read More
Blockchain

$3.1 Billion TUSD Stablecoin Shaky, Briefly Depegs—What’s Happening?

TrueUSD (TUSD), a stablecoin with a market cap exceeding $3.1 billion, appears “shaky” and briefly depegged on November 22, dropping to as low as $0.9976 before restoring its peg. The temporary depeg was attributed to a deluge of selling orders, according to Kaiko, a blockchain analytics firm.

TUSD Briefly Depegs, Large Selling Orders Rolling Through

Riyad Carey, a researcher at Kaiko, noted that large sell orders, including one for $3 million, triggered the turbulence that caused the stablecoin’s price to dip below the dollar peg. This brief deviation resulted in users who redeemed TUSD receiving less USD. Ideally, any redemption of a fiat-backed stablecoin should result in a 1:1 reception of the collateral.

The incident highlights the potential impact of large order blocks on liquidity and the potential for slippage. TUSD, theoretically backed by USD and issued by TrustToken, is popular in Binance, an exchange that delisted USDC and 2023.

Because of this limitation, TUSD is one of the most liquid stablecoins paired with leading coins like Bitcoin (BTC). However, despite its popularity, it trails Tether (USDT), the world’s largest stablecoin by market cap. 

The TEURO Mystery

This depegging occurred a few weeks after tough security questions were raised about TUSD. In mid-October, the minter was forced to disclaim TEURO, a token deployed from the same address, suggesting that private keys associated with TUSD may have been compromised.

Curiously, funds tied to TEURO, the fake token, were also linked to the deployment of TCNY, another fake token unaffiliated with TrueUSD. Following these incidents, the community began raising questions about the security of the stablecoin and, more importantly, its underlying infrastructure.

This was expected, considering that a centralized entity issues TUSD though all transactions are on-chain. 

Despite these challenges, TrueUSD maintains that its smart contracts are secure. The company emphasizes that it has gained ownership of the TUSD minting contract since the end of 2020.

In early May 2023, TUSD depegged, rising to as high as $1.20 on multiple exchanges, particularly on Binance. This was attributed to an increase in activity on the SUI farming pool. 

Still, this is not the first time popular stablecoins have depegged. In March 2023, USDC and DAI, two of the world’s largest stablecoins, depegged, leading to widespread fear in the market. However, the team restored parity. Moreover, to improve confidence, stablecoin issuers regularly publish attestation reports.

Read More
Blockchain

Bitcoin Price Grinds Lower As Risk of Drop To $35K Escalates

Bitcoin price is moving lower below the $37,000 level. BTC could continue to move down toward the $36,000 level or even $35,000 zone in the coming sessions.

Bitcoin is showing bearish signs and moving lower from the $37,750 resistance.
The price is trading below $37,400 and the 100 hourly Simple moving average.
There is a key bearish trend line forming with resistance near $37,380 on the hourly chart of the BTC/USD pair (data feed from Kraken).
The pair could continue to move down if it breaks the $36,750 support.

Bitcoin Price Extends Decline

Bitcoin price started a downside correction after it spiked toward the $38,500 zone. BTC followed a bearish path and settled below the $37,200 level (as discussed in yesterday’s post).

There was a drop below the $37,000 level. A low was formed near $36,720 and the price is now consolidating losses. It climbed a bit above the 23.6% Fib retracement level of the recent drop from the $38,432 swing high to the $36,720 low.

Bitcoin is now trading below $37,400 and the 100 hourly Simple moving average. On the upside, immediate resistance is near the $37,400 level. There is also a key bearish trend line forming with resistance near $37,380 on the hourly chart of the BTC/USD pair.

The first major resistance is forming near $37,570 or the 100 hourly Simple moving average. It is close to the 50% Fib retracement level of the recent drop from the $38,432 swing high to the $36,720 low. The main resistance is now near the $38,000 level. A close above the $38,000 resistance might start a strong increase.

Source: BTCUSD on TradingView.com

The next key resistance could be near $38,500, above which BTC could rise toward the $39,200 level. In the stated case, it could even move toward the $40,000 resistance.

More Losses In BTC?

If Bitcoin fails to rise above the $37,570 resistance zone, it could continue to move down. Immediate support on the downside is near the $36,720 level.

The next major support is $36,500. If there is a move below $36,500, there is a risk of more downsides. In the stated case, the price could drop toward the $35,650 support in the near term. The next key support or target could be $35,000.

Technical indicators:

Hourly MACD – The MACD is now gaining pace in the bearish zone.

Hourly RSI (Relative Strength Index) – The RSI for BTC/USD is now below the 50 level.

Major Support Levels – $36,720, followed by $36,000.

Major Resistance Levels – $37,400, $37,570, and $38,000.

Read More
Blockchain

Bitcoin Sees Influx Of Over $1.5 Billion In 2023: Price Surge Aims For $43,000

Amidst the regulatory scrutiny and enforcement actions faced by the cryptocurrency industry, Bitcoin (BTC), the leading cryptocurrency by trading volume, has remained resilient and maintained its consolidation level between $36,000 and $37,000. It reached a new record for the year, surging to a new yearly high of $38,390 on Friday.

$312 Million Inflows Amid Spot-Based ETF Expectations

The latest report from CoinShares provides further evidence of Bitcoin’s robustness. Despite concerns that the regulatory feud involving Binance might trigger a sell-off of BTC, the report reveals a significant influx of capital into digital asset investment products. 

Last week, these products witnessed a notable inflow of $346 million, marking the largest weekly inflows observed during a nine-week consecutive run.

The CoinShares report highlights that the surge in inflows can be attributed to the anticipation surrounding the potential launch of a spot Bitcoin exchange-traded fund (ETF) in the United States, which has been eagerly awaited by investors but delayed by the US Securities and Exchange Commission (SEC).

Interestingly, this surge is the largest since the bull market of late 2021. CoinShares reports that the combination of rising prices and inflows has pushed total Assets Under Management (AuM) to $45.3 billion, the highest level seen in over a year and a half.

Bitcoin’s inflows last week amounted to $312 million, bringing year-to-date inflows to just over $1.5 billion. Meanwhile, short-sellers are capitulating, with outflows totaling $0.9 million for the third consecutive week. 

Since the peak in April 2023, AuM has declined by 61%. The use of exchange-traded Products (ETPs) to gain exposure to the asset class remains significant, with ETP volumes representing 18% of total spot Bitcoin volumes last week.

Ethereum (ETH) also experienced a positive shift in sentiment, with inflows of $34 million last week and a four-week run of $103 million. This marks a turnaround from the outflows observed earlier this year. 

Furthermore, other cryptocurrencies such as Solana (SOL), Polkadot (DOT), and Chainlink (LINK) saw inflows totaling $3.5 million, $0.8 million, and $0.6 million, respectively.

Ichimoku Cloud Predicts Bitcoin Surge To $43,000

In a bold prediction backed by technical analysis, renowned crypto analyst “Crypto Con” suggests that Bitcoin (BTC) is poised for a significant surge in the coming weeks. 

Crypto Con claims to have accurately predicted BTC’s previous rise to $38,000 two months before it occurred, using the weekly Ichimoku cloud. Now all eyes are on the completion of the current upward move, with the initial target set at $43,000.

For further context, the Ichimoku cloud is a popular technical indicator used to gauge potential future price trends and identify key support and resistance levels. According to Crypto Con, the weekly Ichimoku cloud has projected a bullish cross shortly, indicating that Bitcoin’s upward trajectory is far from over.

Based on historical data, Crypto Con notes that the completion of previous Bitcoin rallies following a similar cross has taken anywhere from 7 to 11 weeks, with an average duration of 10 weeks. Consequently, the analyst expects the current move to culminate in early January.

When the rise reaches its peak, Crypto Con suggests that the top of the red cloud, a key feature of the Ichimoku cloud, becomes the primary target. While the analyst identifies $43,200 as the most conservative level for this target, Crypto Con asserts that the red cloud’s true top could reach as high as $48,000.

Featured image from Shutterstock, chart from TradingView.com 

Read More
Blockchain

On The Brink Of Breakthrough? Analyst Foresees Cardano (ADA) Hitting New Annual Heights

Market analyst Ali Charts has recently shared insights on the Cardano (ADA) market trajectory. Observing recent trends, ADA appears to be in a bearish phase.

In the last 24 hours, mainly, the asset has witnessed a 2.8% decline, resulting in its trading price falling to $0.37. However, despite the current dip, Ali offers an optimistic outlook, suggesting that Cardano may be gearing up for a significant price surge, possibly reaching its highest point for the year.

Analyst’s Positive Outlook On ADA: Understanding The Demand Zone

In an X post uploaded earlier today, Ali shared his analysis on ADA, highlighting a crucial demand zone around the $0.37 and $0.38 marks. The analyst notes the substantial buying activity in this range, with over 166,470 wallets having purchased ADA at these levels.

Ali states this robust demand indicates a strong support level at these price marks. With minimal resistance ahead, Ali’s analyst suggests that ADA could see an increase, potentially surpassing its yearly high of $0.4518.

Notably, while the analyst points out that the current buying trend at the demand zone is a positive indicator of ADA’s strength, the analyst also cautions investors to remain vigilant. A failure to maintain support in this zone could result in ADA’s price dropping to lower levels, such as $0.34.

#Cardano sits at a key demand zone between $0.37 and $0.38. Here, 166,470 wallets acquired 4.88 billion $ADA.

With minimal resistance ahead and solid support below, remaining above this zone could pave the way for $ADA to climb to new yearly highs. Still, watch out, as losing… pic.twitter.com/GDjhspFSVr

— Ali (@ali_charts) November 27, 2023

Cardano (ADA) Latest Price Action

Recently, ADA has experienced a downturn, with its value decreasing nearly 5% over the past week. This downward trend has continued in the last 24 hours, with a 2.5% decline, bringing its trading price to roughly $0.378. This price point is significant as it aligns with the strong support level identified by analyst Ali.

As highlighted above, according to Ali, a drop below this support level could potentially lead to a further decrease to around $0.34. Conversely, if ADA stabilizes or rebounds from this level, it may set the stage for a climb to new yearly highs.

While ADA has faced a bearish phase recently, a broader perspective reveals a more positive outlook. Over the past month, ADA has demonstrated a 29% increase, and even considering the past two weeks, it maintains a 3.2% gain.

Meanwhile, the asset’s daily trading volume has since been on a downward trend over the past weeks. In the past 24 hours, ADA’s daily trading volume has stood at $255 million, a significant plunge from over $600 million in the middle of this month.

Featured image from Unsplash, Chart from TradingView

Read More
Blockchain

Whale Rapidly Stacking Uniswap, UNI To $10?

An active crypto whale has been steadily accumulating UNI, the native token to Uniswap, one of the world’s most active decentralized exchanges (DEXes). This development suggests that the address believes the token may edge higher in the coming trading days or weeks, extending gains after a sharp leg up on November 22 when UNI soared, breaking above key resistance levels. 

Whale Loading Up More UNI, Back To $10?

According to recent Lookonchain data, an Ethereum address, stevu.eth, withdrew 311,302 UNI worth $1.93 million from Binance, the world’s largest crypto exchange, on November 25, pushing its total UNI holdings to 511,301 UNI, or $3.18 million.

Notably, this acquisition follows a withdrawal of 500,545 UNI ($2.42 million) from OKX on June 29, which stevu.eth deposited to Binance and OKX in August. However, the recent accumulative behavior on November 25 indicates that the whale is bullish on UNI, possibly expecting prices to float back to $10, a level last seen in August 2022.

Presently, UNI is trading within a bullish breakout formation, looking at the performance in the daily chart. Changing hands at around $6.2 when writing on November 27, the token is up approximately 60% from October lows. Even with the confidence, UNI prices have been mostly consolidating, moving horizontally at spot rates.

If buyers press on, a close above $6.6 with expanding volumes might confirm buyers of November 22. In that case, the resulting momentum might form the base for another leg up, pushing the token to August 22 highs of around $10.

Uniswap v4 Expectations

The whale’s confidence in UNI aligns with the ongoing development of Uniswap v4, an upgrade that will significantly enhance the DEX. In this update scheduled for a tentative period in 2024, Uniswap Labs, the team behind Uniswap, is introducing a concept called “hooks.” 

Hooks are contracts that can be executed at various stages of a pool’s lifecycle. According to the team, Hooks, which act as more plugins, provide increased flexibility and customization for Uniswap’s liquidity pools.

As such, it would be possible for users to enable features like dynamic fees, refined market making, and even advanced orders executed on-chain.

What’s notable about Uniswap v4 is the introduction of “singleton” contract architecture. All Uniswap liquidity pools will reside inside a single, smart contract in this design change. The team notes that this can significantly reduce gas costs and, more importantly, reduce routing efficiency across numerous pools.

Read More
Blockchain

Santiment Reveals Trigger Behind Bitcoin Rally: Will This Signal Reignite?

The on-chain analytics firm Santiment has explained how Tether (USD) and USD Coin (USDC) exchange inflows preceded the recent Bitcoin rally.

Bitcoin Rally May Restart If Stablecoins See Further Exchange Deposits

In a new post on X, Santiment discussed the trend in the supply of exchanges of various assets in the cryptocurrency sector. The “supply on exchanges” is an indicator that keeps track of the percentage of the total circulating supply of the given coin currently sitting in the wallets of all centralized exchanges.

The below chart shows the trend in this indicator for Bitcoin (BTC), Ethereum (ETH), Chainlink (LINK), Polygon (MATIC), Tether (USDT), and USD Coin (USDC) over the past few months.

Depending on what type of asset it is, the significance of the supply on exchanges can differ. In the case of volatile assets like Bitcoin, the supply being stored on these platforms may be considered the available selling supply of the asset, as one of the main reasons investors may deposit their coins to the exchanges is for selling.

Thus, when this indicator trends up for these cryptocurrencies, it’s a potential sign that selling pressure in the sector is going up. The graph shows that Polygon has seen 0.7% of its supply move to exchanges in the past month, which could be a bearish sign for its price.

On the other hand, Bitcoin has observed withdrawals equivalent to 0.33% of its supply during the same period. Such a decline in the indicator can suggest that investors may participate in accumulation, as they are taking their coins off towards self-custodial wallets.

As for the stablecoins, an increase in the supply on exchanges also suggests that investors wish to swap these tokens. This selling of stables, though, actually provides a buying boost to the volatile side of the market, as the investors may use these assets to shift into Bitcoin and others.

As the chart shows, both Tether and USD Coin saw the exchange supply rise between August and October. More specifically, USDT and USDC observed 3.54% and 0.72% of their supplies moving into these platforms, respectively. “These transfers were the predecessor to the crypto-wide rally from late October to mid-November,” explains Santiment.

In the past month, however, 3.1% of the Tether supply has left these platforms, while the USD Coin has observed the metric move sideways. This would suggest that buying pressure has stopped rising, and the opposite may occur.

“After a cooldown, USDT & USDC returning to exchanges will be crucial to seeing market caps continuing to increase for a big final 5 weeks of 2023,” notes the analytics firm.

BTC Price

Bitcoin has registered some drawdown today as the asset’s price has now slipped under the $36,800 mark.

Read More
Blockchain

Ethereum Return To $4,800: Analyst Identifies Pattern To Trigger Rally To ATH

The Ethereum price has been trading more than 50% below its all-time high of $4,800 for the better part of a year now with no sign of returning to its previous all-time high. However, this slow trend may not continue for much longer as a crypto analyst has identified a pattern that could trigger a rally to its previous highs.

Ethereum Stuck Inside A Bullish Triangle

In an analysis that was posted on TradingView, crypto analyst FieryTrading identified a unique pattern that the Ethereum price has been trading in for almost two years. This pattern is a bullish triangle pattern and it has persisted for more than one and a half years.

Looking at the chart, the Ethereum price has not deviated from this bullish triangle and has not had any success breaking out of it. The triangle began toward mid-2022 when the Terra Network collapse triggered a crypto market-wide crash. Then even with multiple major recoveries since then, the altcoin’s price remains inside this triangle.

The lower end of this bullish triangle is at $887 which is the cycle low, and the upper end has been tracked at just above $2,100. Given this range, it suggests that for Ethereum to break out of this bullish triangle, it would have to clear the $2,200 resistance.

What Happens If ETH Breaks Out Of This Pattern?

As the crypto analyst highlights, a breakout of this pattern would lead to a massive rally. The top of this breakout rally could eventually see the Ethereum price return to its 2021 all-time high levels, reaching above $4,800.

“In my eyes, a break out from this pattern might result in big gains for ETH, since it will burst through an area full of short-trade stop-losses which will be forced to buy back their positions,” FieryTrading said. A move to $4,800 would translate to a 130% increase from its current price levels.

However, the crypto analyst explains that this could be more of a long-term performance, so it is possible that the cryptocurrency will not complete this move until at least the year 2024. But it paints a good, bullish picture for the altcoin going forward.

On its own this year, the Ethereum price has performed quite well, especially over the last 30 days. Data from CoinMarketCap shows that ETH’s price has risen 16.53% in one month to break above the $2,000 resistance which has now turned into support.

Ethereum remains the second-largest cryptocurrency with a market cap of approximately $250 billion.

Read More