Crypto Corner Café

Taste The Future

Blockchain

SOL Price Restarts Rally – Why Solana Could Surge Over 10%

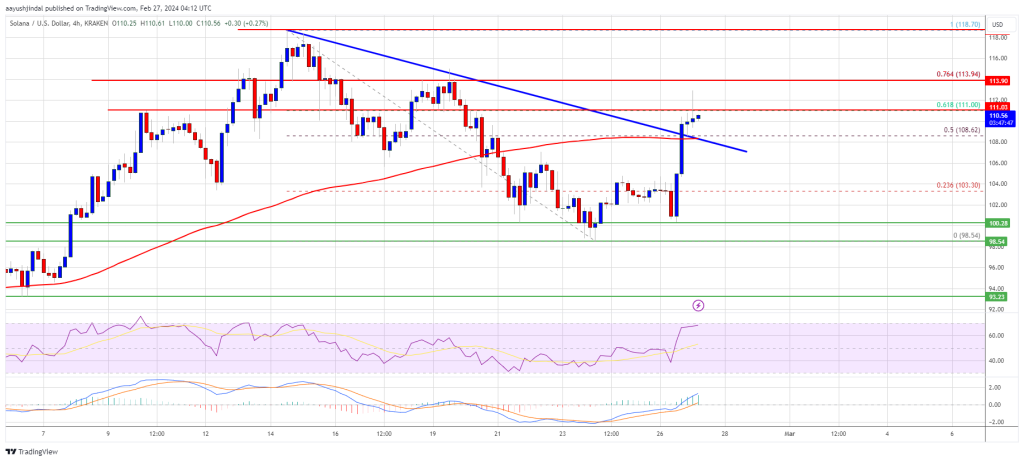
Solana is gaining bullish momentum above $108. SOL price is showing positive signs, and it could even surpass the $118 resistance in the near term.

SOL price started a fresh increase from the $98.50 support against the US Dollar.
The price is now trading above $108 and the 100 simple moving average (4 hours).
There was a break above a major bearish trend line with resistance at $108.80 on the 4-hour chart of the SOL/USD pair (data source from Kraken).
The pair could continue to rally if it clears the $115 and $118 resistance levels.

Solana Price Starts Fresh Increase

Solana price formed a base above the $98.50 support zone and recently started a fresh increase. There was a decent increase above the $102 and $105 levels.

The price is up nearly 10% and there was a move above the $108 level, like Bitcoin and Ethereum. There was a break above a major bearish trend line with resistance at $108.80 on the 4-hour chart of the SOL/USD pair. The bulls pushed the price above the 50% Fib retracement level of the downward move from the $118.70 swing high to the $98.54 low.

Solana is now trading above $110 and the 100 simple moving average (4 hours). Immediate resistance is near the $111 level. The next major resistance is near the $114 level or the 76.4% Fib retracement level of the downward move from the $118.70 swing high to the $98.54 low.

Source: SOLUSD on TradingView.com

A successful close above the $114 resistance could set the pace for another major increase. The next key resistance is near $118. Any more gains might send the price toward the $125 level.

Are Dips Limited in SOL?

If SOL fails to rally above the $114 resistance, it could start a downside correction. Initial support on the downside is near the $108.50 level or the 100 simple moving average (4 hours).

The first major support is near the $105.00 level, below which the price could test $98.50. If there is a close below the $98.50 support, the price could decline toward the $92 support in the near term.

Technical Indicators

4-Hours MACD – The MACD for SOL/USD is gaining pace in the bullish zone.

4-Hours RSI (Relative Strength Index) – The RSI for SOL/USD is above the 50 level.

Major Support Levels – $108.50, and $105.00.

Major Resistance Levels – $114, $118, and $125.

Read More
Blockchain

Ethereum Leaves Bitcoin Behind, But Is This Rally Sustainable?

Ethereum has left Bitcoin in the dust with its latest rally towards $3,100. Here’s whether this run is sustainable based on futures market data.

Ethereum Has Separated From Bitcoin With Over 7% Jump In Past Week

While Bitcoin has been in consolidation lately, Ethereum appears to have been putting together bullish momentum entirely of its own, as the asset has jumped more than 7% in the past week.

The chart below shows how ETH has performed during the last month.

In the last 24 hours, Ethereum reached a peak of $3,130 level, a mark it only reached for the first time since the first half of April 2022. Since then, the coin has come down a bit, as it now floats around $3,100.

Nonetheless, despite this small retrace, ETH has still performed notably better than the original cryptocurrency. Now, the asset’s investors might be wondering if the coin could continue this run. Perhaps data related to the futures market might shed some light.

ETH Funding Rates Have Been At Positive Levels Recently

As pointed out by an analyst in a CryptoQuant Quicktake post, the ETH funding rate has had positive values recently. The “funding rate” is an indicator that keeps track of the periodic fees that traders on the futures market are exchanging between each other right now.

When the value of this metric is positive, it means that the long holders are currently paying a premium to the short investors to hold onto their holdings. Such a trend implies the majority sentiment in the futures market is bullish.

On the other hand, the indicator being negative implies a bearish sentiment is dominant in the sector right now as the short holders outweigh the long traders.

Now, here is a chart that shows the trend in the 30-day simple moving average (SMA) of the Ethereum funding rate over the past couple of years:

As the above graph shows, the 30-day SMA Ethereum funding rate had shot up to extremely high levels in the first half of January. Interestingly, this is when the market top due to the Bitcoin spot ETFs occurred.

After the price drawdown following the event, the funding rate calmed as the longs that had piled up saw liquidation. As the recent rally in the coin has occurred, the funding rate has once again gone up.

However, This time, the 30-day SMA Ethereum funding rate isn’t quite at the extreme levels it was last month. This could mean that the futures market isn’t yet too overheated.

Naturally, this could potentially allow for the current Ethereum rally to go on for a while still. It should be noted, though, that as the funding rates go higher, the chances of a long squeeze taking place go up.

Thus, while ETH may not be quite at the same risk as last month, a long squeeze could still be on the horizon, becoming more probable to happen as the speculators continue to open up more positions.

Read More
Blockchain

Bitcoin Price Moons To $57K As The Bulls Aim For $60K

Bitcoin price is up over 10% and surging toward $58,000. BTC is signaling a strong upward trend and might surge toward the $60,000 resistance.

Bitcoin price is gaining pace above the $55,000 resistance zone.
The price is trading above $55,000 and the 100 hourly Simple moving average.
There was a break above a major bearish trend line with resistance at $51,600 on the hourly chart of the BTC/USD pair (data feed from Kraken).
The pair could extend its current rally toward the $60,000 resistance zone.

Bitcoin Price Starts Fresh Surge

Bitcoin price remained well-bid above the $50,500 support zone. A support base was formed above the $51,500 level and the price started a fresh rally. BTC gained bullish momentum after it broke the $51,600 and $52,000 resistance levels.

There was a break above a major bearish trend line with resistance at $51,600 on the hourly chart of the BTC/USD pair. The pair surged over 10% and broke many hurdles near the $55,000 level. A new multi-week high is formed near $57,109 and the price is now retreating.

Bitcoin is still trading above $55,000 and the 100 hourly Simple moving average. It is also above the 23.6% Fib retracement level of the recent rally from the $50,950 swing low to the $57,109 high.

Source: BTCUSD on TradingView.com

Immediate resistance is near the $56,800 level. The next key resistance could be $57,000, above which the price could rise toward the $58,000 resistance zone. If the bulls remain in action, the price could even surpass $58,000 and test $58,800. The main hurdle for them is visible near the $60,000 zone.

Are Dips Limited In BTC?

If Bitcoin fails to rise above the $57,000 resistance zone, it could start a downside correction. Immediate support on the downside is near the $56,000 level.

The first major support is $55,600. If there is a close below $55,600, the price could start a decent pullback toward the 50% Fib retracement level of the recent rally from the $50,950 swing low to the $57,109 high. Any more losses might send the price toward the $53,200 support zone.

Technical indicators:

Hourly MACD – The MACD is now gaining pace in the bullish zone.

Hourly RSI (Relative Strength Index) – The RSI for BTC/USD is now above the 50 level.

Major Support Levels – $56,000, followed by $55,600.

Major Resistance Levels – $57,000, $58,000, and $60,000.

Read More
Blockchain

Market Expert Highlights Top Coins To Watch As Ethereum (ETH) Reaches 22-Month High

Market expert Miles Deutscher has identified several key trends and developments in the cryptocurrency market, particularly focusing on the Ethereum (ETH) rally and its implications for Layer-2 (L2) decentralized finance (DeFi) altcoins. 

Deutscher highlights that ETH’s recent surge to a 22-month high of $3,130 has sparked increased interest in L2/DeFi altcoins, presenting potential opportunities for investors.

Ethereum Price Strength Continues

In a recent post on social media X (formerly Twitter), Deutscher notes that Ethereum continues to show strength, especially compared to Bitcoin (BTC), which remains in a key consolidation phase at $51,100. Holding above the significant psychological level of $3,000, ETH’s bullish momentum is further fueled by reports of Justin Sun, the founder of TRON, purchasing over $500 million worth of ETH in recent days. 

Deutscher remains optimistic about ETH and ETH-betas leading up to the proposed exchange-traded fund (ETF) dates in May and the upcoming Dencun upgrade in March. There are also potential indications of ETH/BTC breaking out, with investor Andrew Kang actively increasing his ETH long position.

First, on his altcoins watchlist, Deutscher highlights the fee switch proposal underway at Uniswap (UNI). This US-based decentralized crypto exchange has seen notable price gains of over 37% in the past week, which could have significant implications for the entire industry from a regulatory standpoint.

Notably, the analyst believes that this development could potentially trigger a broader rotation into other DeFi 1.0 tokens such as Curve DAO (CRV), Compound (COMP), Aave (AAVE), and Frax Share (FXS), THORchain (RUNE), GMX, as investors seek to capitalize on the DeFi landscape.

Moving on to another altcoin that could see a price spike, Deutscher suggests that this week’s anticipated launch of Blast L2, founded by the same individual behind BLUR, presents an opportunity for BLUR stakers to receive tokens from the airdrop and potentially be further integrated into the ecosystem. 

Deutscher suggests that BLUR provides an alternative way to gain exposure to the Blast project, which has garnered bullish sentiment from numerous funds and thought leaders.

Following the positive news surrounding Uniswap, DYDX has been on the rise, with the token seeing a 7% increase in price over the last seven days. However, Deutscher cautions that a significant unlock is expected this week, which may tempt some recipients to sell, potentially causing a temporary dip in price.

Next in the spotlight, speculation surrounding the upcoming launch of Aevo (AEVO), which will allow developers to launch their protocols on its rollup and introduce an incentive program, is growing and generating interest in Ribbon Finance (RBN).

Given these developments, Deutscher notes that the prospect of pre-markets and IOU markets gaining “massive” attention and the recent record $4 million in fees positions RBN within an exciting narrative.

Deutscher’s Insights Point To Promising Trends

Following Deutscher’s mention of COTI last week, the coin has seen over 100% growth, breaking through key resistance levels. With the launch of their new privacy-enhancing L2 coinciding with the upcoming Ethereum Dencun upgrade, Deutscher notes that the protocol is in a favorable position for further price growth in the market.

On the other end of the spectrum, Deutscher acknowledges the rapid pace of market rotation and suggests keeping a close eye on Artificial Intelligence (AI) coins, which, as reported by NewsBTC, have seen significant gains with the hype surrounding AI projects such as Worldcoin (WLD).

Finally, with signs of life emerging over the weekend, according to the analyst, Rollbit Coin’s (RLB) burn mechanics position it as a leader in the “Rev Share/Real Yield” narrative. With the market potentially entering an “explosive bull run,” Deutscher believes the casino/gambling narrative could gain traction, benefiting projects like Rollbit, which has also seen gains of over 7% in the past 24 hours.

Featured image from Shutterstock, chart from TradingView.com

Read More
Blockchain

Arbitrum Beats Ethereum and Solana With 119% Surge In NFT Sales, NFT Resurgence On The Horizon?

Arbitrum (ARB), the Ethereum Layer 2 scaling solution, has been facing a bearish week after failing to establish a new price floor and falling below the $2 level. Additionally, the unlocking event scheduled for March could negatively impact the token’s price.

Despite ARB’s recent drop, the blockchain has seen a greater performance in the non-fungible token (NFT) market, surpassing Ethereum and Solana.

Arbitrum: Top Gainer In The Last Day

Data from Crypto Slam shows that the daily NFT sales volume in the Arbitrum blockchain recovered in the last 24 hours. The blockchain is the fourth largest by total NFT volume sales, showing a recent performance larger than Ethereum or Solana.

The chart above shows that Arbitrum is the top gainer after seeing a 119.41% surge in sales volume, over $1.26 million, during the last 24 hours. The blockchain also registered an 8.09% increase in wash sales from the day prior. Despite the rise, it only accounts for 0.11%, or $1,489, of the total sales volume.

Wash trading is a practice used to inflate an asset’s value artificially. As a form of market manipulation, the trader buys and sells the same asset, usually through a third party, to create the impression of a higher market activity of said asset.

Wash sales in the NFT market can happen through a single seller creating multiple accounts to trade the NFT or two sellers scheming to buy and sell each other’s digital assets.

The Arbitrum blockchain had 8,094 transactions during the last day, which accounts for a 9.04% increase. Its demand and offer of NFTs also rose by approximately 10%, with 3,557 buyers and 1,904 sellers in the previous 24 hours.

Solana and Ethereum saw a milder increase in their daily volume sales, with 26.69% and 5.42% respectively. Solana had a total sales volume of $10.9 million, divided by $9.17 million in authentic sales and $1.77 million in wash sales, which is 16.21% of the total volume and a 9.37% surge from the day prior.

Despite the sales volume being worth almost eleven million dollars, the demand and offer saw a significant 21.21% transaction drop and a 15.6% buyer decrease on the last day.

On the other hand, the NFT sales in the Ethereum blockchain saw a 2.9% drop in its total daily sales volume. Similarly, the number of transactions faced a slight 3.79% decline, with 23,931 transactions.

However, it’s worth noting that wash sales in the Ethereum blockchain saw a significant 19.33% decrease, with $7.14 million in the last 24 hours.

Is An NFT Resurgence In The Horizon?

The daily sales volume suggests a recent interest in some of the NFTs offered in the Arbitrum and other top blockchains. However, said interest could be a momentary thing in this ever-changing market. To paint a bigger picture, let’s look at what the 7-day time frame data suggests.

As seen in the chart below, five of the top ten blockchains by NFT sales volume have increased in this timeframe. Arbitrum, Bitcoin, and BNB Chain are among the top gainers in the last week.

Arbitrum remains the biggest winner with its massive 373.18% surge. The number of buyers and sellers also increased exponentially, with a 69% surge (approximately 35,000 buyers) and a 56% increase (27,000 sellers) in the past week.

Ethereum takes the first spot as the blockchain with the largest NFT sales volume of $202.5 million. However, Solana remains the winner in the transaction and the user’s metric. The blockchain saw 860,714 transactions in the past week, with over 242,041 buyers and 144,395 sellers.

Besides the sales volume, the transactions and buyer/seller numbers shone some light on the NFT market in the past week. These numbers, green in the top ten blockchains by NFT sales, undoubtedly suggest an increase in interest in the 7-day time frame. However, these numbers are significantly below the NFTs market performance shown in the 30-day metric.

Read More
Blockchain

Crypto Analyst Sounds Warning Alarm: Last Chance To Buy Bitcoin And Ethereum Before Bull Run

Crypto analyst Rager recently provided valuable insights to Bitcoin and Ethereum investors ahead of the imminent bull run. As part of his statements, he revealed the best time to go all in on the two largest crypto tokens by market cap, Bitcoin and Ethereum.

“Last Great Opportunity For This Cycle”

Rager opined in an X (formerly Twitter) post that the “last great opportunity for this cycle” will come around the Bitcoin Halving. In line with this, he also stated that he was still holding spot in positions and waiting for the “BTC and ETH pullback”, which he explicitly predicts will happen between now and May. 

Going by Rager’s opinion, this “nice dip” presents the perfect time for crypto investors to position themselves ahead of this cycle’s bull run. His statement also suggests that Bitcoin and Ethereum (and possibly other crypto tokens) will run massively after that pullback occurs. Interestingly, analysts have continued to identify this event as what will kickstart the next bull run.

Bitcoin Run To $60,000 Might Be Close

In a subsequent X post, Rager gave an idea of what price level Bitcoin could drop to when the crash occurred as he hinted that he wouldn’t invest until Bitcoin dropped to $48,000. He also provided an analysis of Bitcoin’s current price action, noting that it has been “composed of a few days of strong price action followed by a lot of chop and pullbacks.”

He added that Bitcoin and the broader crypto market “has a lot of upside opportunity.” However, he warned that there could likely be a short-term pullback, which he predicts could be the last great opportunity to invest. Rager also claimed that Bitcoin would break the $60,000 resistance for the first time since 2021 once this pullback is done. 

ETH To $3,500 Is The Next Target

In another X post, Rager mentioned that the $3,500 price level is the target for the current bullish momentum in the market. He also believes this will likely happen “sooner rather than later” with the help of the Ethereum Spot ETF rumours. Industry experts have expressed confidence that these funds will be approved.  

$3,500 is just Rager’s first target for Ethereum in this cycle’s bull run, noting that it isn’t the “peak high by any means.” Meanwhile, the analyst stated that the peak of this bull run is still far off. Using the crypto fundraising data as an indicator to determine when the market top is almost in, he noted that fundraising was still at lower levels compared to peak bull market activity.

Read More
Blockchain

OG Ethereum ERC-404 Token PANDORA Is Rallying Again, What’s Behind It?

PANDORA, the first token to use the Ethereum ERC-404 token standard, is on the move after slowing down for a few weeks. The token’s price saw a significant surge over the weekend, rising around 50% to clear $24,000 once more. This recovery was triggered by a number of factors, so here they are.

Whales Set Their Sights On PANDORA

The most obvious reason behind the price push recorded for PANDORA over the weekend can be traced back to significant whale activity. On-chain data tracking website Lookonchain, flagged a number of whale transactions that took place in the days leading up to the price surge.

The first whale accumulation was seen on February 20, when Lookonchain reported that a single whale had spent $4.89 million to purchase 244.24 PANDORA tokens. The buying spree took place over a number of days, and by the time the whale was done, they had an average entry price of $20,044.

A giant whale spent 4.89M $USDC to buy 244.24 #PANDORA at an average price of $20,044 on Feb 13, Feb 14 and today.https://t.co/DR58pEXN5j pic.twitter.com/c7Q3sM6ksO

— Lookonchain (@lookonchain) February 20, 2024

A couple of days later on February 23, the on-chain tracking platform reported that another whale was making their PANDORA play. This time around, the new whale spent $1.37 million buying 71.45 PANDORA tokens at an average price of $19,268.

Another whale is buying #PANDORA, having spent 1.37M $USDC to buy 71.45 #PANDORA at an average price of $19,268 so far.https://t.co/o1z3c6EfLrhttps://t.co/NMzLjtdMqm pic.twitter.com/j0mGVsMik5

— Lookonchain (@lookonchain) February 23, 2024

Together, these whales scooped up a little over $6 million worth of tokens. When the price eventually hit $24,000, the first whale saw profit margins of almost $1 million, while the second whale was sitting on a profit of over $330,000.

First Set Of Incentives Land For Holders

Another factor that has helped push the price of PANDORA over the week is incentives in the form of airdrops being announced for PANDORA holders. Monarch, a project also built on the Ethereum ERC-404 token standard, announced earlier in February that it would be awarding tokens to PANDORA investors.

A total of 5% of the token supply was announced to be allocated as an airdrop for PANDORA holders. This incentive, coupled with the fact that PANDORA announced that it is gearing up to release the latest iteration of the ERC-404 token standard, created demand for the token.

PANDORA Token Performance

During the weekend, the PANDORA price went from trending around $16,000 to rising 50% in one day to clear the $24,000 level. However, this high price level could not be sustained for long as a sharp dump would follow on February 23, apparently triggered by whales dumping their holdings.

In the last day, the price of the token has continued to fluctuate between $16,000 and $17,000. As of the time of writing, the altcoin is trading at $17,139, with 5% losses in the last day, according to data from Dexscreener.

Read More
Blockchain

Will Worldcoin End In “Tears”? This Analyst Thinks So

One analyst on X is concerned about the long-term sustainability of Worldcoin (WLD), a project aiming to build a universal digital identity system. While acknowledging the project’s innovative approach and recent upswing that has seen WLD more than 4X, the analyst thinks “Worldcoin will end in tears.”

FDV Versus Market Cap Soars Doubt: A Massive Price Dump Incoming?

In a post, the analyst points to a significant discrepancy between Worldcoin’s fully diluted valuation (FDV) of $82.1 billion and its current market capitalization of around $1.1 billion, as seen from CoinMarketCap. To compare, Ethereum (ETH), the most valuable altcoin, has an FDV of $369 billion, slightly less than the current market cap of around $362.1 billion.

The FDV shows the hypothetical market cap if all coins or tokens were in circulation. On the other hand, the market cap shows the total valuation of coins in circulation.

Typically, the higher the FDV, the higher the chance of the coins in circulation being diluted when locked assets are released. Prices will likely take a hit with the deluge of coins hitting the secondary markets. The sell-off would especially be intense if demand doesn’t increase proportionally.

In Worldcoin’s case, the massive difference between FDV and the current market cap portends possible price dumps should a considerable chunk of WLD be released. And this will likely be the case, especially in light of what’s expected in the coming weeks.

A breakdown of its tokenomics shows that besides coins airdropped to users, a big chunk was allocated to venture capital firms and individuals like Alameda Research and Three Arrows Capital (3AC). Token Unlocks data show that more WLD will be unlocked in less than five months. The release, observers note, could heap pressure on the coin, possibly pushing it lower from the current valuation.

Worldcoin Is Expanding, Will WLD Bulls Succeed?

Worldcoin plans to release a universal digital identity system. This solution will run on the blockchain and, to a small degree, rely on artificial intelligence (AI). Although the project faced regulatory challenges in multiple countries, including Kenya, Worldcoin recently expanded into Singapore. 

Even so, the analyst is concerned that the lack of demand-side drivers, specifically adoption, could slow down the uptrend. WLD is in a sharp uptrend, looking at the development in the daily chart.

If the coin stays above $6, WLD could soar in the coming sessions.

Read More
Blockchain

Bitcoin Rally: Crypto Analyst Says New Peak Is Within Arms’ Reach

With the price movement of Bitcoin becoming less volatile and the markets becoming unstable once more, some people think a crash is imminent for BTC, while some believe and anticipate a potential for further upward surge.

New All-Time High For Bitcoin Is Within An Arms Reach

In a recent development on the social media platform X (formerly Twitter), Cryptocurrency analyst and investor, Crypto Jelle, has shared a bold prediction regarding Bitcoin – the leading crypto asset.

The crypto expert’s analysis came in light of the bearish speculations within the community around the price action of BTC. According to him, many people are discussing the bearish signs, pullbacks, and corrections that BTC could witness in the near future.

However, Crypto Jelle has asserted that despite the negative sentiments it “does not change anything about the bigger picture” for BTC. Furthermore, he has urged investors to “stick to the plan,” noting that a new all-time high is just “within arms reach.”

The post read:

Lots of people talking about bearish signs, pullbacks, and corrections, but these things change nothing about the bigger picture. Stick to the plan, all-time highs are within an arms reach.

Jelle has also highlighted another reason why he is bullish on Bitcoin and sticking with the digital asset. In another X post, Jelle stated that BTC is still holding above $50,000, with the entire crypto market cap approaching $2 trillion.

Nonetheless, the “average Joe still does not care,” prompting him to believe that “the cycle is not over” yet. He further pointed out that there will be lucid indications that retail is about to flood the market.

As a result of this, Bitcoin is set to witness higher adoption as search interest for BTC will surge higher. Jelle anticipates that during this time, American-based crypto exchange Coinbase will return to its top spot in the app store.

BTC Compared To Warren Buffett’s Berkshire Hathaway Stock

Lately, a lot of market experts have appeared to be bullish about Bitcoin. One of these is Max Keiser, a BTC advocate, who has compared the crypto asset to the well-known Warren Buffett’s Berkshire Hathaway Stock.

According to Max Keiser, acquiring BTC today is just like buying Berkshire Hathaway shares in its initial days. It is noteworthy that during its earlier days, the stocks were sold for $1,500 each, which is now being sold for $628,000. With this comparison, Keiser advocates that BTC could potentially rise by over 41,000% at its present price of $51,000. 

This price of Bitcoin is down by over 2% in the past 7 days, currently trading at $51,147. CoinMarketCap’s data shows that its market cap is down by 0.86%, while its trading volume is up by over 6%.

Read More
Blockchain

Crypto Analyst Predicts Dogecoin Parabolic Breakout Above $3.5, Here’s When

Dogecoin has been in the spotlight lately after a notable uptick in the usage of its network over the last month. However, this adoption has not translated to any notable increase in the asset’s price, prompting speculations of a delayed breakout for the meme coin.

Crypto Analyst Says Dogecoin Could Breakout Soon

Even as Dogecoin continues to put on a lackluster performance, it has not shaken the bullishness of investors. One of the analysts who believe that the DOGE price is destined for great things is crypto analyst Ali Martinez, popularly known as Ali_Charts on X (formerly Twitter).

According to an analysis shared by Ali on X, the meme coin may be looking to stage a repeat of the parabolic breakouts seen over the years. The crypto analyst points out that Dogecoin is mirroring past performance, and the patterns are beginning to line up to the months leading to the previous breakouts.

The first instance of this breakout happened between 2017 and 2018 when there was an enormous rally after 97 bars and 679 days, as outlined by the analyst. During this time, the price of DOGE would rise by more than 8,000% before the rally was over.

The next time a similar rally would occur was between 2020 and 2021. In the same vein, there were 97 bars and 679 days between the previous rally and the next one. This time around, DOGE would go on to stage an even larger rally, rising more than 23,000% to reach its current all-time high of $0.7.

Now, the analyst points out that Dogecoin has almost reached the infamous 97 bars and 679 days once more, which could end in a massive rally. If this holds, then the DOGE price could break out in April when this pattern would complete, and the DOGE price could rise over the $3.5 level as a result.

DOGE Price Could Rally As High As $10

This is not the first that the crypto analyst is pointing out the possibility of a Dogecoin parabolic rally. In an analysis that was posted last week, the analyst also pointed out that the DOGE price was following patterns similar to what was seen back in 2020 before the infamous rally.

He points out a descending triangle that forms over two years, appearing once more. This same descending triangle was also seen before the DOGE price had risen from less than $0.003 to over $0.7 in a matter of months.

In this analysis, Ali points out that if Dogecoin were to go on a similar rally, then the price of the meme coin could rise as high as $10. “Having broken out of a descending triangle, it’s now in a consolidation phase, potentially setting the stage for another significant bull run,” the crypto analyst said.

Read More