Crypto Corner Café

Taste The Future

Blockchain

Blockchain

Bitcoin ETF Drama Reveals Post-Approval Price Trend: Experts

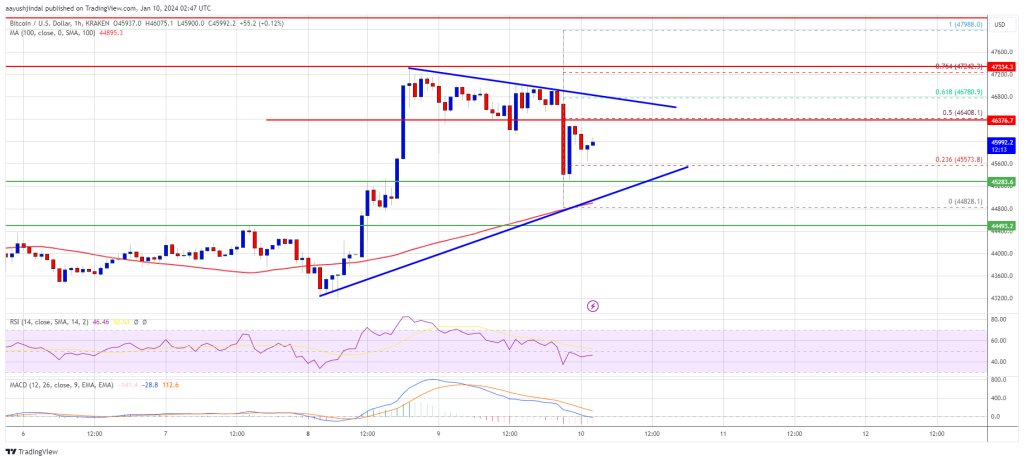
The Bitcoin market was swept into a frenzy following an alleged hack of the US Securities and Exchange Commission’s (SEC) X account, falsely claiming the approval of 11 spot ETFs. This misinformation led to a rollercoaster in Bitcoin’s price, which initially soared from $46,800 to $48,000, only to crash to $45,000 within a span of 20 minutes.

This incident has become a pivotal moment for market analysts, providing insights into how the market might react to today’s potential Bitcoin spot ETF approvals in the short term. So here’s what experts from K33 Research, QCP Capital, and Daan Crypto Trades have to say.

#1 K33 Research: Approval Will Be ‘Sell-The-News” Event

Vetle Lunde, a senior analyst at K33 Research, provided an in-depth analysis of the market’s reaction to the erroneous announcement. He observed that the market’s immediate response was indicative of a tendency towards a ‘sell-the-news’ reaction. The initial surge in Bitcoin’s price was quickly met with a flood of long positions, causing a significant price fluctuation.

“The market showed its hands yesterday; the ETF approval rehearsal favors a sell-the-news reaction. Immediately after the announcement, longs quickly crowded the market, enforcing a whipsaw in the following minutes,” Lunde stated.

Lunde also pointed out that until the SEC’s clarification, the market largely accepted the announcement at face value, triggering an organic reaction. He outlined the sequence of events, noting a 2.4% increase in Bitcoin’s price within four minutes post-announcement, followed by a 1.4% decrease in 14 minutes until Bloomberg debunked the approval news.

The market eventually stabilized when Gensler confirmed the hack, highlighting the market’s sensitivity to regulatory news and rumors.

#2 QCP Capital: Warning Sign For Bitcoin Traders

QCP Capital, in their “QCP Market Update – 10 Jan 24,” reflected on the bizarre nature of the event with a mix of humor and analysis. “We are on the cusp of a BTC Spot ETF approval, and what transpired in the last 24 hours is something you can’t make up,” their update began.

They pointed out the lukewarm initial reaction to the ‘approval,’ suggesting that the market might have already priced in the possibility of an actual ETF approval.

“The initial reaction to the ‘approval’ was muted with BTC being unable to trade out of the resistance area. We take this as a warning sign that an approval is mostly priced in and there may not be a huge rally post the approval,” QCP warned.

QCP Capital also focused on the implications of this event for future market trends. “The restrained response to the faux approval signals a warning – the actual approval of a Bitcoin ETF might not trigger the expected rally,” they observed, also pointing to the current market dynamics, such as the elevated options volatility and spot-futures basis spread. Notably, the firm sees Bitcoin’s next support at $40,000 to $42,000, and resistance around 48.500.

Daan Crypto Trades: ETH/BTC Could See A Spike

Daan Crypto Trades provided a concise but insightful analysis. “The false ETF approval news was a litmus test for the market’s post-approval direction,” he commented. The analysis highlights the pattern of Bitcoin’s price spiking and then fully retracing following the fake announcement.

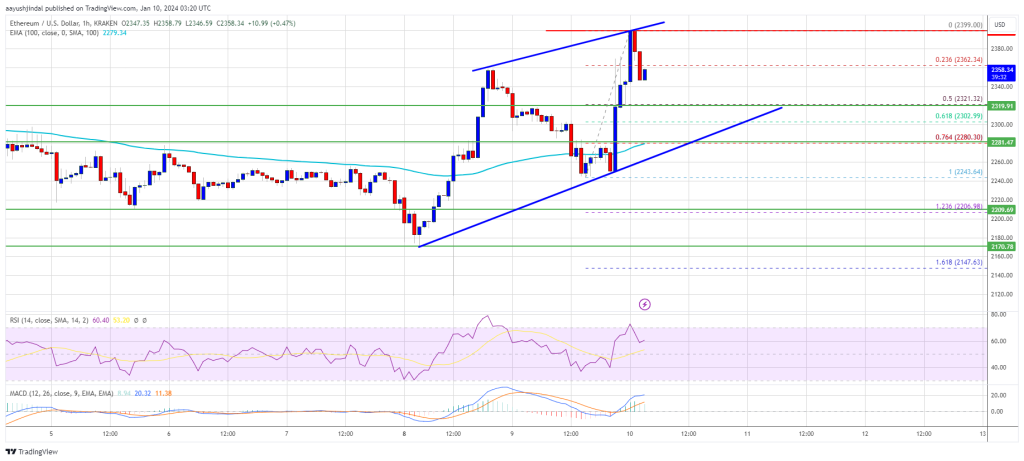
“This pattern could well repeat upon actual ETF approval, but with more pronounced selling pressure,” he suggested. Daan Crypto Trades also touched on the broader market implications, especially for the ETH/BTC ratio, which started rallying immediately after the fake announcement.

He further remarked:

ETH/BTC started rallying straight away which is also what we’ve been looking for. I think today we might get one more small spike down on ETH/BTC as BTC spikes up but after that I don’t see much holding back the ETH/BTC ratio anymore. Especially if BTC cools off post ETF.

At press time, BTC traded at $45,346.

Read More
Blockchain

Shiba Inu Whale Accumulates Massive Holdings, Amid Price Recovery

Ethereum-based memecoin Shiba Inu (SHIB) has once again garnered the attention of the crypto community as the altcoin has witnessed a massive whale accumulation leaving the community to ponder on the reason behind the whale accumulation.

Shiba Inu Whale Amassed 1.44 Trillion SHIB

Recent data from crypto analytics firm Lookonchain has revealed that new buyers are stacking Shiba Inu on Binance and Gate.io. The analytics platform shared the data on the social media platform X (formerly Twitter).

As of the time of the report, over 1.44 trillion SHIB, valued at about $13.36 million, had left exchanges in less than 48 hours. With split purchases over a period of time, the accumulation was a clear move.

Lookonchain revealed that the unknown whale addresses 0xF633Cd….3493Bbac began the accumulation on the Binance platform. The whale reportedly moved 400 billion SHIB tokens from the platform to the wallet address.

Additionally, the whale received another 146,342,102,182.77 SHIB around an hour later. This brings down the total amount of SHIB withdrawn from Binance to 546,342,102,182.77, valued at approximately $5.18 million.

Furthermore, the analytics firm reported another massive Shiba Inu withdrawal from the crypto exchange Gate.io. Lookonchain shows that the whale started the accumulation from Gate.io with an initial batch of 32,913,563,627.61 SHIB tokens.

Meanwhile, the next whale accumulation which was the largest consists of 499,999,665,444.45 SHIB. The whale then completed the move with an additional 362,134,360,200.61 SHIB buy. This brought the total amount of SHIB amassed to a whopping 895,047,589,272.67 valued at about $8.5 million.

According to Lookonchain, the aforementioned wallet address 0xF633Cd….3493Bbac is responsible for the tokens withdrawn from both crypto platforms. 

These transactions came at a time when the Shiba Inu was experiencing a price rebound. However, there is no solid proof that these transactions have affected the price of SHIB positively.

A Significant Drop In Shibarium Transaction Counts

The Shiba Inu layer 2 blockchain platform Shibarium has experienced a significant drop in its transaction counts. The drop in transactions might suggest a broader change in users’s confidence and engagement.

According to data from Shibariumscan, the network’s daily transactions are currently pegged at 2.73 million. This is the lowest the network has seen in months now.

The network has been seeing a notable decrease in transaction counts since the close of the previous year. The drop in daily transaction counts indicates a decline in the network’s adoption.

Data from Shibarium Explorer shows that the network’s utilization is down up by 11%. However, this is a drop from the 30% network utilization it recorded on Monday, January 8.

As of the time of writing, SHIB was trading at $0.000009522, indicating an increase of 1.20% in the past 24 hours. Meanwhile, its 24-hour trading volume is currently seeing an uptick of 64%, according to CoinMarketCap.

Read More
Blockchain

Bitcoin Spot ETF: SEC Mishap Triggers $220 Million In Crypto Liquidations

On Tuesday, the crypto market was taken by storm when a tweet emerged from the official X (formerly Twitter) account of the United States Securities and Exchange Commission (SEC) saying all Spot Bitcoin ETF applications had been approved. This had been initially followed by a surge in price but this was short-lived as the price would crash shortly after. The reason for this was because Gary Gensler, chairman of the Commission, revealed that the tweet was fake and the regulator’s social media account had been compromised.

SEC Hack Triggers $220 Million In Liquidations

In the wake of the wild Bitcoin price fluctuations that were triggered by the SEC’s hack, a large number of crypto traders found themselves with massive losses on their hands. According to data from CoinGlass, over $220 million have been liquidated in the last 24 hours, leading to the second-largest liquidation event so far in 2024.

The website also notes that over 70,000 traders were victims of this liquidation event as well. Also, given that the price of Bitcoin and other assets in the crypto market had seen price fluctuations in both directions, both long and short traders were affected.

However, given that the crash to the downside has persisted for longer, long traders have come out as the group with the most liquidations during this time. Out of the more than $220 million in liquidations recorded, long trades made up 60.47% with $133.5 million, while the volume of short liquidations came out to $87.29 million for the same time period.

Bitcoin saw the largest single liquidation order during this time as well which took place on the ByBit exchange. A single trade worth $6 million was liquidated across the BTCUSD trading pair, with total liquidations on the crypto exchange coming out to $36.66 million. This falls behind market leader Binance with $83.88 million and OKX with $73.97 million.

Spot Bitcoin ETF Is A Sell The News Event?

The debate of whether the Spot Bitcoin ETF approval has already been priced in and if an announcement will lead to a decline in price has been waxing stronger over the last few weeks. Experts have chimed in to give their thoughts on what will follow an approval.

Crypto analyst Andrew Kang believes that approval would lead to a scramble among applicants to grab as much as possible from the $10 billion to $20 billion expected to come from fees. As such, they will all be at the forefront of marketing to push their ETFs.

On the flip side, renowned economist, Peter Schiff, believes that a spot ETF would actually not be good for the asset. Apparently, the advent of a spot Bitcoin ETF would mean that there is no longer any good news to trigger a price rally. As such, it would turn into a ‘sell the news’ event.

However, if the performance from Tuesday is anything to go by, it could mean that the ETF is already priced in given that there was a decline in price, even before the SEC dismissed the tweet from the hacked account.

Read More
Blockchain

Crypto Chaos Meets BONK Bliss: 15% Rally Bucks The Trend

In a market dominated by red arrows, one Solana-based meme coin is swimming against the tide. BONK, the self-proclaimed “first Solana dog coin,” has soared a staggering 15% in the past 24 hours, emerging as a beacon of green amidst a sea of plummeting peers.

While Dogecoin and Shiba Inu wallow in double-digit losses, BONK has bucked the downtrend, leaving investors wondering if this canine crusader has the bite to back its bark.

But BONK’s bullish gallop isn’t an isolated thing. This week has seen the meme coin rise 10%, propelling its value to $0.00001363 – a testament to its impressive medium-term momentum.

Positive Forecast For BONK

Analysts predict this positive trajectory to continue, especially if tomorrow’s highly anticipated decision by the US Securities and Exchange Commission (SEC) on Bitcoin ETFs paves the way for a broader market bull run.

In such a scenario, BONK’s potential for disproportionate gains, even eclipsing Shiba Inu’s, is a tantalizing prospect for risk-tolerant investors.

Fueling BONK’s ascent is a potent cocktail of positive factors. Its social engagement has nearly doubled, sparking a buzz that translates into tangible market momentum.

Trading volumes have skyrocketed 130%, reaching a staggering $285 million in the past day – more than twice that of Shiba Inu, showcasing the surging interest from retail investors.

This surge in activity has catapulted BONK’s market cap past $800 million, cementing its place as the 81st largest digital asset, a remarkable feat for a relatively young project.

Further driving BONK’s appeal is its upcoming listing on OKX, a leading global cryptocurrency exchange. This strategic move promises to broaden BONK’s reach and expose it to a wider audience, particularly within the Solana ecosystem.

The potential surge in investor interest this listing could trigger could be a significant catalyst for future price appreciation.

BONK Technical Overview

Technical indicators add to the optimistic picture. BONK currently dances above both the 10-day and 200-day Simple Moving Averages (SMAs), signaling robust buying pressure.

The 20-day Exponential Moving Average (EMA) sits comfortably above the 50-day EMA, reinforcing the upward trend. And for good measure, the Chaikin Money Flow index flashes a bullish $0.20, painting a picture of healthy and sustained buying interest.

However, as with any cryptocurrency, caution is paramount. Meme coins are notorious for their volatility, and BONK’s recent gains are no guarantee of future glory.

Regulatory uncertainties surrounding the SEC’s decision further cloud the outlook. Additionally, BONK’s fortunes remain tied to the overall health of the cryptocurrency market.

Despite these caveats, BONK’s performance stands out like a sore thumb in the current market landscape.

Its technical indicators, combined with its growing social buzz and strategic moves like the OKX listing, present a compelling case for the meme coin’s continued ascent.

Whether BONK dethrones Shiba Inu to become the king of meme coins remains to be seen, but one thing’s for sure – this Solana underdog is barking loud enough to turn heads in the crypto arena.

Featured image from Freepik

Read More
Blockchain

Shiba Inu Lead Dev Hints At Major Progress As SHIB Holds Key Support

Shiba Inu lead developer Shytoshi Kusama has hinted at significant progress in the project’s ambitions. Kusama’s statements, shared on X (formerly Twitter), provide insights into the strategic direction of Shiba Inu and its integration with broader internet infrastructure.

Alluding to the fake spot Bitcoin ETF approval news, Kusama stated, “Hey, SHIBARMY! While everyone is focused on approved or not, hacked or not, we remained focused on creating what we said we would: A Network State. Since I’m hearing a lot of Web 3 but not enough WEB, let’s talk about SHIB NAME TOKENS.”

Elaborating on the project’s direction, Kusama highlighted the importance of domains in the digital world: “Domains are the identity layer of the Internet. For 40 years, they have made using the Internet easier for all. If you type http://shib.io into your browser, you go to the Shib website. What if you could do more?”

In a push to gain adoption, Shiba Inu is partnering with D3 to apply for the .shib Top-Level Domain (TLD), aiming to make a significant impact on the internet landscape. “This will allow us to tap into infrastructure that is used by 5.3 BILLION people worldwide,” Kusama noted, emphasizing the extensive reach of this endeavor.

The plan involves utilizing domains to establish a seamless identity layer for Shib across the internet, without necessitating special software, wallets, plugins, or extensions. This move could drastically simplify user interaction with the Shiba Inu ecosystem, potentially revolutionizing digital identity verification and interaction on Web3 platforms.

Kusama envisions a future where .shib domains could be used for various purposes, including hosting websites, sending and receiving emails and digital assets, and serving as usernames on Web3 platforms.

“You already use domains all over Web3. You use it to access our ecosystem, you use it to access the exchanges where you buy and sell SHIB, LEASH and BONE, you use it to open X to read this tweet. Now imagine if those domains ended in .shib,” Kusama remarked.

Shiba Inu Price Analysis

Simultaneously, the SHIB/USD pair’s technical analysis indicates a cautiously optimistic outlook. The weekly chart reveals a break from a downtrend as well as a thus far successful retest of the breakout. As NewsBTC reported, SHIB broke out of the descending triangle pattern in early December and recorded a new higher high after a series of lower highs from August 2022 to November 2023.

Despite experiencing a retracement of approximately 28% from this local peak, SHIB has displayed resilience by maintaining key support levels on the weekly time frame. Notably, the previous week’s close remained above the triangle’s descending trendline, which is a bullish signal. Additionally, SHIB managed to sustain prices above the 0.236 Fibonacci level at $0.00000878.

The maintenance of the price above the 20-week EMA is another bullish indicator, especially if SHIB manages to close above this level again this week. Should this trend persist, a retest of the 0.5 Fibonacci level is plausible. However, traders should anticipate significant resistance in the zone between the 0.382 Fibonacci level, approximately $0.00001050, and $0.00001063.

In the event of an extended upward trajectory, the 0.618 and 0.786 Fibonacci levels, at about $0.00001327 and $0.00001525 respectively, are poised to be the next critical resistance junctures. The ultimate target for bullish momentum could be the August 2022 high of $0.00001777.

The volume profile reinforces this bullish outlook, revealing a spike in trading activity that coincides with the recent appreciation in price, indicative of robust buying pressure. The RSI’s neutral stance at 53.63 lends flexibility to the market’s directional bias, implying that there is sufficient headroom for price expansion before the asset enters overbought or oversold territory.

Read More
Blockchain

Is Stacks The New Safe Haven? STX Soars 16% In Turbulent Market

In a stunning divergence from the recent altcoin carnage, Stacks (STX) has emerged as a beacon of green. The token has not only weathered the storm but thrived, soaring for seven consecutive weeks and etching its highest price point since March 2023.

At the time of writing, STX was trading at $1.80, down 10% in the last 24 hours, but managed to sustain a solid 16% rally in the last seven days, data from Coingecko shows.

This bullish defiance is no fluke. Stacks broke through a key resistance level, showcasing investor confidence. The lack of pullbacks underscores the sustained buying pressure, while the flash crash’s long wick transformed the once-intimidating barrier into a sturdy support floor.

STX Resilience Amid Market Volatility

Even amid the broader market correction, STX’s resilience speaks volumes about its relative strength. While this remarkable ascent undoubtedly excites, prudent skepticism remains.

The rapid climb without pullbacks might trigger a sudden correction, and concerns about potential overheating linger. Ultimately, STX’s fate remains intertwined with the overall cryptocurrency market sentiment.

Stacks has surged 694% in the past year, benefiting from the Bitcoin boom and standing out amid a recent decline in altcoins. This growth is driven by a mix of optimism around Bitcoin and Stacks serving as a prominent layer 2 solution for the cryptocurrency.

STX Price Movement Amid Anticipation Of BTC ETF Nod

Meanwhile, the potential approval of a Bitcoin ETF has generated excitement in the crypto community, benefiting projects like Stacks.

Stacks’s ability to incorporate smart contracts and decentralized applications onto the secure Bitcoin blockchain positions it well for potential developments in DeFi and NFTs within the Bitcoin ecosystem.

As a leader in the Bitcoin layer 2 space, Stacks is well-positioned to meet the rising demand for scaling solutions. This advantage allows it to attract developers and users interested in building on the security of Bitcoin.

However, the crypto market is volatile, and Stacks’s success depends on ongoing innovation and adoption, given intense competition in the layer 2 sector.

While acknowledging these challenges, Stacks’s impressive performance should be monitored by investors.

The cryptocurrency is navigating the evolving landscape of the Bitcoin resurgence, and its ability to sustain momentum and establish a lasting presence remains uncertain. Nonetheless, the current chapter of Stacks’s story is filled with exciting possibilities.

STX Technical Overview

Stacks (STX) is feeling the heat from the bulls, who are aiming to break through the $1.80 psychological barrier and potentially climb to $1.95, the upper channel limit.

This bullish sentiment finds fuel in a rising Relative Strength Index (RSI) at 66, suggesting buyer dominance, and upward-trending moving averages, hinting at favorable market conditions. If the bulls conquer $1.95, $2.0, a 14% climb from current levels, could be the next stop.

However, caution lurks beneath the optimism. Buyer exhaustion or profit-taking could trigger a correction, sending STX dipping towards $1.6 and even $1.48, the lower channel boundary. The moving averages currently act as strong support zones, potentially buffering this potential dip.

While the bulls lead the charge, keep an eye on the RSI and price action around $1.80 and $1.95. A clean break could propel STX higher, but consolidation or a dip is also a possibility.

Featured image from Shutterstock

Read More
Blockchain

AVAX Smashes South: Can Avalanche Find Traction After 15% Plunge?

AVAX, native token of the Avalanche network, made a resounding entrance into the cryptocurrency markets at the onset of the year, establishing itself as a prominent player and outpacing many other altcoins.

The initial enthusiasm surrounding AVAX, however, underwent a notable transformation as the narrative took an unexpected turn. Presently, the token finds itself perched at $36.65, reflecting a marked shift from its earlier bullish trajectory. Over the last seven days, AVAX has encountered a challenging period, sustaining a 15% loss.

AVAX Downturn Sparks Concerns, Social Silence

The reasons behind this recent downturn could be multifaceted, ranging from market sentiment shifts to external factors influencing broader cryptocurrency trends. Investors and market analysts are closely monitoring the situation to discern the underlying dynamics at play and determine whether this is a temporary correction or indicative of a more sustained trend.

Furthermore, a curious case emerges – the dwindling social volume. Despite AVAX’s resilience, online chatter surrounding the platform has taken a nosedive, raising questions about the sustainability of the coin.

The diminishing social volume might suggest a divergence between market performance and investor sentiment, prompting a closer examination of factors influencing both the cryptocurrency’s value and the perception within the community.

Positively, though, the market capitalization of Avalanche has risen by more than 5% in the past few days, indicating a greater influx of investors.

Not too long after Grayscale’s Digital Large Cap Fund adopted the layer-1 blockchain, Avalanche saw a robust comeback. With billions of cryptocurrency assets under its management, Grayscale is one of the biggest digital asset managers.

The inclusion of AVAX in Grayscale’s fund indicates that institutions will still be interested in Avalanche until 2024 and beyond.

Meanwhile, Avalanche’s circulating supply shrank significantly in the latter half of 2023, fueled by a surge in activity surrounding “inscriptions.”

Avalanche Surges: Record Token Burns Celebrated

These data-on-chain creations generate transaction fees, which are then permanently removed from circulation through the network’s burn mechanism.

December alone saw a record 195,000 token burn, a testament to the growing popularity of inscriptions on Avalanche.

Experts attribute this trend to several factors. Inscription-based transactions, initially popular on Bitcoin, are finding new life on Avalanche due to their creative potential and contribution to the burn mechanism.

This creates a positive feedback loop, attracting users and further reducing the circulating supply. Additionally, the rise of inscription activity suggests a growing and engaged Avalanche community, which bodes well for the network’s long-term health.

However, the implications of this trend are nuanced. While token scarcity could lead to increased AVAX value over time, similar to Bitcoin, it also raises concerns about rising transaction fees and potential centralization if large inscription projects control a significant portion of the fee pool.

Featured image from Shutterstock

Read More
Blockchain

ADA Price Faces Key Hurdle, Can Cardano Surpass This To Start Fresh Rally?

Cardano (ADA) is attempting a recovery wave from the $0.4650 zone. ADA could start a fresh rally if there is a close above the $0.550 resistance.

ADA price is moving higher from the $0.4650 zone.
The price is trading below $0.570 and the 100 simple moving average (4 hours).
There is a key bearish trend line forming with resistance near $0.545 on the 4-hour chart of the ADA/USD pair (data source from Kraken).
The pair could accelerate higher if there is a clear move above $0.545 and $0.550.

Cardano Price Attempts Fresh Increase

After a strong rally, Cardano faced sellers near the $0.675 zone. ADA started a fresh decline below the $0.620 and $0.600 support levels, unlike Bitcoin and Ethereum.

There was a drop below the $0.550 support and the 100 simple moving average (4 hours). Finally, the price found support near the $0.4650 zone. The price is now attempting a fresh increase above the $0.500 resistance zone. The price tested the 23.3% Fib retracement level of the downward move from the $0.6768 swing high to the $0.4650 low.

ADA is now trading below $0.570 and the 100 simple moving average (4 hours). There is also a key bearish trend line forming with resistance near $0.545 on the 4-hour chart of the ADA/USD pair.

On the upside, immediate resistance is near the $0.532 zone. The first resistance is near $0.545 and $0.550. The next key resistance might be $0.570 or the 50% Fib retracement level of the downward move from the $0.6768 swing high to the $0.4650 low.

Source: ADAUSD on TradingView.com

If there is a close above the $0.570 resistance, the price could start a strong rally. In the stated case, the price could rise toward the $0.620 region. Any more gains might call for a move toward $0.650.

Another Decline in ADA?

If Cardano’s price fails to climb above the $0.545 resistance level, it could start a fresh decline. Immediate support on the downside is near the $0.500 level.

The next major support is near the $0.465 level. A downside break below the $0.465 level could open the doors for a test of $0.432. The next major support is near the $0.420 level.

Technical Indicators

4 hours MACD – The MACD for ADA/USD is losing momentum in the bearish zone.

4 hours RSI (Relative Strength Index) – The RSI for ADA/USD is now below the 50 level.

Major Support Levels – $0.500, $0.465, and $0.432.

Major Resistance Levels – $0.532, $0.545, and $0.570.

Read More
Blockchain

Ethereum Price Technical Setup Suggests Fresh Surge Above $2,400

Ethereum price climbed higher above the $2,350 resistance. ETH outpaced Bitcoin and might even attempt a clear move above the $2,400 resistance.

Ethereum is attempting a fresh increase above the $2,350 resistance level.
The price is trading above $2,320 and the 100-hourly Simple Moving Average.
There is a key rising channel forming with support near $2,300 on the hourly chart of ETH/USD (data feed via Kraken).
The pair could start a fresh surge if there is a close above the $2,400 level.

Ethereum Price Starts Increase

Ethereum price formed a base above the $2,220 level and started a fresh increase. ETH saw a sharp upward move despite a drop in Bitcoin below $46,500. The price gained pace for a move above the $2,300 and $2,320 levels.

It even broke the $2,350 resistance and tested the $2,400 zone. A high was formed near $2,399 and the price is now consolidating gains. There was a minor drop below $2,360. The price declined below the 23.6% Fib retracement level of the recent increase from the $2,243 swing low to the $2,399 high.

Ethereum is now trading above $2,320 and the 100-hourly Simple Moving Average. There is also a key rising channel forming with support near $2,300 on the hourly chart of ETH/USD.

If there is a fresh increase, the price might face resistance near the $2,380 level. The next major resistance is now near $2,400. A clear move above the $2,400 level might send ETH toward $2,440. A close above the $2,440 resistance could start a decent upward move.

Source: ETHUSD on TradingView.com

The next key resistance is near $2,550. If the bulls push Ethereum above $2,550, there could be a rally toward $2,720. Any more gains might send the price toward the $2,800 zone.

Another Decline in ETH?

If Ethereum fails to clear the $2,400 resistance, it could start a fresh decline. Initial support on the downside is near the $2,320 level or the 50% Fib retracement level of the recent increase from the $2,243 swing low to the $2,399 high.

The first key support could be the $2,300 zone. A downside break and a close below $2,300 might send the price further lower. In the stated case, Ether could test the $2,240 support. Any more losses might send the price toward the $2,150 level.

Technical Indicators

Hourly MACDThe MACD for ETH/USD is gaining momentum in the bullish zone.

Hourly RSIThe RSI for ETH/USD is now above the 50 level.

Major Support Level – $2,300

Major Resistance Level – $2,400

Read More
Blockchain

Bitcoin Price Rejects 48K After The SEC Drama But Uptrend Still Intact

Bitcoin price jumped toward $48,000 after the hacked SEC account tweet. BTC trimmed all gains, but the uptrend support is still intact near $45,200.

Bitcoin spiked toward the $47,800 and $48,000 resistance levels.
The price is trading above $45,500 and the 100 hourly Simple moving average.
There is a major contracting triangle forming with resistance near $46,800 on the hourly chart of the BTC/USD pair (data feed from Kraken).
The pair could continue to move up toward the $48,000 level unless there is a close below $45,000.

Bitcoin Price Faces Rejection

Bitcoin price started a fresh increase above the $45,500 resistance zone. BTC gained bullish momentum above the $46,000 and $46,500 levels after the hacked SEC account tweet about the ETF approval.

After clarification, there was a sharp rejection near the $48,000 zone. A high was formed near $47,988 before the price started a fresh decline. There was a move below the $47,000 and $46,500 levels. The price dived toward the $45,000 support.

A low was formed near $44,828 and the price is now rising. It is back above the 23.6% Fib retracement level of the recent decline from the $47,988 swing high to the $44,828 low.

Bitcoin is now trading above $45,500 and the 100 hourly Simple moving average. There is also a major contracting triangle forming with resistance near $46,800 on the hourly chart of the BTC/USD pair. On the upside, immediate resistance is near the $465,400 level. It is near the 50% Fib retracement level of the recent decline from the $47,988 swing high to the $44,828 low.

Source: BTCUSD on TradingView.com

The first major resistance is $46,800. A clear move above the $46,800 resistance could send the price toward the $47,200 resistance. The next resistance is now forming near the $48,000 level. A close above the $48,000 level could send the price further higher. The next major resistance sits at $49,250.

More Losses In BTC?

If Bitcoin fails to rise above the $46,800 resistance zone, it could start a fresh decline. Immediate support on the downside is near the $45,550 level.

The next major support is $45,200. If there is a move below $45,200, the price could gain bearish momentum. In the stated case, the price could drop toward the $44,800 support in the near term.

Technical indicators:

Hourly MACD – The MACD is now losing pace in the bearish zone.

Hourly RSI (Relative Strength Index) – The RSI for BTC/USD is now below the 50 level.

Major Support Levels – $45,500, followed by $45,200.

Major Resistance Levels – $46,400, $46,800, and $47,200.

Read More