
UNI Price Prediction – Uniswap Momentum Reignites, 15% Lift-off Possible
UNI price is moving higher from the $5.65 support. Uniswap is up 5% and it seems like the bulls could aim a fresh surge toward the $8.00 zone.
UNI started a fresh increase above the $6.00 and $6.20 resistance levels.
The price is trading above $6.50 and the 100 simple moving average (4 hours).
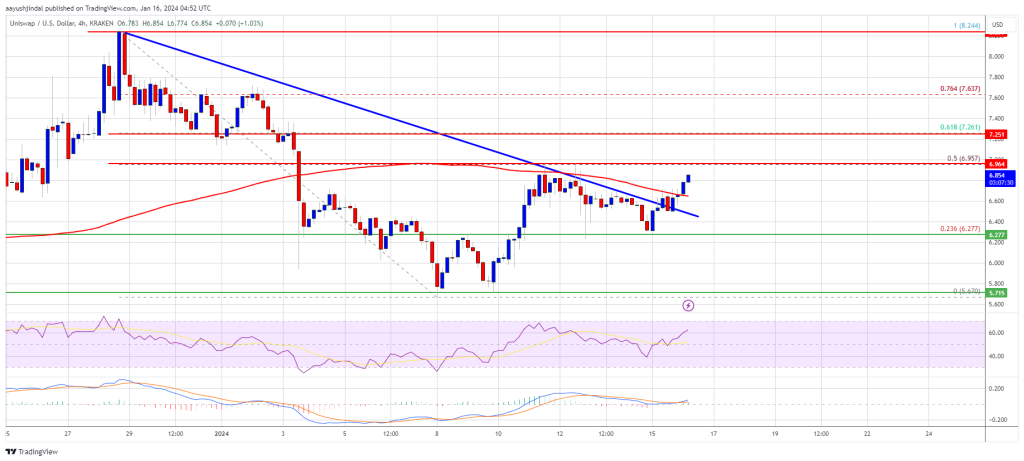
There was a break above a key bearish trend line with resistance near $6.60 on the 4-hour chart of the UNI/USD pair (data source from Kraken).
The pair is showing bullish signs and might rally if it clears the $7.25 resistance.
UNI Price Aims Higher
After forming a support base above $5.65, UNI started a fresh increase. The bulls were able to push Uniswap’s price above the $6.00 and $6.20 resistance levels, outperforming Bitcoin and Ethereum.
There was a break above a key bearish trend line with resistance near $6.60 on the 4-hour chart of the UNI/USD pair. The pair even cleared the $6.75 resistance level. It is now approaching the 50% Fib retracement level of the downward move from the $8.24 swing high to the $5.67 low.
UNI is now trading above $6.50 and the 100 simple moving average (4 hours). Immediate resistance on the upside is near the $6.95 level. The next key resistance is near the $7.250 level. It is close to the 61.8% Fib retracement level of the downward move from the $8.24 swing high to the $5.67 low.
Source: UNIUSD on TradingView.com
A close above the $7.25 level could open the doors for more gains in the near term. The next key resistance could be near $7.65, above which the bulls are likely to aim a test of the $8.00 level. Any more gains might send UNI toward $8.25.
Dips Supported in Uniswap?
If UNI price fails to climb above $6.95 or $7.25, it could correct further lower. The first major support is near the $6.60 level or the 100 simple moving average (4 hours).
The next major support is near the $6.25 level. A downside break below the $6.25 support might open the doors for a push toward $6.00.
Technical Indicators
4-Hours MACD – The MACD for UNI/USD is gaining momentum in the bullish zone.
4-Hours RSI (Relative Strength Index) – The RSI for UNI/USD is well above the 50 level.
Major Support Levels – $6.60, $6.25 and $6.00.
Major Resistance Levels – $6.95, $7.25 and $8.00.
Read More


