Crypto Corner Café

Taste The Future

Blockchain

Blockchain

XRP Price Uptrend To Continue? These Could Be The Factors To Watch

XRP price is consolidating above the $0.5400 support. The price could start a fresh rally if there is a clear move above the $0.600 resistance.

XRP is struggling to clear the $0.588 and $0.600 resistance levels.
The price is now trading below $0.5920 and the 100 simple moving average (4 hours).
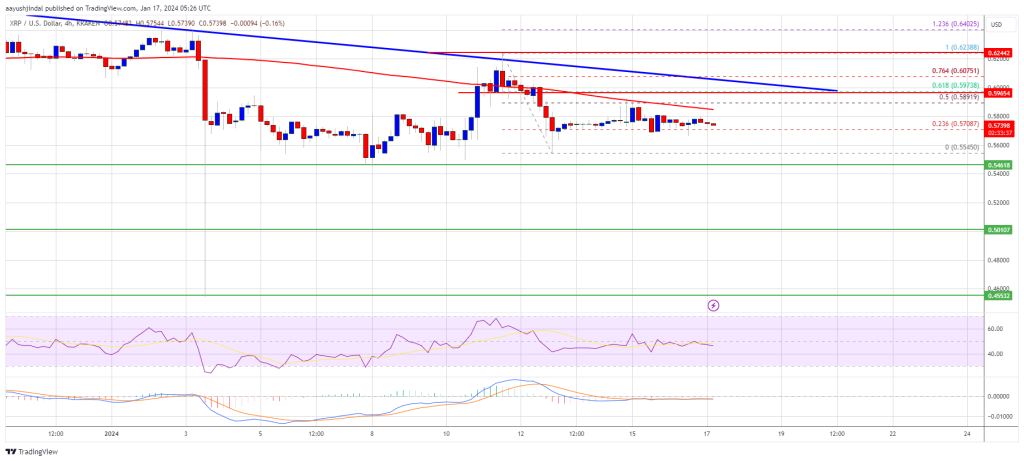
There is a major bearish trend line forming with resistance near $0.600 on the 4-hour chart of the XRP/USD pair (data source from Kraken).
The pair start a fresh rally if it clears the $0.588 and $0.600 resistance levels.

XRP Price Aims Higher

After a decent recovery wave, XRP price was able to settle above the $0.5640 pivot level. A base was formed near $0.5460, and the price started a consolidation phase, unlike Bitcoin and Ethereum.

There was a minor increase above the $0.570 resistance zone. However, the bears seem to be active near the $0.5880 resistance zone. It faced a rejection near the 50% Fib retracement level of the recent decline from the $0.6238 swing high to the $0.5545 low.

The price is now trading below $0.5920 and the 100 simple moving average (4 hours). On the upside, immediate resistance is near the $0.588 zone.

The first key resistance is near $0.600. There is also a major bearish trend line forming with resistance near $0.600 on the 4-hour chart of the XRP/USD pair. The trend line is near the 61.8% Fib retracement level of the recent decline from the $0.6238 swing high to the $0.5545 low.

Source: XRPUSD on TradingView.com

A close above the $0.600 resistance zone could spark a strong increase. The next key resistance is near $0.625. If the bulls remain in action above the $0.625 resistance level, there could be a rally toward the $0.665 resistance. Any more gains might send the price toward the $0.700 resistance.

Downside Break?

If XRP fails to clear the $0.600 resistance zone, it could start a fresh decline. Initial support on the downside is near the $0.5450 zone.

The next major support is at $0.5220. If there is a downside break and a close below the $0.5220 level, XRP price might accelerate lower. In the stated case, the price could retest the $0.4850 support zone.

Technical Indicators

4-Hours MACD – The MACD for XRP/USD is now losing pace in the bullish zone.

4-Hours RSI (Relative Strength Index) – The RSI for XRP/USD is now below the 50 level.

Major Support Levels – $0.5450, $0.5220, and $0.4850.

Major Resistance Levels – $0.5880, $0.600, and $0.6250.

Read More
Blockchain

Ethereum Price Grinds Higher, Is This The Start Bulls Were Waiting For?

Ethereum price is attempting a fresh increase above the $2,550 level. ETH could continue to move up unless there is a drop below the $2,525 support.

Ethereum is attempting a fresh increase above the $2,520 level.
The price is trading above $2,520 and the 100-hourly Simple Moving Average.
There is a connecting bullish trend line forming with support at $2,540 on the hourly chart of ETH/USD (data feed via Kraken).
The pair could continue to move up if it clears the $2,600 and $2,620 resistance levels.

Ethereum Price Holds Support

Ethereum price remained well-supported above the $2,450 level. ETH outperformed Bitcoin and started a fresh increase above the $2,500 resistance zone.

There was a move above the $2,550 resistance and the 100-hourly Simple Moving Average. The price even broke the $2,600 level before the bears appeared. A high is formed near $2,614 and the price is now correcting gains. There was a minor move below the 23.6% Fib retracement level of the upward move from the $2,471 swing low to the $2,614 high.

Ethereum is still trading above $2,520 and the 100-hourly Simple Moving Average. There is also a connecting bullish trend line forming with support at $2,540 on the hourly chart of ETH/USD. It is close to the 50% Fib retracement level of the upward move from the $2,471 swing low to the $2,614 high.

On the upside, the price is facing resistance near the $2,600 level. The next major resistance is now near $2,620. A clear move above the $2,620 level might start a decent increase. In the stated case, the price could rise toward the $2,665 level.

Source: ETHUSD on TradingView.com

The main breakout zone is now forming near the $2,710 zone. A close above the $2,710 resistance could start another major increase. The next key resistance is near $2,780. Any more gains might send the price toward the $2,880 zone.

Fresh Decline in ETH?

If Ethereum fails to clear the $2,620 resistance, it could start another decline. Initial support on the downside is near the $2,550 level and the trend line.

The next key support could be the $2,500 zone. A downside break below the $2,500 support might send the price further lower. In the stated case, Ether could test the $2,450 support. Any more losses might send the price toward the $2,350 level.

Technical Indicators

Hourly MACDThe MACD for ETH/USD is losing momentum in the bullish zone.

Hourly RSIThe RSI for ETH/USD is now above the 50 level.

Major Support Level – $2,540

Major Resistance Level – $2,620

Read More
Blockchain

Bitcoin Price Signals Recovery But The Bears Are Not Out of Woods Yet

Bitcoin price is still struggling below the $43,500 resistance zone. BTC could start a recovery wave if there is a clear move above the $44,000 resistance zone.

Bitcoin price started a consolidation phase from the $41,500 zone.
The price is trading above $42,500 and the 100 hourly Simple moving average.
There is a key rising channel forming with resistance near $44,000 on the hourly chart of the BTC/USD pair (data feed from Kraken).
The pair could start a decent recovery wave if there is a move above the $44,000 resistance zone.

Bitcoin Price Faces Hurdles

Bitcoin price found support near the $41,500 zone and recently started a consolidation phase. BTC was able to recover a few points above the $42,000 and $42,200 levels.

The price even spiked above the 23.6% Fib retracement level of the main decline from the $49,000 swing high to the $41,475 low. There is also a key rising channel forming with resistance near $44,000 on the hourly chart of the BTC/USD pair.

Bitcoin is now trading above $42,500 and the 100 hourly Simple moving average. If the bulls remain in action, the price might recover above the $43,250 resistance. The first major resistance is $44,000 or the channel trend line.

Source: BTCUSD on TradingView.com

A clear move above the $44,000 resistance could send the price toward the $44,450 resistance. The next resistance is now forming near the $45,250 level. It is near the 50% Fib retracement level of the main decline from the $49,000 swing high to the $41,475 low. A close above the $45,250 level could push the price further higher. The next major resistance sits at $47,000.

Another Decline In BTC?

If Bitcoin fails to rise above the $44,000 resistance zone, it could start a fresh decline. Immediate support on the downside is near the $42,800 level or the 100 hourly Simple moving average.

The next major support is $42,120. If there is a close below $42,120, the price could gain bearish momentum. In the stated case, the price could drop toward the $41,500 support in the near term.

Technical indicators:

Hourly MACD – The MACD is now losing pace in the bearish zone.

Hourly RSI (Relative Strength Index) – The RSI for BTC/USD is now above the 50 level.

Major Support Levels – $42,800, followed by $42,120.

Major Resistance Levels – $43,250, $44,000, and $44,450.

Read More
Blockchain

Crypto Think Tank Rebels Against This US Senator, Here’s Why

On December 18, 2023, US Senator Elizabeth Warren sent three letters to the Coin Center Director Jerry Brito, Blockchain Association CEO Kristin Smith, and crypto exchange Coinbase. The senator set January 14, 2024, as the deadline for a response to her inquiries.

In the letter addressed to Brito, Senator Warren voiced her concern over reports that his organization and “other crypto interests” were “flexing a not-so-secret weapon” by amassing what she considers a “small army” of former ex-government officials.

A “Patriotic” Response To “Unconstitutional” Demands, Crypto Think Tank Firesback

Coin Center, a non-profit think tank focusing on the policy issues faced by the crypto industry, sent the US Senator a response letter on January 15. The organization stated:

With respect, we have no obligation to answer these questions beyond the public disclosures we make under the law.

Coin Center affirms that it takes constitutional rights seriously and considers that “free speech and petitioning the government are fundamental rights protected by our constitution,” Warren’s letter “discourages participation in important public policy debates and chills these rights.”

Regarding its opposition to legislative proposals, such as the CANSEE Act and the Digital Asset Anti-Money Laundering Act, the letter cited Coin Center’s belief that they are “unfair, unworkable, and most importantly, unconstitutional” efforts, as well as a “waste” of time and energy that could be spent on reinforcing existing laws.

The organization believes that its “proper” and “patriotic” opposition to these legislative efforts for “unconstitutional and draconian” surveillance is being mistaken as “political bias” by the US Senator.

Coin Center: “The Abuse Of The Revolving Door”

Warren’s letter highlighted the “gaps” that allow former government officials to leave their positions and “cash in and go to work as lobbyists or advisers for private-sector industries with a keen interest in federal policy.”

The Senator inquired Coin Center’s Head about this gap, asking Brito to provide a list of former government officials employed by the crypto think tank and details about their responsibilities, economic compensation, and whether they had been contacted about employment before leaving their former position.

Per the list and details of former government officials currently employed by Coin Center, the organization “politely declines” to offer further answers but is open to a conversation with Senator Warren.

We welcome honest, respectful policy discussions and are happy to meet with you or your staff to discuss further.

Coin Center criticizes the senator for the existence of said gap, noting that “if a gap exists, it is in enforcement”, and calls out the lack of effort on “securing more funding for FinCEN, the FBI and DOJ’s crypto enforcement units, and the like.”

The organization affirms that its efforts to find solutions and support sound regulation for cryptocurrency businesses will continue, including Congress’ effort to address the role that cryptocurrencies play in financing terrorist organizations, as Coin Center believes that sound policymaking is only possible when “diverse voices and perspectives are welcome and engaged.”

The Coin Center Executive Director concluded:

As for bipartisanship, we are proud of the work we have done to find solutions that advance sound regulation for cryptocurrency businesses while preserving the freedom to innovate.

Read More
Blockchain

Grayscale Transfers Almost 12,000 BTC To Coinbase, Bitcoin Price Reacts

In a significant development that could potentially impact the Bitcoin price, Arkham Intelligence data reveals that Grayscale, the manager and owner of the Grayscale Bitcoin Trust (GBTC), has been sending a significant amount of Bitcoin to Coinbase since the launch of Bitcoin spot exchange-traded funds (ETFs) on January 12.

Grayscale Bitcoin Trust Initiates Substantial BTC Outflow

According to the data, four days ago, Grayscale initiated the first batch of BTC outflows from their holdings to the US-based exchange in four separate batches, totaling 4,000 BTC, which amounted to approximately $183 million. However, the asset manager resumed outflows from the Trust to the exchange on Tuesday.

In a recent update, approximately three hours ago, the asset manager sent an additional 11,700 BTC to Coinbase, amounting to $491.4 million. This additional selling pressure could push the Bitcoin price to test lower support levels.

Furthermore, Bloomberg reports that investors have withdrawn over half a billion dollars from the Grayscale Bitcoin Trust during the initial days of trading as an ETF. 

According to Bloomberg’s data, outflows from the Grayscale Bitcoin Trust reached approximately $579 million, while the other nine spot Bitcoin ETFs witnessed inflows totaling nearly $819 million.

Investors Shift Capital To ‘Lower-Cost’ Spot Bitcoin ETFs

James Seyffart, an ETF analyst at Bloomberg Intelligence, noted that investors may be profit-taking following the ETF conversion. The flow data provides valuable insights into the ETF’s performance following SEC approval. 

Although over $2.3 billion of GBTC shares were traded on its first day, the outflows indicate that a portion of that volume was due to selling. Seyffart anticipates that a significant amount of capital will enter other Bitcoin exposures.

The outflows from Grayscale’s ETF were somewhat expected. Bloomberg Intelligence had previously projected that the fund would experience outflows of over $1 billion in the coming weeks. 

Some of this outflow can be attributed to investors shifting towards more cost-effective spot Bitcoin ETFs. With an expense ratio of 1.5%, GBTC is the most expensive US ETF directly investing in Bitcoin. In contrast, the VanEck Bitcoin Trust, the second-most expensive fund, charges 0.25%.

On the other hand, other spot Bitcoin ETFs have witnessed net inflows. BlackRock’s IBIT attracted nearly $500 million in the first two days of trading, while Fidelity’s FBTC received approximately $421 million. 

According to Bloomberg, these inflows suggest strong demand for Bitcoin exposure in physically backed ETFs, even beyond potential seed funding from the fund issuers.

Bitcoin Price Finds Support At $42,000

Currently, the Bitcoin price remains unaffected by the news of Grayscale’s transfers to Coinbase. The leading cryptocurrency is trading at $43,100, showing a slight increase of 0.8% over the past 24 hours.

However, since the commencement of ETF trading, it is important to note that the Bitcoin price has experienced a significant retracement, declining by 8%. This decline can be attributed to profit-taking and selling pressure, with Grayscale’s involvement being noteworthy.

In the event of a further drop in the Bitcoin price, a significant support level has been established at $42,000. If this level is breached, the next key level for Bitcoin bulls to watch is $41,350, followed by a potential dip below $40,000.

The market is eagerly observing whether Grayscale and its BTC selloff will continue and how this will impact the Bitcoin price leading up to the scheduled halving event in April, which many consider to be the main catalyst for the year.

Featured image from Shutterstock, chart from TradingView.com 

Read More
Blockchain

PlanB’s Market Cycle Analysis: Bitcoin Gears Up For Skyrocketing Beyond $100,000

In a recent post that echoes his previous analysis, the renowned Stock-2-Flow (S2F) model creator, PlanB, highlighted a pivotal phase transition in the Bitcoin market. However, it may remain unrecognized by many.

Reflecting on his analysis from January of the previous year, PlanB recalled his declaration that the bear market phase had ended and an accumulation phase had commenced. Despite this, many at the time were still anticipating a fall to a Bitcoin price of $10,000.

Consequently, even as the analyst’s model signals a phase transition for Bitcoin, skepticism may still cloud the perception of many in the market.

Bitcoin Enters A Phase Transition, Poised For Rally

Despite the market movement, PlanB’s Bitcoin Market Cycle Model chart indicates that the flagship cryptocurrency has been in an accumulation stage. This critical period of consolidation began in early January last year, according to PlanB, aligning with the analyst’s earlier assertion that the bear market had concluded at that time.

The accumulation phase is typically marked by increased buying activity, often by long-term investors or ‘whales,’ laying the groundwork for future price surges.

PlanB’s analysis, shared earlier last year, suggests that Bitcoin had bottomed out in November 2022, with a low of $15,500. The analyst posits that the trajectory for Bitcoin is set for substantial growth leading up to the 2024 halving and the ensuing bull market in 2025.

The best thing about this bitcoin market cycle model is that only a few will believe it when it detects a phase transition. For example, when I tweeted on Jan 12 that the bear market (green) was over and the accumulation phase (blue) had begun, many were still calling for 10k. https://t.co/V74Y8VYCVo pic.twitter.com/l2uuFaVr14

— PlanB (@100trillionUSD) January 16, 2024

PlanB forecasted in the post shared last January that Bitcoin’s value would trade above $32,000 post-halving and even reach or surpass the $100,000 mark in the bull market in 2025.

Further Surge Ahead

The bullish sentiment is further echoed by PlanB’s recent predictions, including a pre-halving surge, a rally following the approval of spot Bitcoin exchange-traded funds (ETFs), and a monumental peak anticipated in the coming years.

His YouTube video outlines a short-term forecast of Bitcoin soaring beyond $50,000 leading up to the April halving.

Peering into the future, the creator of the S2F model, PlanB, anticipates that BTC will surpass its previous highest value, potentially achieving a price point of $100,000 within the year. This forecast further gains credibility with the recent approval of spot Bitcoin ETFs in the United States by the US Securities and Exchange Commission (SEC).

PlanB’s long-term vision for Bitcoin is even more audacious, projecting a climb to $532,000 by 2025. This forecast is underpinned by the analyst’s Stock-to-Flow (S2F) model.

I expect $55k bitcoin at halving, $100k in 2024, $532k in 2025:https://t.co/TSo7TpNfzb pic.twitter.com/mQaXM5Qabb

— PlanB (@100trillionUSD) January 10, 2024

The model suggests a future where BTC transcends its current status to become a dominant digital store of value, potentially reshaping the traditional financial landscape.

Featured image from Unsplash, Chart from TradingView

Read More
Blockchain

Analyst Predicts Cardano Future Using Historic Trends, And It’s Very Bullish

A crypto analyst has provided insights into why this year will be “massive” for Cardano (ADA) based on historical data. The analyst also highlighted how patience was key, as ADA could replicate a similar run like the one it did when it saw a gain of 8,288% following about two years of consolidation. 

2024 Could Be Another Breakout Year For Cardano

In a recent video, the analyst behind the Crypto ZX YouTube channel alluded to ADA’s history as he provided a bullish narrative for the crypto token in this new year. He spoke about how Cardano launched at the peak of the 2018 bull market but didn’t make any significant gains until two years later. 

ADA is said to have broken below the $0.11 support months after its launch and ranged within that time frame from around August 2018 to June 2020. After that, things began to pick up for the crypto token as it went up by 8,288% on its way to hitting its all-time of $3 in 2021.

Based on this, the analyst urged ADA investors to be patient as he expects ADA to break out anytime soon and enjoy a parabolic move. He warned these investors against being like those who currently have regrets about not holding when ADA was at its lowest, considering that some of those who held made millions. 

One Last Chance To Accumulate Before The Next Bull Run

The Crypto ZX analyst mentioned that the bear market cycle ends at the 78.6 Fibonacci retracement level. However, he noted that ADA is currently struggling to break that level as the selling pressure around that range is huge, and there is not enough demand for ADA. Going by previous cycles, he stated that “explosions” could come by May or June.

In his opinion, though, he believes that Cardano could get to that Fibonacci level before those months. However, he doesn’t expect “massive moves” until May at least. With this in mind and the fact that there could be another “shake-off” before Bitcoin Halving, the analyst believes this is a great opportunity to accumulate as many ADA tokens as possible. 

Meanwhile, the “exciting times” will be in the third and fourth quarter of the year, as that is where this crypto analyst is personally targeting (possibly to take profits). He also predicted that this bull market would be the biggest of all time as he believes that other cryptocurrencies, including Cardano, could get their Spot ETF

At the time of writing, ADA is trading at around $0.532, down in the last 24 hours, according to data from CoinMarketCap. 

Read More
Blockchain

Bitcoin Has Large Resistance Wall Ahead: Here’s The Level To Watch

On-chain data suggests Bitcoin has a large wall of resistance ahead of it currently. Here are the exact levels that make up this important range.

A Large Amount Of Bitcoin Supply Was Purchased Between $42,700 & $44,000

According to data from the market intelligence platform IntoTheBlock, BTC is sitting just below a significant on-chain resistance zone. In on-chain analysis, the strength of any resistance or support level is defined based on the number of coins acquired by the investors there.

To any holder, their cost basis is naturally an important level; thus, they may be more prone to make some moves whenever the cryptocurrency’s spot price retests their profit-loss boundary.

How the investors might react to such a retest can change depending on the direction of the retest. Holders at a loss can sometimes be desperate to exit the market, so if the price retests their cost basis (that is, the retest is happening from below), they might sell to at least be able to get back their investment.

Such selling can provide resistance to the price. Only a few investors making such moves may not be relevant to the broader market. Still, if a significant number of traders acquired a large amount of BTC inside a narrow range, the reaction produced by a retest could be sizeable.

On the other hand, investors who were in profit before the retest may look at dips in their cost basis as an opportunity to accumulate more, thinking that the price would go up again. This buying, when large enough, can support the asset.

Now, here is a chart that shows how the various Bitcoin price ranges look like right now in terms of the amount of BTC that was acquired at them:

As is apparent from the graph, the $42,700 to $44,000 range hosts the cost basis of 2.68 million addresses, which acquired a total of 1.02 million BTC inside it. The average price of this range is around $43,400, which is above the current spot price of the cryptocurrency.

“Uncertainty can cause these holders to sell into their break-even point, increasing resistance in a move up,” explains the analytics firm. If Bitcoin can break through this resistance, though, it may have an easier time exploring higher levels, as it offers less resistance.

The chart shows that below the current spot price is the substantial $41,400 to $42,700 support range, which has helped cushion Bitcoin’s fall during the recent correction. Thus, even if the resistance zone rejects BTC, this support area may at least help it return for another go.

BTC Price

At the time of writing, Bitcoin is trading around the $43,200 level, down 8% in the past week.

Read More
Blockchain

Cantor CEO Makes Gold And Bitcoin ETFs Comparison, Foresees True Rally With Halving

In a highly anticipated development, the United States Securities and Exchange Commission (SEC) granted regulatory approval for 11 spot Bitcoin ETFs, sparking excitement within the crypto community. 

However, despite initial expectations of a significant price surge, the Bitcoin market has experienced an 8% price drop since the ETFs began trading.

Bitcoin ETFs To Unfold Impact Over Time? 

Drawing a comparison with the launch of the first Gold ETF, Cantor Fitzgerald Asset Management CEO, Howard Lutnick, noted that the immediate rush to buy the asset did not materialize.

Lutnick remarks that historical data from the launch of the Gold ETF, SPDR Gold Shares (GLD), reveals that substantial price appreciation took place over several years. 

When GLD was introduced in November 2004, the price of gold stood at around $700. By December 2023, it had surged to an all-time high of $2,145. The gold market capitalization, estimated at $1 trillion to $2 trillion pre-ETF approval, ballooned to $16 trillion within a few years.

Likewise, despite the initial hype surrounding the spot Bitcoin ETFs, experts suggest that the true impact of these ETFs will unfold over an extended period. 

As reported by NewsBTC, market analysts at CoinShares estimate that the United States possesses around $14.4 trillion in addressable assets. 

Assuming a conservative scenario where 10% of these assets invest in a spot Bitcoin ETF with an average allocation of 1%, it could potentially result in approximately $14.4 billion inflows within the first year.

These significant inflows have the potential to propel the Bitcoin price to new highs and initiate a notable price uptrend. However, as Cantor CEO Howard Lutnick predicted, the halving event, expected to occur in April, remains the primary catalyst for Bitcoin’s growth.

Dual Catalysts For Crypto Market Enthusiasm

As the Bitcoin halving event approaches, analysis of past halvings reveals a pattern of substantial rallies leading up to the event, followed by a brief correction and consolidation period before a major bull run and peak. The peak typically occurs approximately 18 months after each halving, showcasing a consistent trend.

The first halving occurred on November 28, 2012, reducing the block reward from 50 BTC to 25 BTC. At the time of the halving, the Bitcoin price was around $13. 

However, within a year, it reached a peak of $1,152. Despite a subsequent fall in price to nearly $200 in 2015, critics declared the bursting of a bubble and the demise of Bitcoin. Yet, this trend would repeat in subsequent halving cycles.

The second halving occurred on July 16, 2016, reducing the block reward to 12.5 BTC. At the time, Bitcoin was valued at $664. 

The following year saw a peak of $17,760. Similarly, the third halving occurred on May 11, 2020, lowering the block reward to 6.25 BTC. Bitcoin was priced at $9,734 during the halving and peaked at $69,000 the following year.

Based on the historical cycles, it is evident that the upcoming halving scheduled for April 2024 will be a significant catalyst for Bitcoin. However, it is important to note that Bitcoin ETFs will also play a crucial role. 

These ETFs are expected to positively impact the cryptocurrency’s price and bring new inflows and interest to the crypto market.

Featured image from Shutterstock, chart from TradingView.com 

Read More
Blockchain

Crypto Community Raises Alarm Over Coinbase’s Dominance Of Bitcoin Held In Spot ETFs

Coinbase, the largest cryptocurrency exchange in the United States, is presently serving as the custodian of the majority of the Spot Bitcoin ETFs managed by various asset management companies in the industry. This notable concentration is raising worries in the crypto community about significant centralization and potential risks associated with the custodianship. 

Coinbase Dominate ETFs As Major Custodian

Coinbase’s significant role in the advancement of Spot Bitcoin ETFs has become a target of scrutiny in the crypto community. The American crypto exchange is currently the custodian of 9 out of 11 Spot Bitcoin ETF companies, including BlackRock, Grayscale, Ark/21 Shares, Bitwise, WisdomTree, Invesco/Galaxy, Valkyrie, GlobalX, and Franklin Templeton. 

Notably, only Fidelity and VanEck have opted for alternative custodianship approaches. Fidelity is employing a self-custody program for its Spot Bitcoin ETF, while VanEck has selected Gemini, a crypto exchange, as the custodian for its Spot BTC ETF. 

The prominent role of Coinbase as the major custodian for Spot BTC ETFs has raised serious questions and concerns in the crypto community. Specifically, Gabor Gurbacs, Director of Digital Assets Strategy at VanEck, has deemed Coinbase’s concentrated level of custodianship to be a “double-edged sword.” 

Gurbacs stated that Coinbase would bear substantial responsibility as the primary custodian for Spot Bitcoin ETFs and would reap significant benefits from it. However, he also hinted at potential counterparty risks associated with concentrating assets within a single entity. 

Similarly, a crypto analyst on X (formerly Twitter) highlighted the potential for increased scrutiny from the United States Securities and Exchange Commission (SEC) regarding Coinbase, given its prominent position in the Spot Bitcoin ETF market. The crypto exchange is presently in a legal battle with the SEC, and many crypto enthusiasts believe that Coinbase’s regulatory challenges may pose a threat to the success of Spot BTC ETFs. 

Coinbase CFO Bullish On Bitcoin ETFs

The Chief Financial Officer of Coinbase, Alesia Haas appeared recently in an interview on Bloomberg TV, discussing the effects of Spot Bitcoin ETFs in the crypto market. 

When asked if the momentum of Spot Bitcoin ETFs would become a “game-changer” in the future, Haas responded confidently with a resounding “absolutely.”

The Coinbase CFO declared that the SEC’s approval of Spot Bitcoin ETFs was an important day for crypto, as it positions Bitcoin into a much broader investable asset class. She also revealed that the deployment of Spot Bitcoin ETFs would allow investors to have greater access to BTC products, extending its reach to billions of people around the globe and increasing the amount of inflows into ETFs. 

Read More