Crypto Corner Café

Taste The Future

Blockchain

Blockchain

Bitcoin Price Faces Uphill Task, Risk of Additional Losses Below $42K Looms

Bitcoin price is still struggling below the $43,250 resistance zone. BTC remains at risk of more downsides if it stays below $43,500 for a long time.

Bitcoin price is still trading in a range from the $41,500 zone.
The price is trading below $43,250 and the 100 hourly Simple moving average.
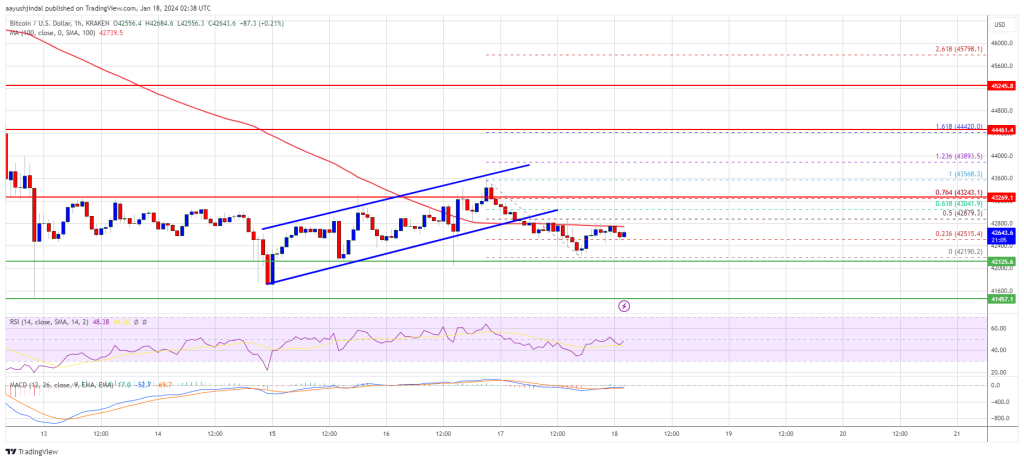
There was a break below a key rising channel with support near $42,880 on the hourly chart of the BTC/USD pair (data feed from Kraken).
The pair is now at risk of more downsides below the $41,500 support zone.

Bitcoin Price Turns Red

Bitcoin price started a consolidation phase from the $41,500 zone. BTC recovered a few points, but the bears were active near the $43,250 and $43,500 levels.

The last swing high was near $43,568 before the price started a fresh decline. There was a clear move below the $43,000 level. Besides, there was a break below a key rising channel with support near $42,880 on the hourly chart of the BTC/USD pair.

Bitcoin is now trading below $43,250 and the 100 hourly Simple moving average. It is again attempting a recovery wave above the $42,500 level.

On the upside, the price is facing resistance near the $42,800 level. It is close to the 50% Fib retracement level of the recent decline from the $43,568 swing high to the $42,190 low. The first major resistance is $43,000. The main resistance is now forming near the $43,250 level.

Source: BTCUSD on TradingView.com

The 76.4% Fib retracement level of the recent decline from the $43,568 swing high to the $42,190 low is also near $43,250. A clear move above the $43,250 resistance could send the price toward the $44,000 resistance. The next resistance is now forming near the $44,250 level. A close above the $44,250 level could push the price further higher. The next major resistance sits at $45,000.

More Losses In BTC?

If Bitcoin fails to rise above the $43,250 resistance zone, it could start a fresh decline. Immediate support on the downside is near the $42,120 level.

The next major support is $41,450. If there is a close below $41,450, the price could gain bearish momentum. In the stated case, the price could drop toward the $40,000 support in the near term.

Technical indicators:

Hourly MACD – The MACD is now gaining pace in the bearish zone.

Hourly RSI (Relative Strength Index) – The RSI for BTC/USD is now below the 50 level.

Major Support Levels – $42,120, followed by $41,450.

Major Resistance Levels – $43,000, $43,250, and $44,000.

Read More
Blockchain

Crypto Exchanges Trading Volume Hit $10.3T in 2023, New Data Shows

CoinGecko’s 2023 Annual Crypto Industry Report has been released. It covers crypto exchanges and their current state, Bitcoin’s +155.2% and Ethereum’s +90.5% growth, analyzing NFT trading volume throughout the year, and more.

Among the report’s highlights is the comprehensive review of the crypto trading volume in 2023 through the performance of centralized crypto exchanges (CEX) and decentralized exchanges (DEX).

Centralized Crypto Exchanges Dominated

Crypto saw a $36.6 trillion trading volume in 2023, with a volume increase of +53.1% from Q3 ($6.7 trillion) to Q4 ($10.3 T). The Q4 increase marked the first quarter-on-quarter (QoQ) growth of 2023 and could be attributed to the “growing bullish sentiment” in the crypto market due to the anticipation of spot Bitcoin ETFs’ approval by the SEC.

Despite the market’s challenges, such as the aftermath of FTX’s collapse, the worldwide banking crisis, or Binance’s regulatory difficulties in 2023, the data presented in the report shows an overall market recovery.

In December 2023, the trading volume increased sharply to $4.3 trillion, a volume not seen since March 2023. Overall 2023, centralized exchanges dominated the year despite the challenges, especially when compared to decentralized exchanges (DEX). The report details:

CEXto DEX spot trading volume ratio hovered around 91.5% in Q4.
CEX to DEX derivatives trading volume ratio dropped to 97.3% from 98.5%.
CEX to DEX spot ratio stood at 91.4% in 2023.
CEX to DEX derivatives ratio was 98.1% in 2023.

Binance, Upbit, OKX, Bybit, and Coinbase are among the Top 10 centralized exchanges by trading volume. Binance managed to dominate the list despite dropping to a yearly low market share of 41% in November, following a continued loss throughout 2023.

There was a +98.1% increase QoQ, after the top 10 CEXes recorded $2.20 trillion in spot trading volume in 2023 Q4. Previously, the trading volume had failed to reach above $2 trillion for two consecutive quarters.

Altogether, the top 10 CEXes recorded $7.2 trillion in spot trading volume in 2023 compared to $9.4 trillion in 2022, representing a -23.4% year-on-year (YoY) decline.

Deep Dive Into The Spot Decentralized Exchanges (DEX) Trading Volume In 2023

The Top 10 DEXes recorded $205.3 billion in spot trading volume in 2023 Q4, indicating a +87.1% Total Trading Volume Increase QoQ. Uniswap, Pancakeswap, Orca, Curve, and THORSwap dominate the DEXes in 2023’s Top 10 spot DEX trading volume.

Notably, the report names Orca and THORSwap as the biggest gainers amongst the DEXes in 2023 Q4, with Orca increasing 1,079% ($12.2 billion), while THORSwap saw a surge of 422.4% ($10.1 billion)

When breaking down the 2023 spot DEX trading volume breakdown by chain, the report details that Ethereum had $99.3 billion of DEX trading volume in 2023 Q4, displaying an increase of +38.3% from 2023 Q3. However, it ended with a low 41% dominance, dropping below 50% for the first time in 2023 in November and December.

It’s worth noting that Solana was the biggest gainer, with a 985.5% increase in QoQ, while THORChain took second place with a 422.4% trading volume increase in Q4. The data shows that the two chains ranked #3 and #5 in December 2023.

Read More
Blockchain

BNB Quarterly Burning: Over 2 Million Tokens Vanish, Valued At $636 Million

In a recent announcement by Binance, the BNB Foundation declared the successful completion of the 26th quarterly Binance Coin token burn through the BNB Chain. The burn, which included Auto-Burn and the Pioneer Burn Program, eliminated a significant amount of the exchange’s native token from circulation. 

BEP95 Initiative Results In 210K BNB Permanently Burned

During this latest burn event, the Auto-Burn process removed 2,141,487.27 BNB from circulation, equivalent to approximately $636 million in USD. 

It is worth noting that the Auto-Burn mechanism operates independently of Binance’s centralized exchange (CEX), providing an auditable and objective process, according to the exchange’s statement. 

Additionally, the Pioneer Burn Program contributed by removing 1542.15 tokens from circulation. This program permanently eliminates an amount of BNB equal to the provable lost funds of eligible users. 

Since the introduction of BEP95, an estimated 210,000 tokens have been permanently burned under this mechanism. As announced, the Pioneer Burn Program helps maintain the integrity of the ecosystem and ensures that lost funds do not influence the circulating supply.

Furthermore, BNB Chain’s Real-Time-Burn mechanism continuously reduces the token supply. This mechanism enables burning a portion of BNB Chain’s gas fees in real-time, further contributing to the ongoing supply reduction efforts.

Completing the 26th quarterly BNB token burn marks another significant milestone for the BNB ecosystem. The independent Auto-Burn mechanism, combined with the Pioneer Burn Program and Real-Time-Burn mechanism, showcases BNB Chain’s approach to reducing token supply and fostering long-term value. 

Robust User Adoption

In addition to its quarterly token burn, BNB has recently displayed notable strength and progress, as revealed by Token Terminal’s on-chain data

With a circulating market cap of $47.86 billion, BNB Chain has experienced a 30.45% increase in market capitalization. This surge in value reflects the growing confidence and demand for the token among investors. 

BNB Chain’s financial metrics are equally impressive. The platform has witnessed a revenue growth of 30.47% over the past 30 days, generating $1.72 million in revenue during this period, as seen in the chart below. 

Extrapolating this data to an annualized basis, the chain’s revenue is noteworthy at $20.96 million, reflecting solid financial stability and sustainable growth.

The data from Token Terminal also highlights BNB Chain’s increasing user adoption and developer activity. The platform has seen a surge in active daily users, with a 30-day average of 1.42 million, representing a robust 48.6% growth. 

The Binance Coin price performance has been steady, with a 2.14% decrease over the past 24 hours, while showing a positive trend over more extended periods. 

The token recorded a 4.38% increase in the past seven days, and over the past 30 days, it achieved an impressive growth of 30.51%. Furthermore, BNB’s performance over the past 180 days has been significant, with a growth rate of 29.92%.

Featured image from Shutterstock, chart from TradingView.com

Read More
Blockchain

Bitcoin Gives Early Top Warning Signal, But Price Could Double First

Bitcoin price reached highs of close to $50,000 a coin this year until an abrupt, 15% selloff stopped the climb and put the overheated crypto market on ice. The pullback has caused an early “top” warning signal to fire in BTCUSD, but data suggests that the top cryptocurrency could double before the actual top is in.

Fishing For A Top Signal With the Fisher Transform

Spot BTC ETF hype helped drive the price of Bitcoin from lows around $15,000 to over $45,000 per coin – a 300% increase. Peak post-ETF approval price action reached as high as $49,000 before a sharp rejection send BTC plummeting back to $42,000 where it trades currently.

The 15% correction after a significant climb isn’t too out of the ordinary, however, the 1W Fisher Transform indicator might have just given an early “top” signal. The tool, which smooths out price action to better visualize price extremes, reached a +6 standard deviation. This is among the most extreme readings the tool has even given on the timeframe.

More importantly, however, is how the technical indicator has behaved over the last several years. Specifically, the Fisher Transform on the weekly timeframe has accurately called the 2019 top, and the 2021 top several weeks in advance after reaching a +6 standard deviation.

Why This Warning Signal Could Mean A New ATH, 100% Rally

This signal was an early top warning, not the actual top, to be precise. In 2019, after the Fisher Transform crossed bearish, BTCUSD rallied another 83% before the actual peak occurred. In 2021, there was another 122% more ROI to go before the peak was in.

This could mean that although Bitcoin price could be looking at a peak soon enough, another 100% could be added to the cost per coin. At $42,000 per coin, that could take BTC above $84,000 and to new all-time highs.

It is worth noting that 2021 exceeded the ROI of 2019, which could hint at increasing returns as more participants become aware of Bitcoin. With institutions now getting involved, spot ETFs actively trading, and more, anything is possible.

This chart was originally featured in issue #32 of CoinChartist VIP: This Time It’s Different.

Read More
Blockchain

XRP Sale Controversy: Ripple Faces Heated Legal Debate Amid Market Turbulence

The crypto community is currently embroiled in a debate over the right for Ripple to sell XRP tokens, sparked by a recent exchange between XRP advocate Bill Morgan and a crypto analyst known as “Darkhorse” on social media platform X.

This discussion delves into the legal complexities and market implications of Ripple’s actions concerning XRP sales.

There is nothing that prevents Ripple selling its XRP. Anyone can sell an asset it owns. The issue is whether in the US it needs to register its sales and offers of XRP with the SEC. If Ripple sells XRP programmatically as it has in the past it does not need to register the sales… https://t.co/vHbeCTpeP0

— bill morgan (@Belisarius2020) January 16, 2024

Legal Debate: Ripple’s Rights To Sell XRP

Bill Morgan, a staunch defender of XRP, argued that Ripple has no legal constraints on “selling its XRP tokens except in the context of institutional sales.”

This assertion was in response to a crypto analyst, Darkhorse’s reference to a ruling by Judge Analisa Torres in July 2023, which, according to the analyst, did not permit Ripple to sell XRP.

Morgan maintained that Ripple is legally allowed to sell its XRP holdings, clarifying that the company’s sales should not be viewed as investment contracts under the United States Securities law.

Morgan further noted that nothing is “stopping Ripple from selling its XRP.” “The issue is whether in the US it needs to register its sales and offers of XRP with the [Securities and Exchange Commission] SEC.”

After Judge Torres ‘ decision, another user on X highlighted a significant point regarding Ripple’s XRP sales. Based on the judge’s reasoning, these sales might “now be considered securities transactions.”

This change in classification, the user explained, is because Ripple’s involvement with XRP is now publicly acknowledged, which could lead to expectations of value increase due to the payment company’s activities.

Previously, such sales weren’t classified as securities transactions due to a “lack of evidence” that retail buyers knew about Ripple’s role with XRP. However, this has changed post-Judge Torres’ decision, making Ripple’s involvement a publicly recognized fact.

Responding to this, Morgan suggested that despite this public awareness, the past five years’ performance of XRP’s price indicates that expecting profits from Ripple’s efforts might not be “reasonable.” The XRP advocate further implied that those who bought XRP after the July 13th decision with such expectations might be “irrational or need help.”

Put on notice or not the price performance by XRP for the last 5 years suggests anyone who acquired XRP since the 13 July decision who thinks Ripple’s efforts are going to lead to profits from an increase in price of the asset does not have a ‘reasonable expectation’ and may be… https://t.co/WhKCyGWpA0

— bill morgan (@Belisarius2020) January 17, 2024

Ripple XRP Sale And Market Impact

Notably, the debate comes on the heels of Ripple’s recent transfer of 80 million XRP tokens, valued at approximately $46.18 million, to an undisclosed wallet. This transaction, reported by blockchain tracking service Whale Alert, has ignited speculation in the XRP community.

Amid these developments, XRP’s market performance has seen fluctuations. The asset experienced a 1.5% decline in the past 24 hours, dropping its price to $0.566. However, over the past week, XRP has shown resilience, recording a 2.6% increase. The trading volume for XRP also saw a dip, falling from over $1 billion last Wednesday to $827 million in the last 24 hours.

Featured image from Unsplash, Chart from TradingView

Read More
Blockchain

Crypto Analyst Predicts XRP Price Will Surge 800% To Reach $5 In The Next 90 Days

Crypto analyst Egrag Crypto recently made a bold prediction as to the future trajectory of the XRP price and asserted when exactly the crypto token will hit this price level. Considering XRP’s current price level, it will no doubt be interesting to see how this prediction plays out. 

“XRP To $5 In 90 Days”

Egrag mentioned in an X (formerly Twitter) post that XRP will rise to $5 in 90 days. The analyst also suggested that this price surge was just the beginning of XRP’s meteoric rise, as he said that the $5 range will mark the “initial wave 1 of a prolonged bull market.” This bull market, he expects, will span for several months, possibly enough time for XRP to hit all of Egrag’s bullish targets. 

The analyst outlined these bullish targets in a subsequent post as he noted that they remain unchanged. Egrag predicts that XRP will hit $1.2, $1.6, $7.5, and $13 on its way to $27. He had previously laid out a narrative as to why XRP will surge by over 4000% to hit $27. According to him, XRP hitting this price level was a real possibility considering that the token had in 2017 risen by 61,000%.

Egrag happens to be one of the analysts who are most bullish on XRP’s future despite its current price action. His most bullish prediction to date remains how XRP could rise to $2,500 by 2029. All this while, he has also urged XRP holders to be more patient as good things lie ahead for those who will stick around. 

Notably, Egrag credits his conviction to the amount of research he has put into studying XRP’s price movement over the years. Another reason why he seems to have become more bullish on XRP is because of the regulatory clarity that it enjoys. He once noted that this places XRP as the “safest investment choice.”

A Further Analysis Of XRP Price Chart

In the meantime, Egrag believes that the $0.55 level stands as “significant support for XRP,” and he doesn’t see the weekly candle closing below the $0.50 level. He further noted that the “edge of the atlas line looms at $0.43.” However, he is not anticipating XRP dropping to that price level. Instead, he is choosing to focus on the bigger picture.

Meanwhile, crypto analyst Crypto Rover also recently predicted that a parabolic breakout is on the horizon for XRP.  Just like Egrag, he provided a timeline, saying it would happen in the “upcoming 8 weeks.” However, His prediction looks more conservative than Egrag’s $5 prediction, as the chart Rover shared showed that XRP could rise to just over $1.

At the time of writing, XRP is trading at $0.57, according to data from CoinMarketCap.

Read More
Blockchain

Developer Hails ETH Burning, Will Ethereum Break $3,000?

Péter Szilágyi, an Ethereum (ETH) developer, has lauded EIP-1559 and its ETH burning mechanism as “the great equalizer.” Taking to X on January 16, Szilágyi admired EIP-1559’s ability to “level the playing field between validators and regular users.”

Developer: EIP-1559 Is A “Great Equalizer”

Since the implementation of EIP-1559, Ethereum adjusted how users bid gas fees, introducing the “base fee,” which was burned or sent to an irretrievable wallet. So far, data from Ultrasound Money shows that over 3.9 million ETH have been destroyed.

In the last week alone, the Ethereum network automatically sent more than 21,100 ETH out of circulation, “burning” ETH’s supply. 

Specifically, Szilágyi mentioned the advantage regular users have with EIP-1559. Through this implementation, validators (previously miners before Ethereum shifted to a proof-of-stake blockchain) no longer have the privilege of arbitrarily adjusting gas limits and transaction fees. 

Earlier, that leeway created what the developer described as an “imbalance,” which made it tough for “regular users to compete.” However, following this implementation, everyone must adhere regardless of status as a validator, founder, or user. 

With EIP-1559, the “base fee” adjustment is set at the protocol level. It is this base fee that the network burns, gradually making ETH deflationary, reading from the number of coins taken out of circulation since EIP-1559 went live in early August 2021. Even so, a sender can “tip” the validator, incentivizing them to prioritize validating a transaction.

Stability And Predictability Achieved, Ethereum Upsides Capped At $3,000

Szilágyi’s comments reflect a growing consensus among Ethereum supporters regarding the positive impact of EIP-1559. Though a big percentage of EIP-1559 is fixated on the price impact of the proposal, there is more that it achieves. 

Most importantly, from a user experience perspective, it is now easier for senders to predict how much they will pay for a transaction. This is crucial, especially when the network is congested. Additionally, though the Ethereum gas fee remains relatively high, EIP-1559, though considered a “bad idea” by Szilágyi, has stabilized the network. 

ETH burning is attributed to reducing inflation in Ethereum, a network whose total supply is not capped like Bitcoin. Over the long term, prices might benefit from this proposal. However, prices are bullish in the short to medium term. Still, upsides are limited to around the $3,000 psychological round number.

Read More
Blockchain

Bitcoin On Thin Ice: Peter Schiff Warns Impending SEC Regulations Could Tank Prices

Prominent economist and vocal crypto skeptic Peter Schiff has once again stirred the pot with his latest prognosis on Bitcoin (BTC). Schiff, known for his critical stance on digital currencies, has raised eyebrows with his latest post, where he warns of impending regulatory changes that could trouble Bitcoin’s transaction costs and future price trajectory.

Regulatory Changes On The Horizon

Schiff’s warnings are anchored in his belief that the US Securities and Exchange Commission (SEC), under the leadership of Gary Gensler, is poised to introduce new, more stringent regulations for cryptocurrencies.

According to Schiff, these regulations will likely significantly increase the operational costs of Bitcoin transactions. He argues that this hike in transaction costs will erode Bitcoin’s practicality as a digital currency, potentially leading to a sharp decrease in its market value.

Since @GaryGensler was backed into a corner on spot #BitcoinETFs approval, I think he will soon introduce new onerous #crypto regulations that will substantially increase the cost of #Bitcoin transactions, further undermining its “use” case, resulting in a sharp decline in price.

— Peter Schiff (@PeterSchiff) January 17, 2024

Schiff interprets Gensler’s recent actions, especially regarding approving spot Bitcoin exchange-traded funds (ETFs), as a precursor to these anticipated regulatory measures.

Despite the looming threat of increased regulation, some industry observers have pointed to Gensler’s previous classification of Bitcoin as a commodity. This categorization, they argue, might present challenges to the SEC’s scope of regulation.

However, Schiff counters this view by suggesting that the focus of any impending regulatory changes could be more aligned with anti-money laundering efforts rather than strictly within the ambit of securities law.

He thinks most are securities. But he may even change his mind on Bitcoin. But my thought is that new regulations will relate to AML, not securities law.

— Peter Schiff (@PeterSchiff) January 17, 2024

Technical Analysis Adds To Bearish Sentiment On Bitcoin

Supporting Schiff’s bearish outlook, market analyst Bitcoinhyper has recently identified a bearish pattern on Bitcoin’s chart. According to the analyst, a double-top pattern on the stochastic oscillator, a well-regarded momentum indicator, has emerged, signifying potential bearish movement ahead.

This technical observation aligns with recent market trends, where Bitcoin has shown downward movement following the formation of this pattern. Bitcoinhyper’s analysis supports the idea of further corrections, suggesting that Bitcoin’s peak might already be established.

As Bitcoin navigates through these uncertain waters, on-chain data from IntoTheBlock presents another challenge. The data shows that Bitcoin is currently facing a robust on-chain resistance zone.

This resistance is gauged by the volume of Bitcoin acquired by investors within the price range of $42,700 to $44,000. Approximately 2.68 million addresses holding over a million BTC are clustered in this range, creating a formidable barrier for price movements.

Bitcoin’s trading price currently hovers around $42,601, reflecting a 0.9% decrease over the last 24 hours and nearly a 5% decline over the past week. This price action is further compounded by a notable decrease in trading volume, which has dipped from last week’s $40 billion to below $30 billion today, indicating reduced market activity.

This sluggish market performance comes in the wake of fading excitement over the recent spot ETF approvals and an absence of significant market-driving news.

Featured image from Unsplash, Chart from TradingView

Read More
Blockchain

Parabolic Bitcoin Indicator Points To Continued Bull Run Despite 15% Crash

Recently, Bitcoin experienced a significant drop, crashing 15% from its 2024 highs around $49,000. This decline followed closely on the heels of the approval of 11 spot Bitcoin Exchange-Traded Funds (ETFs), a move that was initially met with optimism in the crypto community. The sudden downturn has left investors and traders analyzing the charts for clues about Bitcoin’s next move.

Is The Bullish Bitcoin Trend Over?

In the wake of this decline, technical analysis offers a beacon of insight. Notably, the correction was marked by a bearish engulfing candle on the daily chart, signaling a potential reversal in Bitcoin’s upward trend.

Accompanying this was a nasty wick – a long upper shadow on the candlestick chart, indicating a significant sell-off after prices peaked.

Further complicating the landscape was the opening of the CME BTC Futures with a sizeable gap down. Such gaps are often viewed as potential resistance levels, reinforcing the bearish sentiment.

Stop And Reverse: A Ray Of Hope

However, amidst these seemingly negative signals, a ray of hope shines through from a “parabolic” technical indicator – the Parabolic SAR (Stop and Reverse).

Despite the tumultuous market conditions, the weekly BTCUSD Parabolic SAR indicator remains untagged, suggesting that the long-term uptrend is still intact.

This indicator, known for its effectiveness in identifying potential reversals in the market’s direction, paints a different picture from the immediate bearish signals and sentiment.

What Is The Parabolic SAR?

To fully grasp the significance of the Parabolic SAR in this context, it’s essential to understand what it is and how it functions. The Parabolic SAR is a popular technical analysis tool used primarily to determine the direction of an asset’s momentum and to provide entry and exit points.

The ‘SAR’ in Parabolic SAR stands for ‘Stop and Reverse.’ This indicator is represented on charts as a series of dots placed either above or below the price bars. A dot placed below the price is viewed as a bullish signal, while a dot above is bearish.

The unique aspect of the Parabolic SAR is its ability to act as a trailing stop loss. As the price of an asset moves, the Parabolic SAR adjusts, moving closer to the price line. This adjustment provides a dynamic method for traders to manage their positions, securing profits while limiting potential losses.

In the context of Bitcoin’s current situation, the Parabolic SAR’s position – still below the price bars on the weekly chart – suggests that the long-term bullish trend is not yet disrupted.

Read More
Blockchain

Here Are The Most Bullish Predictions For ETH Price As Ethereum Dominance Rises Against Bitcoin

The sentiments around Ethereum look to be very bullish at the moment as the second-largest crypto token by market cap has seen its dominance surge against Bitcoin. Ethereum’s rise against the flagship crypto token is also significant, as crypto analyst Jaydee recently suggested that it could usher in the altcoin season. 

Bullish Predictions For Ethereum’s Price

Crypto analyst Ali Martinez recently highlighted the fact that Ethereum broke out from an ascending triangle on the weekly chart. According to him, the crypto token has its eyes on the $3,400 price level despite the short-term volatility. Backing Ali’s analysis, crypto analyst Mayne shared their belief that $3,400 remains a viable target for ETH’s price.

Interestingly, Mayne hinted that “ETH betas” could run alongside ETH when this significant price surge begins to happen. These ETH betas include tokens like the native tokens of Ethereum’s layer-2 networks Optimism and Arbitrum. 

Crypto analyst Ash Crypto also offered a bullish prediction for ETH’s price while commenting on the state of the market. He remarked that money was currently flowing from Bitcoin to Ethereum and that it shouldn’t be long before the latter trades above $3,200. 

ETH trading above the $3,000 price level looks to be the consensus going by these predictions. The CEO and founder of MN Trading, Michaël van de Poppe, had before now suggested that ETH was also going to rise above $3,000 on its way to $3,500. Then, Poppe boldly claimed that this price prediction would materialize in the first quarter of 2024.

Meanwhile, crypto analyst ColdBloodedShill stated in a recent X post that ETH is likely planning for higher prices as long as it remains above $2,400. The $2,400 price range looks to be an important support level as ETH looks to break out. Crypto analyst Bluntz Capital also highlighted that price range ($2,495 specifically) as he noted that there will be an eventual breakout as long as ETH holds above that level. 

Conviction On Ethereum Getting Stronger

Market intelligence platform Santiment recently revealed that the number of new ETH addresses is on the rise as Ethereum continues to outperform Bitcoin. 89.4 thousand addresses are said to have been created daily during this stretch. This represents a significant increase from late last year, when 70.4 addresses were created daily in early November.

Santiment also added that ETH’s supply on exchanges had reduced drastically to 8.10%, almost getting close to its all-time low (since the opening week of trading) of 8.05%. Such a development usually suggests that ETH holders are looking to hold for the long term as they move their holdings to self-custody.

Read More