Crypto Corner Café

Taste The Future

Blockchain

Blockchain

SOL Price Reaches Make-or-Break Levels – Can Solana Pump Again?

Solana is moving lower from the $120 resistance. SOL price is showing a few bearish signs and might decline sharply toward the $80 support.

SOL price started a fresh decline from the $120 resistance against the US Dollar.
The price is now trading below $102 and the 100 simple moving average (4 hours).
There is a key contracting triangle forming with resistance near $102 on the 4-hour chart of the SOL/USD pair (data source from Kraken).
The pair could continue to move down toward the $85 support or even $80.

Solana Price Faces Uphill Task

After a steady increase, Solana bulls struggled to clear the $120 resistance. SOL price formed a short-term top and started a fresh decline below the $112 support, like Bitcoin and Ethereum.

There was a steady decline below the $105 level. The bears pushed the price below the $100 level. It tested the $91.50 support. A low is formed near $91.38, and the price is now consolidating losses. There is also a key contracting triangle forming with resistance near $102 on the 4-hour chart of the SOL/USD pair.

SOL is now trading below $102 and the 100 simple moving average (4 hours). Immediate resistance is near the $97.40 level. It is close to the 50% Fib retracement level of the downward move from the $103.39 swing high to the $91.38 low.

The first major resistance is near the $100 level or the 76.4% Fib retracement level of the downward move from the $103.39 swing high to the $91.38 low.

Source: SOLUSD on TradingView.com

The main resistance is now near $102. A successful close above the $102 resistance could set the pace for another major rally. The next key resistance is near $112. Any more gains might send the price toward the $120 level.

More Losses in SOL?

If SOL fails to rally above the $102 resistance, it could continue to move down. Initial support on the downside is near the $92.00 level.

The first major support is near the $85.20 level, below which the price could test $80. If there is a close below the $68 support, the price could decline toward the $74.50 support in the near term.

Technical Indicators

4-Hours MACD – The MACD for SOL/USD is gaining pace in the bearish zone.

4-Hours RSI (Relative Strength Index) – The RSI for SOL/USD is below the 50 level.

Major Support Levels – $85, and $80.

Major Resistance Levels – $97.40, $102, and $112.

Read More
Blockchain

Ethereum Price Dips Alongside Bitcoin, Decoding Key Hurdles To Fresh Increase

Ethereum price struggled to rise above $2,550 and $2,580. ETH started a fresh decline like Bitcoin and traded below the $2,500 support zone.

Ethereum attempted a fresh increase but failed to surpass $2,550.
The price is trading below $2,500 and the 100-hourly Simple Moving Average.
There is a connecting bearish trend line forming with resistance near $2,480 on the hourly chart of ETH/USD (data feed via Kraken).
The pair continue to move down if there is a move below the $2,425 support.

Ethereum Price Extends Decline

Ethereum price struggled to gain pace for a move above the $2,550 and $2,580 resistance levels. ETH formed a short-term top and started a fresh decline below $2,500 like Bitcoin.

There was a move below the $2,450 level. A new weekly low was formed near $2,424 and the price is now consolidating losses. There was a minor increase above the $2,450 level, but the bears were active near the 23.6% Fib retracement level of the downward move from the $2,614 swing high to the $2,424 low.

Ethereum is now trading below $2,500 and the 100-hourly Simple Moving Average. On the upside, the price is facing resistance near the $2,465 level. The next hurdle could be $2,480. There is also a connecting bearish trend line forming with resistance near $2,480 on the hourly chart of ETH/USD.

The next major resistance is now near $2,520. A clear move above the $2,520 level might start a decent increase. In the stated case, the price could rise toward the $2,580 level.

Source: ETHUSD on TradingView.com

The next key hurdle sits near the $2,620 zone. A close above the $2,620 resistance could start another steady increase. The next key resistance is near $2,680. Any more gains might send the price toward the $2,720 zone.

More Losses in ETH?

If Ethereum fails to clear the $2,520 resistance, it could start another decline. Initial support on the downside is near the $2,440 level.

The next key support could be the $2,425 zone. A downside break below the $2,425 support might send the price further lower. In the stated case, Ether could test the $2,350 support. Any more losses might send the price toward the $2,320 level.

Technical Indicators

Hourly MACDThe MACD for ETH/USD is gaining momentum in the bearish zone.

Hourly RSIThe RSI for ETH/USD is now below the 50 level.

Major Support Level – $2,425

Major Resistance Level – $2,520

Read More
Blockchain

Bitcoin Price Takes Hit, Can Bulls Protect The Main Support at $40K?

Bitcoin price extended its decline below the $41,450 support zone. BTC is showing bearish signs and might struggle to stay above the $40,000 support zone.

Bitcoin price is gaining bearish momentum below the $42,500 zone.
The price is trading below $42,000 and the 100 hourly Simple moving average.
There is a key bearish trend line forming with resistance near $42,100 on the hourly chart of the BTC/USD pair (data feed from Kraken).
The pair is now at risk of more downsides toward the $40,000 support zone.

Bitcoin Price Gains Bearish Momentum

Bitcoin price failed to start a recovery wave above the $43,250 resistance zone. BTC formed a short-term top and started another decline below the $42,120 support zone.

The bears were able to push the price below the $41,450 level. A new weekly low was formed near $40,625 and the price is now consolidating losses. It is trading near the 23.6% Fib retracement level of the recent decline from the $43,569 swing high to the $40,625 low.

Bitcoin is now trading below $42,000 and the 100 hourly Simple moving average. There is also a key bearish trend line forming with resistance near $42,100 on the hourly chart of the BTC/USD pair.

On the upside, the price is facing resistance near the $41,675 level. The next key resistance is near the $42,100 zone and the trend line. It is also close to the 50% Fib retracement level of the recent decline from the $43,569 swing high to the $40,625 low.

Source: BTCUSD on TradingView.com

A clear move above the $42,100 resistance could send the price toward the $43,250 resistance. The next resistance is now forming near the $43,500 level. A close above the $43,500 level could push the price further higher. The next major resistance sits at $44,450.

More Losses In BTC?

If Bitcoin fails to rise above the $42,100 resistance zone, it could continue to move down. Immediate support on the downside is near the $40,750 level.

The next major support is $40,500. If there is a close below $40,500, the price could gain bearish momentum. In the stated case, the price could drop toward the $40,000 support in the near term.

Technical indicators:

Hourly MACD – The MACD is now gaining pace in the bearish zone.

Hourly RSI (Relative Strength Index) – The RSI for BTC/USD is now below the 50 level.

Major Support Levels – $40,750, followed by $40,000.

Major Resistance Levels – $41,675, $42,100, and $43,250.

Read More
Blockchain

Down Big: Crypto Scamming Numbers Reduced In 2023 – Report

2023 started with a challenging overall landscape for the crypto market that continued throughout the rest of the year. However, the market saw a recovery with a spike in bullish sentiment and ended the year on a positive note.

Additionally, 2023 saw a decline in crypto scamming and crypto-related illicit activity compared to the previous year, as new data shows.

Illicit Activity Market Revenue Decline In 2023

American blockchain analysis firm Chainalysis released its 2024 Crypto Crime Report detailing the trends and figures that crypto-related illicit activities saw in 2023. The firm’s data shows a significant drop in value received in cryptocurrency addresses used for illicit activities, totaling $24.2 billion.

This is a considerable reduction compared to the 2022 updated estimate of $39.6 billion. In addition, the share of all crypto transaction volume associated with illicit activity reduced from 0.42% in 2022 to 0.34% in 2023.

According to the report, there seems to be a shift in the type of assets involved in crypto-related crime activities over the last two years, with Bitcoin no longer being the most used asset for most illicit transactions.

Alternately, stablecoins have become a more popular choice for crypto assets involved in illicit activities, as the report states. This increase could be attributed to the recent general growth of stablecoins’ share of all crypto activity overall.

The shift to stablecoins is not seen in every related crime, with activities, such as darknet market sales and ransomware extortion, still taking place predominately in Bitcoin.

Nonetheless, it’s worth noting that their issuers can trace stablecoins, and funds can be frozen when addresses are linked to illicit activities, as Tether did back in 2023.

Trends That Defined Crypto-Related Crime In 2023

Chainalysis on-chain metrics suggest that scamming revenues have been trending globally since 2021. Although these crimes are still underreported, “overall, scamming is down, given broader market dynamics.”

Romance scams, such as ‘pig butchering,’ are among the most popular crypto scamming tactics used by scammers and are one of the biggest forms of related crime by transaction volume.

Regarding crypto hacking, the firm believes that “the decline in stolen funds is driven largely by a sharp dropoff in DeFi hacking,” it could represent “the reversal of a disturbing, long-term trend.” In 2023, crypto scamming and hacking revenue fell significantly, with the total revenue decreasing 29.2% and 54.3%, respectively.

In contrast to the overall trends, ransomware and darknet markets, two of the most prominent forms of related crime, saw revenues rise in 2023. Similarly, 2023’s growth in darknet market revenue comes after a 2022 decline in revenue.

The report shows that transactions with sanctioned-related entities and jurisdictions drive most of the illicit activity as entities and jurisdictions move towards using stablecoins and other crypto assets to bypass restrictions.

They accounted for a combined $14.9 billion transaction volume in 2023, representing 61.5% of all illicit transactions over the year. Chainalysis explains that:

Most of this total is driven by cryptocurrency services that were sanctioned by the U.S. Department of the Treasury’s Office of Foreign Assets Control (OFAC), or are located in sanctioned jurisdictions, and can continue to operate because they’re in jurisdictions where U.S. sanctions are not enforced.

Ultimately, the report addresses that not all sanction-related transactions are due to the illicit use of digital assets, as some of that $14.9 billion volume is related to the average users who reside in the sanctioned jurisdictions.

Bitcoin trading at $41,906.6 on the hourly chart. Source BTCUSDT on TradingView.com

Read More
Blockchain

Polygon’s Transfer Troubles: Is MATIC Facing A Trust Crisis?

Recently, the blockchain intelligence firm ChainArgos brought to light some unsettling findings about the Polygon network. According to ChainArgos, suspicious transaction patterns have emerged, raising questions about Polygon’s adherence to its initial token allocation plan.

ChainArgos’ investigation revealed multiple transactions from Polygon’s network to various exchanges seemed “questionable.” Particularly, the firm pointed out “anomalies” in the flow of tokens from Polygon’s vesting contract, which is responsible for the systematic release of tokens.

This contract, distinct from the foundation contract that governs overall allocations, displayed inconsistencies in outflow patterns. The firm’s latest analysis, detailed in a series of posts on X, scrutinizes the movement of significant quantities of MATIC tokens, Polygon’s native cryptocurrency.

Concerns Over Large MATIC Transfers

The investigative reports from ChainArgos delved deeper into the token flows. The firm noted that a specific wallet received approximately 470 million MATIC from two sources – the foundation and an insider wallet, particularly 340 million and 170 million, respectively.

The largest transfer identified was linked to a wallet associated with the plasma bridge, including two additional transactions to untagged wallets.

Adding to the intrigue, ChainArgos observed that a sum of 178 million MATIC was transferred to the prominent exchange Binance, with the last transaction dated May 23, 2021. These findings were substantiated by a chart from Etherscan, illustrating the token movements.

5/ All 178mm were sent from 0x30b7 to binance.

Last transfer 23-May-2021. Check the price chart friends. pic.twitter.com/iT6CVCOxtz

— ChainArgos (@ChainArgos) January 18, 2024

In the wake of these revelations, Polygon’s native token, MATIC, has experienced significant market turbulence. Over the past week, the cryptocurrency decreased by exceeding 10%, with a 4.2% drop in just the past 24 hours.

MATIC is valued at $0.81 at the time of writing, marking a mere 2.5% increase over the past month. This bearish performance contrasts sharply with the broader altcoin market, which has generally shown substantial gains during the same period.

The declining market position of MATIC is reflected in its slide to the 16th rank among cryptocurrencies by market capitalization. Furthermore, its trading volume has plummeted from over $1 billion last Thursday to a mere $493 million, indicating a significant reduction in trading activity.

Analysts’ Take On MATIC’s Future

Despite these challenges, some analysts remain optimistic about MATIC’s prospects. Crypto analyst Ali, for instance, predicts a potential rebound for MATIC soon. Ali’s bullish stance is grounded in the TD Sequential indicator, a tool to pinpoint trend exhaustion and imminent price reversals.

Ali’s analysis suggests that the TD indicator currently signals a buy opportunity for MATIC. He contends that if buying pressure intensifies around its current price levels, MATIC could experience a notable upswing.

#Polygon | The TD Sequential presents a buy signal on $MATIC 4-hour chart.

A spike in buying pressure around the current levels could see #MATIC rebound, potentially toward $0.88, and even as high as $0.96. pic.twitter.com/lj96zgPh7k

— Ali (@ali_charts) January 6, 2024

His projections point to a potential climb towards the $0.88 to $0.96 range, translating to an approximate 16% increase from its current valuation. This optimistic forecast assumes that Polygon’s underlying technology and market position can outweigh the recent concerns raised by ChainArgos’ findings.

Featured image from Unsplash, Chart from TradingView

Read More
Blockchain

Bitcoin Price In Danger? This Terrible Story Could Happen Again

The Bitcoin price has been moving steadily at its current but failed to meet general expectations. Following the approval of the spot Bitcoin Exchange Traded Funds (ETFs), market participants were expecting potential scenarios.

In these potential scenarios, Bitcoin pushed through critical resistance at $48,000 and continued making new highs, or the cryptocurrency retraced to $30,000. As usual, the market has avoided pleasing the crowd as BTC trades at $42,000.

Bitcoin Price Ready To Dip?

The spot BTC ETFs have been influencing the market; the capital flows from these financial products have been used to suppress the cryptocurrency. A pseudonym analyst has been keeping track of crypto exchange Coinbase to connect the flows with the Bitcoin price action.

Since its initial launch on January 11, the BTC flows into Coinbase have increased. This trading venue is key due to its role as Custodian in most spot Bitcoin ETFs filed with the US SEC.

Thus, asset managers who want to buy or sell BTC go to Coinbase. The exchange sees fluctuations in its Bitcoin price in the spot market compared to other exchanges.

As the trading volume on Coinbase has increased since the spot Bitcoin ETFs launch, the platform records some of its highest activity. In the meantime, the Bitcoin price trends sideways. The pseudonym analyst stated:

(…) supply is coming from somewhere, obviously gbtc and maybe some others, like cme futures, anyways, whats most important is coinbase is still trading discount compared to other spot venues and thats very weak, unless you’re managing billions $, you can probably wait to fomo once coinbase is dragging market up instead of dripping sells.

Another crypto analyst echoed these words; the chart below shows that the Coinbase Premium Gap signals strong selling pressure. If history repeats, the metric hints at a fierce crash for Bitcoin.

In that sense, the analyst recommends “patience” while Bitcoin moves sideways and the Coinbase Premium Gap signals a potential dip into support.

Bitcoin ETFs Breaking Record

A report from Reuters indicates that the spot Bitcoin ETFs attracted almost $2 billion in their first few days of trading. BlackRock and Fidelity led these capital inflows and will maintain them depending on their fee structure, CEO of CF Benchmarks Sui Chung claims, while adding:

Those that charge the lower management fees will unsurprisingly make themselves more appealing compared to their peers. Brand recognition is another core aspect.

However, several experts have questioned these flows, which disputed the numbers. Three days after the ETFs launched, NewsBTC reported $800 million in new inflows based on a report by Eric Balchunas, ETF expert for Bloomberg Intelligence.

Cover image from Unsplash, chart from Tradingview

Read More
Blockchain

$245 Million Whale Wakes Up To Threaten XRP Price Recovery

A recent transaction by an XRP whale is currently threatening XRP’s price recovery. This particular address is known to have moved all their XRP holdings worth millions of dollars, a move that the XRP community fears could cause a downturn in the token’s price. 

Whale Moves Over 443 Million XRP

Data from blockchain tracker Whale Alert shows that an unknown address linked to crypto Bitvavo sent 443,112,410 XRP to another unknown address that is linked to Bitvavo. Interestingly, data from the XRP Scan shows that the receiving address was just activated prior to when the transaction occurred. 

While the reason for this recent transaction remains unclear, such moves are always known to stir the crypto community as they raise speculations of a sell-off or an impending one. Dumping XRP tokens of such magnitude will no doubt have an impact on XRP’s price and could cause the token to decline further. 

Whale transactions involving XRP seem to have become a common trend, with Bitcoinist and NewsBTC reporting on several occasions how a significant amount of the token has been moved from one address to another. Last week, over 63 million XRP tokens were moved in two different transactions between crypto exchanges and unknown wallets. 

Meanwhile, it is worth mentioning that the address that received the 443 million XRP is yet to make any move, as on-chain data shows that there haven’t been any outflows or inflows since then. That should calm fears about any impending selloff, as the move might have been made as a security measure to secure the funds. 

All Is Well That Ends Well For XRP Price

XRP holders have continued to worry about XRP’s stagnant price action, with the token failing to make a significant price move up since losing its gains from Judge Anlaisa Torres’ ruling. However, going by Crypto Rover’s prediction, these concerns may soon be a thing of the past as XRP is expected to make a parabolic move in the “upcoming 8 weeks.”

Crypto analyst Egrag Crypto has also continued to urge the XRP community to focus on the bigger picture rather than worrying about XRP’s current price level. This big picture includes his prediction that XRP could rise to as high as $27 in the next bull run. If these predictions somehow manage to materialize, then there’s definitely a happy ending for XRP holders. 

Therefore, XRP’s tepid price looks like a small price to pay for the good things that possibly lie ahead for those who hold steadfast to their conviction that XRP will witness a parabolic move at some point. 

At the time of writing, XRP is trading at around $0.56, down in the last 24 hours, according to data from CoinMarketCap. 

Read More
Blockchain

Bitcoin NVT Golden Cross Shoots Bullish Signal, Rally To Restart?

Data shows the Bitcoin NVT Golden Cross indicator has recently dipped inside the undervalued zone, a sign that could be bullish for the price.

Bitcoin NVT Golden Cross Has Entered The Bullish Territory

An analyst in a CryptoQuant Quicktake post explained that the NVT Golden Cross has recently indicated upside potential. The “Network Value to Transactions” (NVT) is an indicator that keeps track of the ratio between the Bitcoin market cap and transaction volume.

This metric is often used to determine whether the current price is fair. When the NVT has a high value, it means that the value of the cryptocurrency (the market cap) is high compared to its ability to transact coins (the transaction volume). Thus, the coin’s spot price may be considered overvalued in such conditions.

On the other hand, the ratio having a low value implies the asset may be underpriced right now as the market cap isn’t too high when compared to the transfer volume.

In the context of the current discussion, the NVT itself isn’t of interest, but rather a modified form called the “NVT Golden Cross” is. This metric compares the NVT’s short-term trend (10-day moving average) with its long-term trend (30-day MA).

Now, here is a chart that shows the trend in the NVT Golden Cross over the last few years:

Historically, the Bitcoin NVT Golden Cross has had two major zones relevant to the cryptocurrency’s price, as the quant has highlighted in the graph. A higher indicator value than 2.2 suggests the asset is overvalued and may be prone to forming at least a local top.

Similarly, its being under the -1.6 level can indicate that the coin may be undervalued and thus more likely to show some turnaround. The major lows in 2023 occurred near when the metric dipped inside this territory.

The chart shows that the indicator’s value has plummeted recently and has dived inside this latter zone. At the peak of this negative spike, the NVT Golden Cross had touched -2.5, which meant that it had notably fallen below the -1.6 threshold.

As is visible in the graph, this latest negative peak of the NVT Golden Cross exceeds what was observed during August, but it’s still below the levels seen around the bottom of June.

If the historical pattern is anything to go by, the latest low NVT Golden Cross values could indicate that a bottom is near for the cryptocurrency, if not already behind it.

BTC Price

Bitcoin has been stuck in sideways movement during the last few days as the coin has been unable to pick any direction. At present, the asset is floating around the $42,600 level.

Read More
Blockchain

Economist Foresees $115,000 Bitcoin Peak, Followed By Largest Crash Since 1929

Renowned macroeconomist Henrik Zeberg has set the financial world abuzz with a stark prognosis on X (formerly Twitter), forecasting a dramatic surge in the Bitcoin price to a peak of $115,000 to $150,000. However, this meteoric rise is predicted to find an abrupt end, caused by a devastating macroeconomic downturn, one that Zeberg anticipates will be the most severe since the 1929 crash.

Why A Recession Will Hit The US In 2024/2025

At the core of Zeberg’s argument are seven reasons. Zeberg asserts, “Our Business Cycle has flashed a recession signal in 2023. Leading Indicators have crashed under our Equilibrium Line. In 80 years of data, the recession Signal from our Model has NEVER been wrong. No false signals – ever!” This model, with its unwavering accuracy over eight decades, forms the bedrock of his grim forecast.

Zeberg also delves into the significance of yield inversion, a well-documented precursor to economic downturns. Despite the signal’s dismissal by analysts in 2023 due to impatience, Zeberg emphasizes its historical reliability, noting, “From the bottom of the Yield Inversion, we normally see 12-15 months before a recession sets in. This signal is very much alive!” His remarks underscore a widespread underestimation of this critical indicator.

The economist further examines the trajectory of US industrial production, drawing alarming parallels to the period just before the 2007-08 financial crisis. He observes a similar pattern of divergence and warns of a strong impending drop in industrial production, signaling the onset of a recession.

Zeberg’s analysis extends to the housing market, where he highlights the plummeting NAHB index as a significant warning sign. “The bigger the decline in NAHB – the larger the rise in Unemployment,” he states, pointing to the direct relationship between housing market distress and the broader economy. This situation is exacerbated by rising interest rates, which lead to reduced consumer spending and, consequently, an economic downturn.

Moreover, personal interest payments are another cornerstone of Zeberg’s argument. He notes the historical pattern where increases in market rates burden consumers with higher mortgage and debt payments, ultimately leading to recessions. “Every rise in rates over the years has caused a recession, as consumers need to pull back on their Consumption,” Zeberg cautions, highlighting the lag inherent in the economic business cycle.

Housing affordability, or the lack thereof, is also a critical component of his analysis. With affordability plummeting below levels seen before the financial crisis, Zeberg paints a grim picture of the near future, where a deteriorating unemployment situation could lead to widespread defaults and a housing market collapse.

Lastly, Zeberg points to the bloated inventory levels of retailers and companies worldwide. He describes this as a hangover from the demand hype of 2021-22, driven by stimulus funds that have since dried up. This mismatch between supply and anticipated demand, he suggests, is a ticking time bomb for the economy.

Bitcoin: A Mirage Before The Storm

In the midst of this dire economic forecast, Zeberg casts a unique spotlight on Bitcoin. He predicts a fleeting period of euphoria for the cryptocurrency, with its value skyrocketing to an all-time high, potentially reaching between $115,000 and $150,000. He also provocatively states, “@Peter Schiff: See you at BTC = 100X 1 ounce of Gold.”

@PeterSchiff

See you at BTC = 100X 1 ounce of Gold

pic.twitter.com/rRf4MM9qYd

— Henrik Zeberg (@HenrikZeberg) January 17, 2024

However, Zeberg cautions that this surge is part of a broader misleading narrative. “The Soft Landing Narrative is what will dominate into the top in #Equities #Crypto #BTC,” he elaborates. This narrative, according to him, is a mirage that will mislead economists and analysts as they try to rationalize the ‘blow off top,’ a phenomenon they failed to forecast.

The reality, as Zeberg sees it, is starkly different: “Stock Market and Crypto will SOAR into early 2024. Euphoria will develop. Everybody will get onto the wrong side of the boat – just as Equity and Crypto Markets put in a major top. Recession sets in a few months later in 2024.”

In conclusion, Zeberg’s analysis foresees a major recession, one that he believes is inevitable and imminent. “The Titanic has already hit the Iceberg – and it will sink,” he starkly notes, dismissing any interventions from the Fed or any administration as futile.

The question is how Bitcoin might behave in a recession, something the cryptocurrency has not experienced since its inception in 2009. Will BTC become a safe haven, or will it follow the fate of equities, as Zeberg predicts?

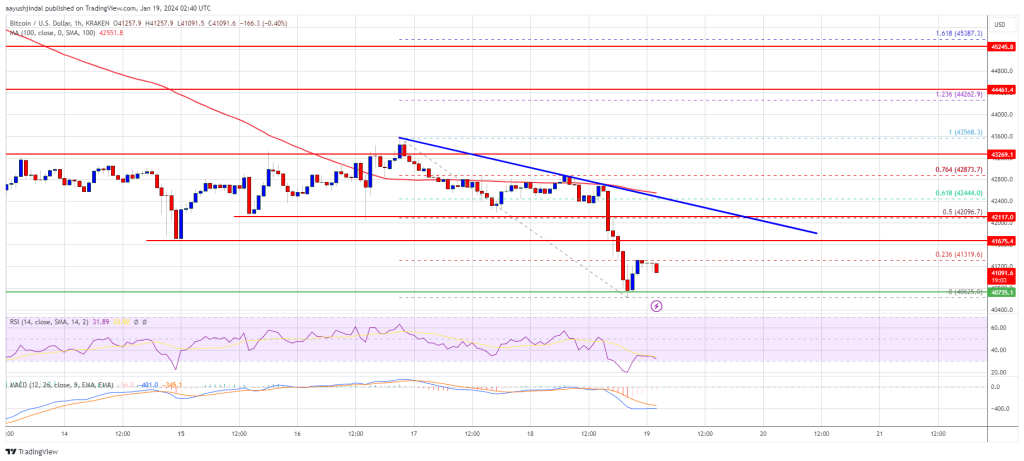
At press time, the Bitcoin price continued its sideways trend, trading at $42,392.

Read More
Blockchain

Injective On A Roll: Crypto Analyst Predicts Massive Breakout Against Bitcoin

Crypto analyst The Crypto Dog has provided a bullish narrative for the Injective (INJ) token. As part of his insights, the analyst hinted that the crypto token could outperform Bitcoin soon enough. 

Injective To Breakout Against Bitcoin

In an X (formerly Twitter) post, The Crypto Dog shared an INJ/BTC chart while hinting that an “incredibly bullish structure” was forming on the charts for Injective against the flagship crypto token. From the chart, it was obvious that the analyst was suggesting that the INJ token could soon make a massive move against Bitcoin. 

However, he didn’t provide details as to when this move could occur and what price levels INJ will hit once this impending breakout happens. Just like Solana’s SOL, INJ was another standout crypto token in 2023, as it rose to almost $40, enjoying a gain of about 3,000% in the process. This was more commendable, considering that it happened in an ongoing bear market.

Interestingly, INJ’s run continued into the new year, with the crypto token hitting its current all-time high (ATH) of $45 on January 9. One of the narratives that is believed to have brought INJ this far is the one around artificial intelligence (AI) tokens, with AI projected to be one of the leading themes in the next bull run. 

Injective, a layer-1 blockchain, also prides itself as the first blockchain to offer auto-executing smart contracts and happens to be one of the fastest blockchains out there. With such features, there is no doubt that the demand for the INJ token could continue to be on the rise as Injective’s utility increases. 

Other Narratives That Could Lead To INJ’s Rise

The Injective blockchain happens to be interoperable with Ethereum through its cross-chain infrastructure. This could be significant especially as Ethereum continues to see its dominance surge. Once ETH begins to run, INJ could be one of the biggest benefactors since some of the liquidity in the Ethereum ecosystem could easily flow into Injective.

Injective’s distinct burn mechanism is another feature that could be a big plus for INJ’s price. The network is known to carry out a weekly on-chain buy-back-and-burn auction where 60% of fees generated on its protocols are auctioned, with users only being able to bid in INJ. The INJ tokens made from these auctions are then burned and removed from circulation. 

These weekly burns are expected to be effective, considering that the token has a maximum supply of only 100 million. So far, close to 6 million of this supply have been burned. Meanwhile, at the moment, there are only just 83.7 million INJ tokens in circulation. 

At the time of writing, INJ is trading at around $38, down over 4% in the last 24 hours, according to data from CoinMarketCap. 

Read More