Crypto Corner Café

Taste The Future

Blockchain

Blockchain

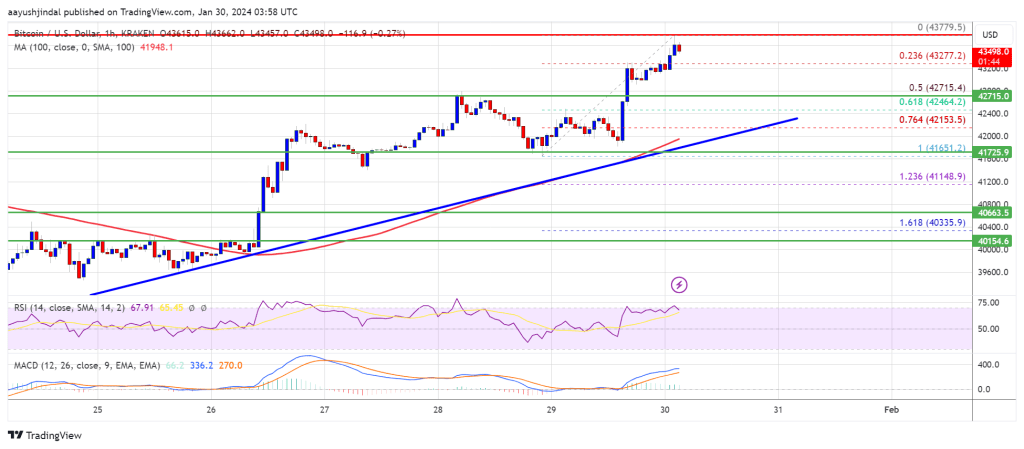
Why Is Bitcoin Price Up Above $43,000 Today?

Bitcoin is back above $43,000 just days after making a swift recovery from below $40,000 to $42,000. This trend reversal is believed to be due to a number of recent developments that have painted a bullish narrative for the flagship crypto token

The Grayscale Effect Is Wearing Off

Bloomberg analyst James Seyffart recently highlighted how BlackRock’s Spot Bitcoin ETF, IBIT, went toe-to-toe with Grayscale’s GBTC on Day 12 of trading in terms of trading volume. This happened to be the closest that IBIT or any Spot Bitcoin ETF had come close to GBTC, which holds the “liquidity crown.”

This represents a positive development for Bitcoin’s price since IBIT’s volume, more of inflows, is able to suppress GBTC’s volume, which has been majorly outflows. The outflows recorded by GBTC following its Spot Bitcoin ETF conversion had partly contributed to the flagship crypto token dropping below $40,000.

However, GBTC investors seem to be cooling on the profit-taking that had overwhelmed the fund as it has now seen a reduced outflow for the fifth consecutive day. BitMEX research revealed in an X (formerly Twitter) post that GBTC had seen an outflow of $192 million on January 29. 

That figure also represented GBTC’s lowest daily outflow yet and the first time it was seeing a daily outflow below $200 million. This recent trend of reduced outflows has evidently provided some form of relief to the Bitcoin market, seeing that Grayscale’s selling pressure has subsided. 

Meanwhile, the Bitcoin bulls also contributed to ensuring that Bitcoin didn’t stay down for too long. Data from IntoTheBlock showed that Bitcoin whales have increased their BTC holdings by 76,000 BTC since the start of this year. That suggests that there was a reasonable demand for the crypto token even when Grayscale continued to offload its BTC holdings. 

Other Factors Behind The Bitcoin Recovery 

NewsBTC recently reported how macroeconomic factors like the latest inflation data and the US debt being at an all-time high had contributed to Bitcoin’s recovery to $42,000. These factors are still playing out in Bitcoin’s current momentum, which has seen it rise above $43,000

Moreover, the Federal Open Market Committee (FOMC) meeting is scheduled for January 30 and 31, and the CME FedWatch Tool predicts that there is a 97.9% chance that interest rates remain the same. Rates holding steady, rather than a hike, are good for the market. 

This also provides a plausible explanation for the recent surge in Bitcoin’s price since investors are already positioning themselves in anticipation of the likely outcome of the Feds meeting. Another event these investors will be positioning themselves ahead for is the Bitcoin Halving.

Market intelligence platform Santiment recently revealed that Bitcoin’s supply on exchanges has continued to reduce, with BTC holders moving their tokens to cold storage. This move could well be in anticipation of the likely gains that Bitcoin is expected to see once the Halving event takes place. 

Read More
Blockchain

SUI Token Blasts Off: Blockchain Newcomer Hits $443 Million TVL, Enters Top 10

In a stunning comeback, the price of Sui token has soared to new heights, painting an impressive picture in the cryptocurrency market. Reaching an impressive $1.61 on the back of a solid 50% weekly rally on Tuesday – its highest point since May 3rd of the previous year – Sui has proven to be one of the standout performers of 2024. With an astronomical surge of over 328% from its lowest level in 2023, Sui has solidified its position as one of the most successful cryptocurrencies of the year.

SUI Breaks Through Resistance

Analyzing the token’s price action, the daily chart paints a compelling picture of an upward trend over recent months. Sui has experienced a remarkable surge from its 2023 low of $0.3500 to its current high of $1.60. Significantly, the token successfully broke through the crucial resistance level at $1.44, effectively nullifying a potential double-top pattern in the making.

Technical indicators, including the 50-day moving average and the Ichimoku cloud, lend further support to the bullish outlook for the Sui token. Market analysts are now setting their sights on the psychological price point of $2, representing a 25% increase from the current level, as the next significant milestone.

Sui owes much of its growth to its innovative architecture and ecosystem fund. Its architecture ensures swift transactions and lower costs compared to similar networks like Ethereum, making it an attractive choice for users. The recent announcement of Banxa’s expansion to the Sui network has further propelled Sui’s price surge. This expansion paves the way for users to easily acquire Sui tokens through Banxa’s on-ramp platform.

At the core of Sui’s phenomenal rise lies its blossoming Decentralized Finance (DeFi) ecosystem. Boasting a Total Value Locked (TVL) of over $443 million, Sui has secured a spot among the top 10 largest DeFi networks globally.

This achievement is particularly noteworthy as Sui has surpassed well-established cryptocurrencies such as PulseChain, Base, Cardano, Cronos, and Aptos, each valued in the billions. Notably, Cardano alone boasts a market cap exceeding $17 billion.

Sui’s Thriving Ecosystem And Growth Potential

Examining Sui’s thriving ecosystem, Defillama’s tracking reveals a remarkable 22 DeFi applications. Leading the pack is NAVI Protocol, a liquidity provider with over $98 million in assets. NAVI serves as a gateway for users to seamlessly lend and borrow assets across the Sui network, playing a crucial role in driving Sui’s growth.

Sui’s remarkable rise serves as a testament to the ever-evolving landscape of cryptocurrencies and the vast opportunities they present. As the cryptocurrency market continues to evolve, Sui stands out as a shining star, captivating the attention of investors worldwide.

Featured image from Shutterstock, chart from TradingView

Read More
Blockchain

Why Solana Beats Ethereum In This Bull Cycle: Crypto Expert

In a recent analysis, Andrew Kang, co-founder and partner of Mechanism Capital, provided a comprehensive analysis of the cryptocurrency market, focusing on the comparative strengths of Solana (SOL) over Ethereum (ETH) in the current bull cycle. Kang shared his insights via X, the platform formerly known as Twitter.

Central to Kang’s argument is the idea that in the current market, Solana presents a more favorable trading option than Ethereum. He states, “The definition of insanity is repeatedly trying to long ETHBTC when longing SOLBTC (or SOLETH) is the much better trade in a bullish environment.” This succinctly captures his perspective on the shifting dynamics between these major cryptocurrencies.

Why Solana Is The Superior Trade Than Ethereum

Kang offers a retrospective view of Ethereum’s journey, noting, “Over the first 6-7 years of ETH’s life, there was a lot of uncertainty and lack of education around ETH. There were a lot of Bitcoin holders to be converted to Ethereum holders.” He recognizes Ethereum’s early volatility and its eventual emergence as a stable trading asset.

However, he suggests that this relative stability has now become a double-edged sword: “ETH also became a ‘safe’ risk-on asset that traders could get into in size. That’s what made it a great cross to trade. But over time, people’s allocation to eth vs btc started to harden and the amount of people left to convert whittled away.”

Addressing Ethereum’s advancements in technology, Kang points out a paradox. He states, “While these [Layer 2 solutions and Modular technology] might seem like good things, it is these characteristics/innovations that weighs heavy on ETH during risk on periods where ETH previously outperformed.” He suggests that these developments, though innovative, have introduced new complexities that impact Ethereum’s performance in bull markets.

“Yes, you may have some conversion from BTC to ETH during risk on periods (much less so these days), but in this era ETH faces much more rotational pressure from those going from ETH as their base asset to these very L2s, modularity coins, SOL, those capitulating ETHBTC longs, and other shitcoins that it is supposed to benefit from,” Kang claimed.

In contrast, the crypto expert highlights Solana’s advantages, asserting, “Not only does SOL not face these same issues but it also has crossed the chasm in becoming a blue-chip Layer 1.” He emphasizes Solana’s resilience and its appeal to conservative investors who previously focused mainly on Bitcoin and Ethereum.

Kang further elucidates, “Conservative giants that previously were comfortable with BTC and ETH have SOL as an easy, safe next step. It is this transition phase of becoming a new major or base asset that you want to ride. A young fast horse, not a horse encumbered by the troubles of age, baggage and Jared Gray.”

Significantly, Kang notes a major shift in market dynamics, stating, “There was a secular shift in the collapse of ETHBTC volatility in 2023.” He posits that this shift has redefined the comparative advantage in favor of Solana. Concluding his analysis, Kang confidently asserts, “Even if that ever changes, SOLBTC will be the superior trade.”

At press time, SOL was just 30% short of a new all-time high against ETH.

Read More
Blockchain

ORDI: Extraordinary Price Movement Excites Investors – Here’s Why

At the time of writing, ORDI is experiencing a substantial increase in price after several events in the crypto world unraveled. Coingecko data reveals that ORDI is up nearly 12% in the past 24 hours. However, it remains to be seen whether this uptick in price will erase the bearishness experienced in the past few weeks. 

But right now, the crypto market, as a whole, is up a huge amount. The latest market data shows that the broader market is up nearly 3% after the bullishness brought by major coins and tokens like Bitcoin.

Stiff Competition In The Bitcoin ETF Space

After 11 Bitcoin spot exchange-traded funds were approved by the Securities and Exchange Commission earlier this month, the competition surrounding the Bitcoin ETF space grew this month. According to recent news, Fidelity’s Bitcoin ETF has outpaced Grayscale’s GBTC in inflows. JP Morgan also said that the outflows from GBTC were directed to its newer competitors with lower fees. 

“GBTC profit taking has largely happened already…This would imply that most of the downward pressure on Bitcoin from that channel should be largely behind us,” said JPMorgan analysts led by Managing Director Nikolaos Panigirtzoglou in a recent statement. 

The financial institution also points to Blackrock and Fidelity’s individual Bitcoin ETFs to dominate the market in the long term. However, Grayscale’s CEO Michael Sonnenshein believes that the majority of the recently approved ETFs won’t survive in the long term. He also defended the higher feeds imposed by Grayscale compared to its competitors.

“Investors are weighing heavily things like liquidity and track record and who the actual issuer is behind the product. Grayscale is a crypto specialist. And it has really paved the way for a lot of these products coming through,” said Sonnenshein in a recent interview with CNBC. 

ORDI: Higher High In The Near Future

ORDI is mostly following Bitcoin’s pace in the broader market. As of writing, BTC is sitting at $43.4k and rising. If Bitcoin continues to sail the bullishness, we might see ORDI follow suit. 

In the context of ORDI, events such as those mentioned above will also put the spotlight on BRC-20 standard tokens which has gained momentum since last year. As of now, ORDI’s position remains attractive for investors and traders as it rides the bullish wave that Bitcoin created.

If this bullishness continues, bulls will have enough momentum to settle on the 50% retracement level, which will provide a solid base to pump higher in the future. However, a more conservative bullish prediction is ORDI stabilizing above the 61.80% retracement level. If this happens, investors and traders will still experience profits with a much more stable platform for future price movements. 

Featured image from Shutterstock, chart from TradingView

Read More
Blockchain

Dogecoin Price Prediction – DOGE Bulls Aim For Fresh Rally To $0.095

Dogecoin is finding bids above the $0.0750 zone against the US Dollar. DOGE could gain bullish momentum if it clears the $0.0820 resistance zone.

DOGE is showing positive signs above the $0.080 zone against the US dollar.
The price is trading above the $0.0795 level and the 100 simple moving average (4 hours).
There is a key rising channel forming with support at $0.0795 on the 4-hour chart of the DOGE/USD pair (data source from Kraken).
The price could start a recovery wave if it clears $0.0820 and $0.0850.

Dogecoin Price Eyes Fresh Surge

In the past few sessions, Dogecoin price remained well-bid above the $0.0750 zone. DOGE formed a base and recently started a recovery wave above $0.0780, like Bitcoin and Ethereum.

There was a decent move above the 23.6% Fib retracement level of the downward move from the $0.0924 swing high to the $0.0760 low. DOGE is now trading above the $0.080 level and the 100 simple moving average (4 hours). There is also a key rising channel forming with support at $0.0795 on the 4-hour chart of the DOGE/USD pair.

On the upside, the price is facing resistance near the $0.0820 level. The next major resistance is near the $0.0842 level. It is close to the 50% Fib retracement level of the downward move from the $0.0924 swing high to the $0.0760 low.

Source: DOGEUSD on TradingView.com

A close above the $0.0845 resistance might send the price toward the $0.090 resistance. The next major resistance is near $0.095. Any more gains might send the price toward the $0.105 level.

Another Decline in DOGE?

If DOGE’s price fails to gain pace above the $0.0845 level, it could start a fresh decline. Initial support on the downside is near the $0.0780 level.

The next major support is near the $0.0765 level. If there is a downside break below the $0.0765 support, the price could decline further. In the stated case, the price might decline toward the $0.0720 level.

Technical Indicators

4 Hours MACD – The MACD for DOGE/USD is now losing momentum in the bullish zone.

4 Hours RSI (Relative Strength Index) – The RSI for DOGE/USD is now above the 50 level.

Major Support Levels – $0.078, $0.0765, and $0.0750.

Major Resistance Levels – $0.0820, $0.0845, and $0.0920.

Read More
Blockchain

Ethereum Price Loses Steam – This Resistance Could Spark Another Decline

Ethereum price jumped above the $2,280 resistance zone. ETH could gain bullish momentum if it clears the $2,330 resistance zone.

Ethereum started a decent increase above the $2,250 resistance zone.
The price is trading above $2,280 and the 100-hourly Simple Moving Average.
There was a break above a connecting bearish trend line with resistance near $2,260 on the hourly chart of ETH/USD (data feed via Kraken).
The pair might struggle to clear the $2,325 resistance zone and might correct lower.

Ethereum Price Revisits Resistance

Ethereum price started a decent increase above the $2,250 resistance zone. ETH cleared the $2,280 resistance zone like Bitcoin to start a steady recovery wave.

The bulls even pushed the price above the $2,300 resistance. There was a break above a connecting bearish trend line with resistance near $2,260 on the hourly chart of ETH/USD. A new weekly high was formed near $2,327 and the price is now consolidating gains.

It is now trading above the 23.6% Fib retracement level of the upward move from the $2,234 swing low to the $2,327 high. Ethereum is also trading above $2,280 and the 100-hourly Simple Moving Average.

Source: ETHUSD on TradingView.com

On the upside, the first major resistance is near the $2,330 level. The next major resistance is near $2,350, above which the price might rise and test the $2,420 resistance. If the bulls push the price above the $2,420 resistance, they could aim for $2,450. A clear move above the $2,450 level might start a decent increase. In the stated case, the price could rise toward the $2,550 level.

Another Bearish Wave in ETH?

If Ethereum fails to clear the $2,330 resistance, it could start another decline. Initial support on the downside is near the $2,300 level.

The next key support could be the $2,280 zone or the 50% Fib retracement level of the upward move from the $2,234 swing low to the $2,327 high. A daily close below the $2,280 support might start another major decline. In the stated case, Ether could test the $2,200 support. Any more losses might send the price toward the $2,120 level.

Technical Indicators

Hourly MACDThe MACD for ETH/USD is losing momentum in the bullish zone.

Hourly RSIThe RSI for ETH/USD is now above the 50 level.

Major Support Level – $2,280

Major Resistance Level – $2,330

Read More
Blockchain

Bitcoin Price Regains Strength As The Bulls Aim For Retest of $45K

Bitcoin price is gaining pace above the $42,500 resistance. BTC is showing positive signs and might extend its increase toward the $45,000 resistance.

Bitcoin price is moving higher above the $42,500 resistance zone.
The price is trading above $43,000 and the 100 hourly Simple moving average.
There is a major bullish trend line forming with support near $42,150 on the hourly chart of the BTC/USD pair (data feed from Kraken).
The pair could continue to rise if it clears the $43,800 and $44,200 resistance levels.

Bitcoin Price Climbs Higher

Bitcoin price started a decent increase above the $41,200 resistance zone. BTC was able to clear the $42,500 and $42,800 resistance levels to move further into a positive zone.

The bulls pushed the price above the $43,000 resistance and the price pumped toward $43,800. A new weekly high is formed near $43,779 and the price is now consolidating gains. It is trading above the 23.6% Fib retracement level of the upward move from the $41,651 swing low to the $43,779 high.

Bitcoin is now trading above $43,000 and the 100 hourly Simple moving average. There is also a major bullish trend line forming with support near $42,150 on the hourly chart of the BTC/USD pair. The trend line is near the 76.4% Fib retracement level of the upward move from the $41,651 swing low to the $43,779 high.

Immediate resistance is near the $43,800 level. The next key resistance could be $44,200, above which the price could rise and test $44,500. A clear move above the $44,500 resistance could send the price toward the $45,000 resistance.

Source: BTCUSD on TradingView.com

The next resistance is now forming near the $45,500 level. A close above the $45,500 level could push the price further higher. The next major resistance sits at $46,500.

Are Dips Limited In BTC?

If Bitcoin fails to rise above the $43,800 resistance zone, it could start a downside correction. Immediate support on the downside is near the $43,200 level.

The next major support is $42,500. The main support could be $42,200 and the trend line. If there is a close below $42,200, the price could gain bearish momentum. In the stated case, the price could dive toward the $40,650 support.

Technical indicators:

Hourly MACD – The MACD is now gaining pace in the bullish zone.

Hourly RSI (Relative Strength Index) – The RSI for BTC/USD is now above the 50 level.

Major Support Levels – $43,200, followed by $42,500.

Major Resistance Levels – $43,800, $44,500, and $45,000.

Read More
Blockchain

NEAR Protocol’s Expansion: Q4 2023 Shows 1,250% Rise In Daily Active Addresses

NEAR Protocol, the Blockchain Operating System (BOS), experienced significant growth in key metrics during the fourth quarter (Q4) of 2023. The protocol’s native token, NEAR, recorded a remarkable 16% year-to-date growth and witnessed a surge in adoption. 

Circulating Market Cap Soars 245%

According to a Messari report, the entire crypto market cap increased in Q4 2023, largely driven by the anticipation surrounding the introduction of spot Bitcoin exchange-traded funds (ETFs). 

NEAR actively participated in the overall market rally and achieved additional gains due to its heightened network activity and significant announcements. As a result, NEAR’s circulating market cap for the end of 2023 reached $3.7 billion, marking a 245% increase quarter-on-quarter (QoQ) and a 246% increase year-on-year (YoY). 

Furthermore, NEAR’s fully diluted market cap reached $4.3 billion. The protocol’s market cap ranking also soared, climbing 10 places to reach approximately 30th by the end of 2023.

In Q4 2023, NEAR’s revenue grew substantially, primarily generated from network transaction fees, reaching $750,000. The increase in revenue was attributed to the heightened activity generated by projects such as KAIKAINOW and NEAR Inscriptions. 

During the Inscriptions craze, revenue surged due to a transaction spike, driving up transaction fees. Notably, NEAR employs a fee-burning mechanism, where 70% of all fees are burned, while the remaining 30% is directed to the contract from which the transaction originated.

NEAR User Base Skyrockets

Another key metric demonstrating the protocol’s growth in Q4 2023 is that NEAR experienced significant growth in its user base. 

Average daily active addresses increased by 1,250% YoY, reaching 870,000 in Q4 2023. In addition, the number of daily new addresses grew by a remarkable 550% YoY to 170,000 in Q4 2023. 

According to Messari, this expansion comes after the successful launch and adoption of projects such as KAIKAINOW and contributions from the Sweat Economy, Aurora, and Playember, which further supported this positive trend.

NEAR’s daily active addresses were notably higher than those of other leading blockchain networks. For example, Optimism averaged 72,000 daily active addresses, Arbitrum 150,000, Polygon PoS 375,000, and Aptos 60,000 in Q4 2023.

NEAR Inscriptions significantly drove network activity, reaching a yearly high of 14 million transactions in December. Despite this substantial increase, transaction fees remained stable, staying below $0.01 for the quarter. 

Top 25 Blockchain By TVL In Q4 2023

NEAR’s Total Value Locked (TVL) reached $128 million by the end of Q4 2023, marking a remarkable 147% increase from the previous quarter. Among blockchains, NEAR positioned itself at approximately 25th place regarding TVL. 

Within the NEAR Network’s TVL, NEAR contributed $59 million, accounting for nearly 46% of the total TVL on the network. The remaining TVL was distributed across various decentralized finance (DeFi) applications, including Aurora, Ref, Berry Club, and Flux.

Additionally, NEAR announced partnerships with projects such as Chainlink and decentralized exchange (DEX) SushiSwap. 

According to Messari, the integration with Chainlink’s decentralized oracle network provided NEAR developers with access to real-world data and external Application Programming Interfaces (APIs), enhancing the functionality and usability of NEAR-based applications. 

On the other hand, the collaboration with SushiSwap allowed NEAR users to access a wide range of token swaps, liquidity pools, and yield farming opportunities, enabling developer adoption and increased usage within the ecosystem. 

Ultimately, looking ahead to 2024, Messari said the protocol’s vision is to iterate the technology roadmap, attract more developers, and attract more leading protocols. 

Featured image from Shutterstock, chart from TradingView.com

Read More
Blockchain

Glassnode Co-Founder Warns: Bitcoin’s Surge Could Trigger A $1 Billion Liquidation Event – Here’s Why

A notable perspective recently came from the Glassnode co-founders Jan Happel and Yann Allemann, Negentropic on X, who recently shared insights into Bitcoin price dynamics. Notably, the analysts highlighted liquidity as a crucial factor for Bitcoin’s price trajectory.

Bitcoin Market On The Brink Of Spike In Volatility

Negentropic revealed that BTC’s recent ascent above $42,200 has created a significant liquidity pool for long positions, marked by a “neutral impulse” in the market.

This trend indicates that Bitcoin aims to bridge the liquidity gap above the $42,000 mark, which hints at potential volatility and significant market changes.

So far, about $659 million in liquidations have taken place,  leading Negentropic to predict that continuing the bullish momentum could trigger liquidations worth $1 billion in short positions.

“Liquidity is KEY.”

1. Bitcoin Analysis: Bitcoin surged to $42.2k, providing liquidity for long positions, with a neutral impulse.

2. Liquidity Gap: The price is moving to fill the liquidity gap above $42k, indicating potential volatility. Approximately $659 million in… pic.twitter.com/wStqXqmLRN

— 𝗡𝗲𝗴𝗲𝗻𝘁𝗿𝗼𝗽𝗶𝗰 (@Negentropic_) January 29, 2024

This scenario could catalyze a market uplift through a “short squeeze,” a rapid price increase forcing short sellers to exit their positions. Such market movements often result in dramatic shifts, providing a fertile ground for Bitcoin’s growth.

Meanwhile, in a post uploaded last week, Negentropic linked the burgeoning liquidity in the crypto market to China’s efforts to stabilize its markets by injecting substantial liquidity. According to the Glassnode co-founder, this development could serve as a crucial catalyst for crypto like Bitcoin and equity markets as we progress into the first half of 2024.

The Liquidity surge begins.

China will try to prop up its markets by massive liquidity. It is very to be the catalyst that will make crypto and equity markets soar into the first part of 2024 @HenrikZeberg https://t.co/LBXBRh6D35

— 𝗡𝗲𝗴𝗲𝗻𝘁𝗿𝗼𝗽𝗶𝗰 (@Negentropic_) January 23, 2024

This perspective aligns with the broader market recovery, as Bitcoin shows signs of resurgence following reduced selling pressure, particularly from the Grayscale Bitcoin Trust (GBTC).

Bitcoin trades for $43,166, up 6% in the past week. However, despite this uptick, the asset’s daily trading volume remains subdued, down from $26 billion last Monday to $14 billion today, indicating a cautious market sentiment.

BTC Bullish Signals Strengthen

Amid these market developments, bullish forecasts continue to emerge. Crypto analyst Jelle recently suggested that with Bitcoin reclaiming the $42,000 level, it might be “time to focus on longs once again.”

#Bitcoin made stellar progress over the weekend, reclaiming $42,000 and making it back into the range.

Time to focus on longs once again. Bull market stays on! pic.twitter.com/T7fgmsVIGs

— Jelle (@CryptoJelleNL) January 29, 2024

Echoing this sentiment, Michael van de Poppe, a prominent crypto analyst and pundit, expressed optimism in his latest YouTube video. He argued that the recent price correction in Bitcoin might have reached its conclusion.

Further supporting the bullish sentiment, Ali’s chart analysis reveals an increase in large Bitcoin holders. An additional 46 entities now possess 1,000 BTC or more, a 3% rise in just two weeks.

Even amidst this market correction, #Bitcoin whales are not slowing down – they’re accumulating more $BTC!

In fact, there’s been a notable increase in major players: 46 new entities now hold 1,000 #BTC or more, marking a 3% increase in just two weeks. pic.twitter.com/GVNInKW7A2

— Ali (@ali_charts) January 24, 2024

Featured image from Unsplash, Chart from TradingView

Read More
Blockchain

This Banking Giant Files For Bitcoin ETF Application In Hong Kong

Following the recent approval of spot Bitcoin ETF (Exchange-Traded Funds) in the US and guidelines from Hong Kong’s Securities and Futures Commission (SFC) published in December of 2023, there has been increasing speculation about the launch of a spot Bitcoin ETF in Hong Kong this year. In a recent development, the first spot Bitcoin ETF application has been filed to the SFC for approval.

Chinese Financial Giant Takes The Lead

Earlier this month, Venture Smart Financial Holdings Ltd. (VSFG) expressed its plans to apply for a spot Bitcoin ETF with the SFC to be launched this quarter. Similarly, asset management firms like Samsung Asset Management have shown their interest in exploring the possibility in the future.

 A report from Tencent News revealed that Harvest Fund Management sent the first-ever spot Bitcoin ETF application in Hong Kong to the SFC on January 26, with the possibility of approval coming after the Lunar New Year at the earliest.

According to the news site, Hong Kong’s SFC wants to accelerate the approval of the first ETF after the US Securities and Exchange Commission (SEC) authorized the listing of the spot crypto products this month. The regulator’s plan includes listing the first ETF on the Hong Kong Stock Exchange after the Spring Festival.

Additionally, the report highlights the possibility of the SFC taking the same route as the US SEC and approving all applications simultaneously.

How Will Hong Kong’s Spot ETFs Compare To The US?

Regarding the performance of the investment products after the approval, a Hong Kong fund professional told Tencent News that “judging from the performance of the U.S. Bitcoin spot ETF, even if the Hong Kong Securities and Futures Commission approves multiple institutions at once, it may end up performing about the same as the U.S. market.”

However, some family office investor managers in Hong Kong suggested to the news site that “there may be some gap between the scale of Hong Kong spot ETF subscriptions and the United States.” The investor managers added that there’s real interest in subscribing to spot ETFs in Hong Kong, opposite to the “complexity of investment categories and operations” that stopped them from investing in the Bitcoin market before.

Moreover, the news sites reported that “compared with spot ETFs in the United States, in addition to accepting legal currency subscriptions, Hong Kong’s spot ETFs may also increase the possibility of direct Bitcoin subscriptions.”

Despite the interest and plans previously suggested by other investment and asset management firms, no organization has applied for a Spot Bitcoin ETF yet. Harvest Fund Management and the SFC haven’t issued further comment.

Read More