Crypto Corner Café

Taste The Future

Blockchain

Blockchain

Ex-Ripple Director Heralds ‘Big News’ For XRP, Can Price Respond?

Sean McBride, the former Director of Global Talent Acquisition at Ripple, has hinted at significant upcoming news for Ripple and XRP. McBride’s announcement, made via a post on X (formerly known as Twitter), has sparked a mix of excitement and skepticism among followers and investors alike.

His post stated: “Big news coming from #Ripple and #XRP in the next couple days,” setting the stage for speculation on what the news could entail and its potential impact on XRP’s market performance. However, the reaction to McBride’s announcement has been varied within the XRP community.

Big news coming from #Ripple and #XRP in the next couple days

— Sean McBride (@seanmcbride16) February 6, 2024

Wietse Wind, the founder of XRPL Labs—a company known for developing XRP Ledger-based projects such as XAMAN (formerly XUMM), a digital wallet, and Codius, a smart contract platform—responded with a hint of skepticism, implying concerns about insider trading:

Must be quite the news if it is worth entering insider trading territory.

Another community member, identified as Faisal, expressed a more cynical view, suggesting a pattern of temporary engagement with Ripple’s technology: “Another company using Ripple’s products as a ‘pilot program’ and then never actually using it after?” This sentiment reflects a broader skepticism that has occasionally surrounded Ripple’s partnerships and the actual adoption of its technology.

In response to the negative feedback, McBride’s retort was blunt: “Yeah, all you non Ripple shareholders can STFU because, yes, big news IS coming, already has come, and XRP is going to explode so piss off if you don’t have anything positive to say.” This statement indicates a strong belief in the significance of the upcoming news and its potential to positively impact the XRP price.

XRP Price Shows No Reaction (Yet)

As of press time, the XRP price has not shown any significant reaction to McBride’s announcement. This lack of immediate market movement may suggest that investors are adopting a wait-and-see approach.

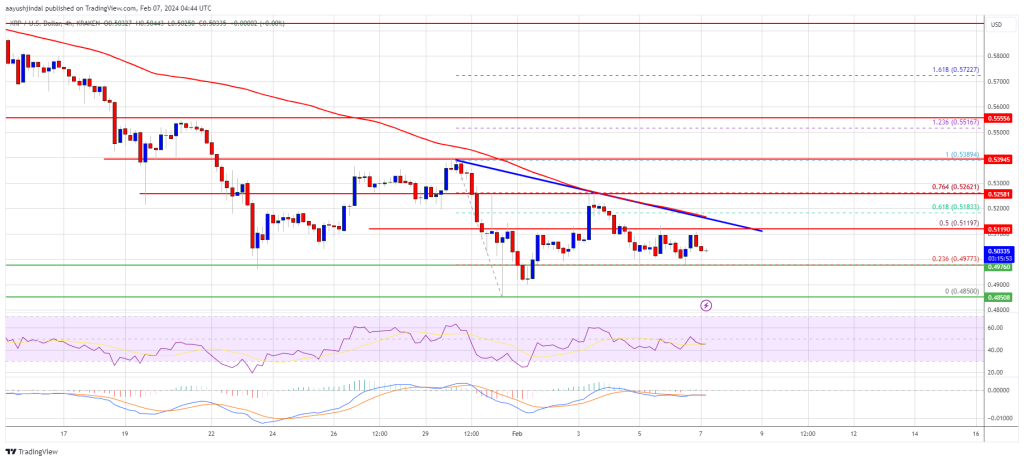
In a technical analysis of XRP against the US dollar (1-day chart), the price shows a continuation within a descending channel pattern, indicating a bearish market sentiment. As of press time, the XRP price hovered around the $0.50 mark.

The chart analysis reveals that the price of XRP is currently struggling below several critical Exponential Moving Averages (EMAs) – the 20-day EMA at $0.52319, the 50-day EMA at $0.55345, and the 100-day EMA at $0.56877. This EMA positioning suggests a strong resistance level for any upward price movement. Furthermore, the 200-day EMA at $0.56220, although below the 100-day EMA, still acts as a potential resistance zone.

Volume indicators show a relatively stable volume with a slight increase in selling pressure, as denoted by the red volume bars. The Relative Strength Index (RSI) is at 36.08, which is close to the oversold territory, but not yet indicative of a strong reversal signal.

Notably, the price is trading near the 0.786 Fibonacci retracement level at $0.49894, a critical support level in the short term. This Fibonacci retracement is drawn from the major swing high at $0.74902 to the swing low at $0.43085. The price has already breached the 0.5 ($0.58993) and 0.618 ($0.55239) Fibonacci levels, which were previously acting as support levels, and is now testing the 0.786 level for potential support.

The descending channel pattern is defined by two parallel lines, with the price making lower highs and lower lows, which is typically seen as a bearish signal. For traders looking for a bullish reversal, a break above the upper boundary of the channel and the nearest EMA would be essential. Conversely, a drop below the 0.786 Fibonacci level could see the price test the $0.43085 level, which is the recent swing low.

Read More
Blockchain

XRP Bulls Looming: Analyst Predicts 400X With Historical Trend

XRP is one of the most affected crypto assets amid the general bearish sentiment within the market, as the token has been on a downtrend for a while now, struggling between the $0.49 and $0.50 price marks.

XRP Could Be Poised For A Massive Surge To $10

Even though the digital asset is now in a bearish phase, a substantial price rally might be in store for the coin. Several crypto analysts have been bullish on the token, predicting significant upward movement that could take XRP to a new all-time high.

One of the popular crypto experts who has shared an optimistic projection for the asset is Crypto Patel. Patel shared his latest forecast on the social media platform X (formerly Twitter) with his thousands of followers. The analyst believes that this is finally the “time for XRP to shine” and go parabolic due to past trends.

According to Patel, during the last bull market, the crypto asset “failed” to perform very well alongside other tokens like Bitcoin. He highlighted that while Bitcoin reached its all-time high in the last bull market, XRP failed to surpass its 2017 peak of $3.30.  However, he asserted that this was because of the legal battle between Ripple and the US Securities and Exchange Commission (SEC) regarding XRP’s non-security nature.

So far, Patel believes that with the recent SEC victory over Ripple, perhaps the “floodgates” might be open for a breakout. He pointed out that a 2017 triangle breakdown, which formed before XRP went parabolic, is reappearing on the yearly chart.

Patel has asserted that if the coin mirrors the trend in 2017, it could be poised for a massive rally. “If 2017’s 40,000% pump repeats, we could see mind-blowing $10+ XRP,” he stated.

A 6-Year Long Brutal Bear Days

Over the past six years, XRP’s price has unquestionably gathered more positive fundamental qualities after consolidating in a triangle range. “Survived 2,291 – 6+ Years brutal bear days, this coiling pattern signals Ripple’s ready to erupt,” Patel stated.

Due to this, the cryptocurrency analyst anticipates that the price of XRP will rise to $0.90. However, this is expected to occur following a successful breakout from the $0.40 and $0.50 price range.

After that, the crypto expert believes there will be no doubt as to the route to a new peak and a parabolic rise to $10. He further underscored several price targets for XRP, while putting his accumulation range between “40 and 50 cents.”nPatel has urged the community to look out for the digital asset, as it might be on the “launching pad again.”

As of the time of writing, XRP’s price is trading slightly below $0.50, indicating a 2% decrease in the past week. Despite the price decline, its trading volume has increased by over 15% in the past day, according to CoinMarketCap.

Read More
Blockchain

VeChain Ready For Big Moves: Analyst Identifies Key Factors That Will Drive VET To New ATH

Crypto analyst and YouTuber, Crypto ZX has released an update on VeChain (VET) price movements, predicting a surge to new all-time highs if the cryptocurrency succeeds in breaking certain resistance levels. 

Catalysts Behind VET’s Projected Price Surge

In a YouTube video released on Monday, Crypto ZX explored VeChain’s historical and recent price actions, emphasizing a potential for an upward trajectory as market down trends subside. The analyst delved into VeChain’s recent performance in relation to Bitcoin, offering insights into key resistance levels and projecting a major surge during the anticipated 2024 bull run. 

According to the Crypto ZX, VeChain previously broke above a significant price resistance on December 20, 2023, reaching almost $0.039 before undergoing a subsequent pullback. Despite an attempt to breach the same price resistance on January 11, 2024, the cryptocurrency faced a notable rejection. 

Crypto ZX has suggested that VeChain may be consolidating around the $0.03 price range. Nonetheless, the cryptocurrency’s expected goal is to experience a surge beyond the crucial resistance level at $0.033 cents. 

The analyst has revealed that a break above the resistance level would give VeChain a greater chance to surge to new highs. He predicts that if VeChain can overcome current resistance levels, then the price of the cryptocurrency could rise as high as $0.04425 cents.

Crypto ZX explains that the market’s recent downturn has led to VeChain’s fluctuating price movement along the support line. He anticipates a retracement of around 17.26% from the key resistance level and predicts that VeChain could surge to new yearly highs if Bitcoin succeeds in surpassing the crucial levels at $46,000.

“At the end of the day all are speculations, but I am very optimistic about the price of VeChain for the year 2024. I think it is going to shock a lot of people,” Crypto ZX stated. 

VeChain Price Update

In his YouTube video, Crypto ZX provided an update on VeChain’s recent price movements and current value. According to the analyst, VeChain is down about 2.3% on the daily time frame. He reveals that the majority of the market is also down currently due to Bitcoin’s recent pullback.

At the time of writing, VeChain is trading at $0.027, reflecting a decrease of 1.51% in the past 7 days, according to CoinMarketCap. The analyst revealed that the cryptocurrency is also down by 1.9% in BTC, compared with the market capitalization, which is holding very strong above the $2 billion mark. 

Crypto ZX has disclosed that despite the traction gained by VeChain’s ongoing projects and developments, the cryptocurrency has not reflected the impact. He emphasized that VeChain is undervalued, considering the overall expansion and advancements the cryptocurrency has undergone.

Read More
Blockchain

Cardano Price Stagnant At $0.48, But Charts Point To Potential Upswing

Cardano (ADA), the eighth-largest cryptocurrency, finds itself in a perplexing situation as it grapples with a battle between bullish and bearish forces, leaving investors deciphering mixed signals in a turbulent market.

The optimism that briefly emerged on January 29th, as ADA’s market structure turned bullish, proved short-lived, unable to overcome the critical $0.50 support level, and remaining stuck in the $0.48 territory.

Social media sentiment, often a precursor to price movements, has not provided solace either. Santiment’s “weighted social sentiment” metric has steadily declined over the past ten days, reflecting tepid investor confidence.

ADA’s Metrics: Confusion Amidst Bullish Signals

The confusion deepens when examining on-chain metrics. While the negative MVRV ratio suggests ADA might be undervalued, the sustained presence in negative territory raises concerns. Conversely, the increasing number of active addresses, signaling heightened network activity, offers a glimmer of hope for bullish investors.

Complicating the outlook is the liquidation heatmap from Hyblock. Two prominent zones add complexity: the $0.45-$0.48 region, hosting an estimated $300 million in liquidation levels, and the $0.52-$0.54 zone, carrying similar selling pressure. A drop to the former could trigger buying activity as long positions close, while the latter’s fate hinges on Bitcoin’s (BTC) movement, given ADA’s tendency to follow its lead.

Industry experts remain divided on Cardano’s future. Santiment suggests that the increased bearish sentiment might hint at an impending price bounce, while others exercise caution, citing the lack of definitive follow-through after the initial bullish market structure shift.

With #crypto market caps ranging and lacking the usual growth traders have been accustomed to since the #bullcycle began in October, there is a notable #bearish sentiment that has taken hold of #crypto discourse this week. #Bitcoin, #Ethereum, #BinanceCoin,

(Cont) pic.twitter.com/c3M4bPxlhi

— Santiment (@santimentfeed) February 5, 2024

Cardano Dips Amidst Stability: Mixed Signals

Cardano (ADA) is currently navigating a bearish trend, experiencing a 2.93% decrease in the past 24 hours and declines of 1.13% and 10.33% over the past week and month respectively. Despite this dip, it maintains its position as the 8th largest cryptocurrency by market cap, suggesting some underlying stability.

While the short-term technical picture appears bleak, longer-term indicators offer potential for cautious optimism. The increasing number of active addresses hints at growing network activity, a potential bullish sign.

Additionally, the negative MVRV ratio, although concerning in its extended presence, could indicate undervaluation. However, this needs to be balanced against the crucial resistance zones identified around $0.54-$0.56, which could hinder upward momentum.

Overall, ADA’s future trajectory remains uncertain. Further analysis would benefit from exploring the reasons behind the recent price decline, potential catalysts for recovery, and a deeper dive into long-term fundamentals like development progress and adoption rate.

Featured image from Freepik, chart from TradingView

Read More
Blockchain

Dogecoin Massive Dump: 100 Million DOGE Floods Robinhood, Investors Brace For Price Impact

In a surprising turn of events within the cryptocurrency realm, Dogecoin (DOGE), the popular meme coin, experienced a frenzy in the broader crypto market. The cause of this excitement was a recent significant whale transaction that caught the attention of traders and investors globally.

DOGE Whales: Surging Transfers, Market Speculations

According to blockchain metrics highlighted by the tracker Whale Alert, a staggering 100 million DOGE, equivalent to $7.83 million, was observed on the move. This notable transfer from an unknown wallet, identified as …wwKF, to the renowned American financial services provider Robinhood, sparked immense curiosity among crypto enthusiasts worldwide.

100,000,000 #DOGE (7,836,678 USD) transferred from unknown wallet to #Robinhoodhttps://t.co/REEoqcGAoe

— Whale Alert (@whale_alert) February 7, 2024

Despite expectations of a price dip due to such a substantial selloff by the whale, DOGE managed to trade in the green as of press time. This unexpected movement fueled speculations about a potential run for the meme coin in the near future. Market participants eagerly observed the impact that the colossal selloff might have on DOGE’s price.

In addition to the whale transaction, the token witnessed a surge in wallet adoption in recent days. On-chain analytics firm Santiment reported that approximately 414,000 non-zero wallets were added to the DOGE network over the past two weeks, marking the fastest rate of growth in the brief history of the memecoin.

The growth in wallet adoption primarily stemmed from retail investor cohorts, as indicated by the dramatic increase in addresses holding between 0.001-1 coins. This surge in new users joining the DOGE community can be attributed to the cryptocurrency’s cult status in the meme coin space and its widespread popularity.

Interestingly, while the DOGE price experienced a marginal jump at the time of the whale transaction, the subsequent market trends displayed a gradual downward momentum. The weekly and monthly charts indicated a drop of 1.5% and 3.1%, respectively. The contrasting movements in the DOGE price and the whale’s massive selloff, coupled with the decrease in open interest by 2.2%, raised questions about the overall market sentiment.

Dogecoin’s Potential Shift: Enthusiasts Await Action

Crypto market enthusiasts worldwide are closely monitoring DOGE, eagerly anticipating a potential shift in price action. The influx of new users and the increased number of non-zero wallets added to the network have added to the intrigue surrounding the meme coin.

While the recent whale transaction and the surge in wallet adoption have generated excitement within the DOGE community, it is essential to exercise caution when navigating the highly volatile cryptocurrency market. Factors such as market sentiment, global events, and regulatory developments can have a significant impact on the future price movements of DOGE and other cryptocurrencies.

Meanwhile, a recent analysis of Coinglass data by NewsBTC reveals a consistent trend where negative short bets on Dogecoin have consistently outnumbered bullish long bets over the past week.

This divergence in sentiment within the options market adds complexity to the DOGE landscape, signaling caution among traders and suggesting uncertainty about the sustainability of recent positive price movements.

Featured image from Freepik, chart from TradingView

Read More
Blockchain

Ticking Time Bomb: Bitcoin Mega Squeeze Predicted In The Next 10 Days

Bitcoin has been moving sideways since mid-January, when the price broke out of a parallel upward channel to the downside. The BTC price is currently around the same price as on January 13. However, the time of dullness could soon be over, as the Bollinger Band Width (BBW) indicator signals.

The BBW is derived from the Bollinger Bands themselves, which consist of a middle line (typically a simple moving average) surrounded by an upper and lower band. These bands expand and contract based on the standard deviation of the price from the mean, which is a measure of volatility. The BBW quantifies the degree of these bands’ divergence or convergence by calculating the ratio of the difference between the upper and lower bands to the middle band.

Bitcoin Mega Squeeze Incoming

In an analysis on X (formerly Twitter), crypto analyst HornHairs has drawn attention to the BBW which currently shows a reading close to 0.11. This number is significant because it suggests that the bands are very close together, indicating a period of low volatility or a ‘squeeze.’ He remarked:

BTC MEGA VOL SQUEEZE: We probably have 10 days MAX before a huge move on BTC. Now’s the time to get your plan ready for either direction, don’t want to be stuck in a frozen panic with no plan if things launch upwards or nuke lower. It’s coming very soon.

Historically, such a squeeze is often followed by a period of high volatility, as the market moves to find a new price equilibrium. The key takeaway from the BBW’s current low reading is that the market should prepare for a sharp increase in volatility, leading to a strong upward or downward movement in Bitcoin’s price.

The term “Mega Squeeze” used by HornHairs points to the unusually tight convergence of the Bollinger Bands, implying that the subsequent market move could be more pronounced than what is typically observed following a BBW contraction. The last few times the BBW approached such low levels, Bitcoin experienced significant price swings shortly thereafter. These historical precedents serve as a guide to what might occur in the days ahead.

The last instance of the BBW reaching its current low was observed on October 13 last year. Subsequent to this indicator, BTC experienced a significant rally, ascending over 30% in a mere 10 days. In a contrasting scenario, mid-August 2023 saw the BTC value decline by 15% in just 8 days. Additionally, at the outset of January 2023, Bitcoin showcased a remarkable surge, escalating by 40% within a span of 17 days.

As of press time, Bitcoin was hovering around $42,900, with a recent peak at $49,000 and a local low at $38,600. These price points will be crucial to watch as the market navigates through this period of constricted volatility. The BBW suggests that the breakout, whether bullish or bearish, will likely drive the price towards or even beyond these levels, marking a new phase of market activity.

Renowned crypto analyst CrediBULL commented on the emergence of the indicator: “Volatility soon. Big move coming. My bet is UP and the start of our next impulsive leg that we have been anticipating. Place your bets and pack your bags frens.”

The next key resistance on the 1-day chart of BTC/USD is at $43,340 (0.236 Fibonacci retracement level), while the region at $39,800 (0.386 Fibonacci level) provides key support.

Read More
Blockchain

XRP Price At Make-Or-Break Moment, Key Levels To Watch

XRP price is struggling to clear the $0.520 resistance. The price could gain bearish momentum if there is a close below the $0.4850 support.

XRP is showing bearish signs below the $0.520 and $0.508 resistance levels.
The price is now trading below $0.520 and the 100 simple moving average (4 hours).
There is a connecting bearish trend line forming with resistance near $0.5120 on the 4-hour chart of the XRP/USD pair (data source from Kraken).
The pair is now at risk of more downsides below the $0.5000 support zone.

XRP Price Faces Many Hurdles

In the past few days, XRP price saw a downside reaction below the $0.550 pivot level. The bears remained active and were able to push the price below the $0.500 support zone.

Recently, there was a recovery wave above the $0.500 level. The bulls pushed the price above the 50% Fib retracement level of the downward wave from the $0.5390 swing high to the $0.4850 low. However, the bears were active near the $0.525 resistance.

Ripple’s token failed to clear the 76.4% Fib retracement level of the downward wave from the $0.5390 swing high to the $0.4850 low. XRP is now trading in a bearish zone below $0.508 and the 100 simple moving average (4 hours), unlike Bitcoin and Ethereum.

On the upside, immediate resistance is near the $0.512 zone. There is also a connecting bearish trend line forming with resistance near $0.5120 on the 4-hour chart of the XRP/USD pair. The first key resistance is near $0.520, above which the price could rise toward the $0.5320 resistance.

Source: XRPUSD on TradingView.com

A close above the $0.5320 resistance zone could spark a strong increase. The next key resistance is near $0.5550. If the bulls remain in action above the $0.5550 resistance level, there could be a rally toward the $0.5840 resistance. Any more gains might send the price toward the $0.6000 resistance.

More Downsides?

If XRP fails to clear the $0.5120 resistance zone, it could continue to move down. Initial support on the downside is near the $0.500 zone.

The next major support is at $0.485. If there is a downside break and a close below the $0.485 level, the price might accelerate lower. In the stated case, the price could retest the $0.450 support zone.

Technical Indicators

4-Hours MACD – The MACD for XRP/USD is now gaining pace in the bearish zone.

4-Hours RSI (Relative Strength Index) – The RSI for XRP/USD is now below the 50 level.

Major Support Levels – $0.500, $0.485, and $0.450.

Major Resistance Levels – $0.512, $0.520, and $0.532.

Read More
Blockchain

Ethereum Price Faces Big Move – Can Bulls Send ETH To $2,500?

Ethereum price gained traction and climbed above $2,350. ETH is now showing positive signs and might extend gains toward the $2,500 level.

Ethereum is gaining bullish momentum above the $2,350 zone.
The price is trading above $2,320 and the 100-hourly Simple Moving Average.
There was a break above a key rising channel forming with resistance near $2,350 on the hourly chart of ETH/USD (data feed via Kraken).
The pair might correct lower, but dips could be limited below the $2,335 support zone.

Ethereum Price Turns Green

Ethereum price formed a base above the $2,220 level and started a decent increase. ETH outperformed Bitcoin and was able to clear a few hurdles near the $2,350 level.

There was a break above a key rising channel forming with resistance near $2,350 on the hourly chart of ETH/USD. The bulls pumped the pair toward the $2,400 level. A high was formed near $2,389 and the price is now consolidating gains.

There was a minor decline below the $2,365 level. Ether dipped below the 23.6% Fib retracement level of the recent increase from the $2,282 swing low to the $2,389 high.

Ethereum is now trading above $2,320 and the 100-hourly Simple Moving Average. On the upside, the first major resistance is near the $2,380 level. The next major resistance is near $2,420, above which the price might rise and test the $2,485 resistance.

Source: ETHUSD on TradingView.com

If the bulls remain in action, they could even pump the price above the $2,550 resistance. In the stated case, the price could rise toward the $2,550 level.

Another Drop in ETH?

If Ethereum fails to clear the $2,380 resistance, it could start a downside correction. Initial support on the downside is near the $2,350 level and the channel trend line.

The next key support could be the $2,335 zone or the 50% Fib retracement level of the recent increase from the $2,282 swing low to the $2,389 high. A clear move below the $2,335 support might send the price toward $2,250. The main support could be $2,220. Any more losses might send the price toward the $2,120 level.

Technical Indicators

Hourly MACDThe MACD for ETH/USD is losing momentum in the bullish zone.

Hourly RSIThe RSI for ETH/USD is now above the 50 level.

Major Support Level – $2,335

Major Resistance Level – $2,380

Read More
Blockchain

Bittensor (TAO) Surges 100%, Eyeing $3 Billion Market Cap: Analyzing The Propelling Factors

Among the digital currencies focused on artificial intelligence (AI), Bittensor (TAO) has recently gained significant attention as the best-performing asset, soaring by an impressive 109% over the past 30 days and achieving a market capitalization of $2.9 billion. 

To comprehend the driving forces behind this growth, it is essential to understand what underpins the platform and the catalysts that have captured investors’ attention, enabling it to reach an almost $3 billion market cap in record time.

Bittensor ‘Game-Changing’ Upgrade? 

According to Sami Kassab, a researcher at Messari, Bittensor has transitioned from being a niche crypto-AI project to gaining widespread recognition within the open-source AI community. 

Notably, a significant network upgrade proposal called Dynamic TAO has been pivotal in this surge. Bittensor operates as an ecosystem of specialized networks, known as subnets, each dedicated to a specific machine learning use case or resource provision.

These subnets offer diverse services, including conversational AI platforms similar to ChatGPT, prediction tools for financial markets, pre-trained and fine-tuned models, synthetic data, and data storage solutions

The Root Network, specifically subnet 0, functions as Bittensor’s governing body, where Root validators vote on the allocation of emissions to the various subnets. However, two key issues have been identified with the current system:

Concentration of Influence Over Emissions: The top five Root validators control over 60% of the token supply.
Scalability Issues: The manual process of setting emissions for each subnet becomes increasingly impractical as the number of subnets grows.

The foundation has proposed a network upgrade known as Dynamic TAO to address these issues. This upgrade aims to replace the Root Network with an automated, market-driven mechanism for emission distribution, shifting away from a subjective, manual process dominated by a few validators.

Furthermore, according to the researcher, under Dynamic TAO, each subnet would have its unique token and native liquidity pool paired with TAO. 

Emissions would be allocated based on the relative market price of these subnet tokens. Subnets that generate the most value would see their subnet tokens in high demand from validators, signaling the protocol to allocate more emissions to them.

Bullish Demand For TAO

To prevent potential dilution of TAO, subnet tokens are designed to be non-transferable outside the Bittensor system. 

The conversion between subnet tokens and TAO would occur through the protocol’s intrinsic liquidity pools (LP), treated as a staking activity. According to Kassab, acquiring subnet tokens would thus require purchasing and staking TAO within a subnet pool for validation or speculation.

This design is expected to create bullish demand for TAO, as the need for subnet tokens would drive an increased demand for TAO. 

For instance, the research shows that if subnets achieve a collective valuation of $1 billion, assuming a 10% weekly trading volume relative to their market cap, the demand for TAO could witness a 2 – 4x surge, driven by the requirement to purchase TAO before acquiring subnet tokens.

Ultimately, Kassab believes that the Dynamic TAO proposal sets the stage for an “AI Casino” within Bittensor, a development with positive implications for the platform and the token’s price growth.

Overall, Bittensor’s solutions and proposals demonstrate an intriguing approach to drive growth within its ecosystem. These initiatives aim to attract investors, stakers, and developers focusing on artificial intelligence, all while leveraging the potential of its native token, TAO.

At the time of writing, the TAO token is trading at $481, reflecting an increase of over 12% within 24 hours. Furthermore, TAO has demonstrated a sustained upward trend over significant time frames, with an 8% growth in the past 7 days and an 85% growth over the past 14 days.

Moving forward, it remains to be seen how the protocol will continue to attract new investors and developers, potentially driving TAO’s price beyond its current all-time high of $521, achieved on February 6. 

Featured image from Shutterstock, chart from TradingView.com

Read More
Blockchain

Bitcoin Price Reclaims 100 SMA But Can Bulls Clear This Hurdle

Bitcoin price is consolidating above the $42,500 support zone. BTC could gain bullish momentum if it clears the $43,500 resistance zone.

Bitcoin price is still struggling to clear the $43,400 and $43,500 resistance levels.
The price is trading above $42,500 and the 100 hourly Simple moving average.
There is a key rising channel forming with support at $42,450 on the hourly chart of the BTC/USD pair (data feed from Kraken).
The pair could start a strong increase if it clears the $43,500 resistance zone.

Bitcoin Price Aims Higher

Bitcoin price formed a base above the $41,800 level and started a steady increase. BTC was able to clear the $42,200 and $42,500 resistance levels.

It also reclaimed the 100 hourly Simple moving average. The price climbed above the 50% Fib retracement level of the downward move from the $43,488 swing high to the $42,320 low. The bulls even pushed the price above the $43,000 level.

However, the bears seem to be active near the $43,200 level. It is near the 76.4% Fib retracement level of the downward move from the $43,488 swing high to the $42,320 low.

Bitcoin is now trading above $42,650 and the 100 hourly Simple moving average. Immediate resistance is near the $43,200 level. The next key resistance could be $43,500, above which the price could start a decent increase. The next stop for the bulls may perhaps be $44,200.

Source: BTCUSD on TradingView.com

A clear move above the $44,200 resistance could send the price toward the $45,000 resistance. The next resistance is now forming near the $45,500 level. A close above the $45,500 level could push the price further higher. The next major resistance sits at $46,500.

Another Decline In BTC?

If Bitcoin fails to rise above the $43,500 resistance zone, it could start another decline. Immediate support on the downside is near the $42,900 level and the 100 hourly SMA.

The first major support is $42,450 and the channel trend line. If there is a close below $42,450, the price could gain bearish momentum. In the stated case, the price could dive toward the $41,800 support.

Technical indicators:

Hourly MACD – The MACD is now losing pace in the bullish zone.

Hourly RSI (Relative Strength Index) – The RSI for BTC/USD is now above the 50 level.

Major Support Levels – $42,900, followed by $42,450.

Major Resistance Levels – $43,200, $43,400, and $43,500.

Read More