Crypto Corner Café

Taste The Future

Blockchain

Blockchain

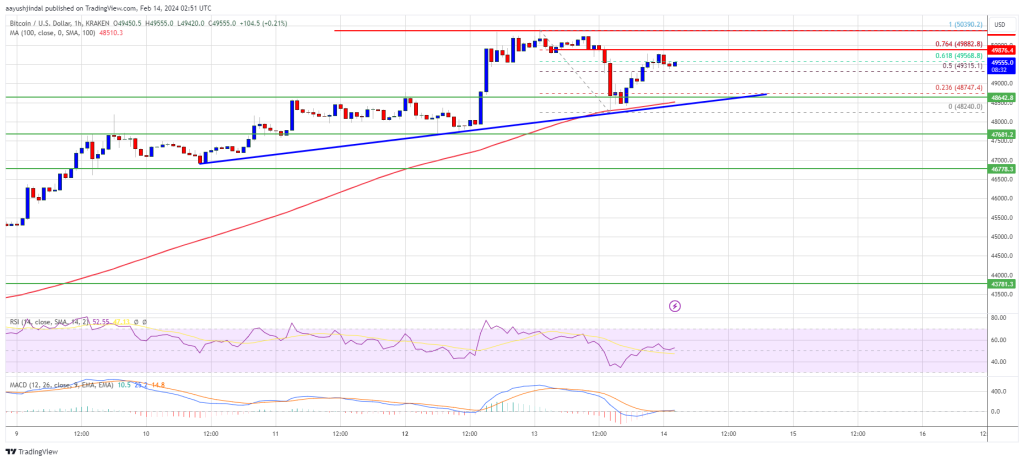
Bitcoin Price Breaks Past $51,500: 4 Key Reasons

On Tuesday, the Bitcoin price plunged from $49,900 to $48,300 following the release of the US inflation data. As NewsBTC reported, the data came in hotter than expected. Instead of 2.9%, headline CPI came in at 3.1%, while the core CPI was even at 3.9% instead of the expected 3.7%.

The traditional financial market reacted negatively and dragged Bitcoin down with it, as expectations for interest rate cuts have shifted further into the future. The prediction markets are now pricing in only 4 rate cuts in 2024 after CPI inflation reached 3.1% in January.

This is a huge drop in expectations as just over a month ago the markets were still pricing in 6 rate cuts. The Fed’s most recent forecast was for 3 rate cuts in 2024. The probability of a rate cut in March is below 10% and the probability of a rate cut in May is falling rapidly.

In contrast to the S&P 500, however, the Bitcoin price showed a strong reaction and quickly rose again to $49,900. The reaction of the Bitcoin market is quite telling for the short-term future. And the Bitcoin price is showing just that today. At press time, BTC rose above $51,500, marking a new yearly high. Here are 4 key reasons:

#1 Record-Breaking Bitcoin ETF Inflows

The surge in Bitcoin ETF inflows marks a pivotal moment for Bitcoin, reflecting a significant shift in investor sentiment and market dynamics. On a record-breaking day on Tuesday, the net inflows into spot Bitcoin ETFs reached $631 million, led by The Nine with an inflow of $704 million, signaling a substantial accumulation of Bitcoin.

Key players like Blackrock and Fidelity played a significant role in this influx, with Blackrock experiencing nearly half a billion dollars ($493 million) in inflows and Fidelity $164 million. The overall net inflow of $2.07 billion over four trading days, averaging over half a billion per day, highlights the staggering sustained demand for Bitcoin.

This demand is notably new capital, as GBTC outflows remained stable at $73 million, indicating these inflows are not merely a rotation from GBTC but represent fresh investments. Matt Hougan, CIO of Bitwise emphasized the significance of this movement:

IMHO the [numbers] undercounts the fundamental new investor demand for these ETFs. People assume all of the money flowing out of GBTC to date is rotating into other bitcoin ETFs. But a good chunk of it is from inorganic holders […] Long-term investors have backfilled that and added $3b more on top. I suspect the real new investor-led new demand is north of $5b, and shows no signs of slowing.

#2 Genesis GBTC Liquidation Concerns Alleviated

Fears of a Bitcoin crash, similar to FTX’s sale of GBTC, triggered by Genesis’ planned liquidation of Grayscale Bitcoin Trust (GBTC) shares have been alleviated, as reported today on Bitcoinist. The liquidation, necessary due to Genesis’ bankruptcy, was initially viewed as a potential market downturn catalyst.

The bankrupt lender needs to liquidate approximately 36 million shares of GBTC, valued at around $1.5 billion, as part of its strategy to resolve financial challenges stemming from significant loans and regulatory settlements.

However, the proposed Chapter 11 settlement involves in-kind repayments to creditors, reducing direct selling pressure on Bitcoin. This strategy aligns with the interests of long-term Bitcoin holders, potentially limiting market volatility. Greg Schvey, CEO at Axoni, highlighted:

The proposed Ch 11 settlement requires Genesis to repay creditors in kind (i.e. bitcoin lenders receive bitcoin in return, rather than USD). […] Notably, in-kind distribution was a priority negotiation topic to prevent long-term BTC holders from recognizing gains when receiving USD back (i.e. a forced sale). This would seem to indicate a substantial volume of lenders don’t plan to sell immediately.

#3 OTC Demand Exceeds Supply

The statement by CryptoQuant CEO Ki Young Ju that “Bitcoin demand exceeds supply at OTC desks currently” is a significant indicator of underlying market strength. OTC transactions, preferred by large institutional investors for their discretion and minimal market impact, are reflecting a robust demand for Bitcoin. This demand-supply imbalance at OTC desks suggests that large players are accumulating Bitcoin, a bullish signal for the cryptocurrency’s price outlook.

#4 Futures And Spot Market Dynamics

The analysis of futures and spot market indicators by @CredibleCrypto sheds light on the technical factors signaling a bullish continuation for Bitcoin. The analyst points out, “Data supporting the idea that that was ‘the dip’. – OI reset back to levels before the last pump – Funding decreasing through this local consolidation – Spot premium is back.”

These observations suggested a healthy market correction rather than the start of a bearish trend, with the reset in open interest and the decrease in funding rates indicating that the market has absorbed the shock and is primed for upward movement.

In conclusion, The combination of record ETF inflows, alleviated concerns over Genesis’ GBTC liquidation, strong OTC demand, and favorable futures and spot market dynamics provides a compelling case for Bitcoin’s potential rally. Each of these factors, supported by expert insights and market data, underscores a growing investor confidence.

Read More
Blockchain

Dogecoin Poised For Bullish Breakout, 30% Rally Predicted?

Dogecoin (DOGE) enthusiasts and holders have had a glimmer of optimism to hold on to, as the meme token is currently posting gains of about 4.35% in the past seven days amidst inflows into the crypto market. This recent price action prompted an analysis from crypto analyst Captain Faibik, who predicts a 30% surge for DOGE. 

According to the analyst, the price of DOGE is on the verge of breaking out of a symmetrical triangle, putting the crypto back on track to climbing above the $0.1 price level again.

Technical Analysis Points To Impending DOGE Breakout

Captain Faibik recently took to social media platform X to share a bullish prediction on DOGE. According to the 12-hour timeframe price chart shared by the analyst, the price of Dogecoin has been forming a downward-sloping triangle since it reached $0.1018 on December 12. Notably, price action illustrates a sequence of lower highs and higher lows between the trendlines, which shows that bears are gradually losing control of the market. 

Lower highs and higher lows are generally considered bullish, as they typically indicate a consolidation phase before a potential trend reversal to the upside. Faibik’s technical analysis indicates a likely 30% bullish breakout above $0.08199. If this turns out to be correct, a prolonged breakout might result in Dogecoin revisiting its December high around the $0.106 level by March.

$DOGE is on the Verge of Symmetrical Triangle Breakout..!!

In Case of Upside Breakout, Expecting +30% Bullish Rally in the Short term. #Crypto #DOGE #Dogecoin pic.twitter.com/j1WL8mv33u

— Captain Faibik (@CryptoFaibik) February 13, 2024 

Can DOGE Reenter The Top 10 Cryptocurrencies?

Recent market dynamics have resulted in Dogecoin losing its place among the 10 biggest cryptocurrencies by market cap. Chainlink (LINK), the culprit, was able to displace Dogecoin from the 10th position after two weeks of intense price gain.

During this period, Dogecoin also witnessed a crash in whale transactions, implying waning sentiment from these large holders.

However, Chainlink’s rally seems to have slowed, with the crypto currently on a 4% correction from $20.82. Consequently, data from Coinmarketcap shows Chainlink is yet to gain a substantial distance ahead of Dogecoin in terms of market cap. 

Chainlink is currently only ahead by $80.8 million, giving Dogecoin a chance to catch up. The 30% bullish breakout prediction above the current price level is enough to push Dogecoin back into the top 10 crypto assets.

While another major DOGE rally isn’t guaranteed, technical factors are lining up. The first resistance is at $0.083, and a decisive breakout above this level could give traders an entry opportunity. However, failing to break above this resistance level would invalidate a bullish run, and DOGE could fall back to $0.078. 

At the time of writing, DOGE is trading at $0.0818, down by 0.61% in the past 24 hours.

Chart from Tradingview

Read More
Blockchain

Are We Headed For Another $69K? Bitcoin Price Surges As Greed Dominates Crypto Market

Bitcoin, the undisputed king of cryptocurrencies, is making headlines again with a recent price surge that has pushed it past the coveted $50,000 mark. This rally, coupled with an “extreme greed” reading on the Crypto Fear and Greed Index, paints a picture of a market brimming with optimism, but also raises concerns about potential overheating.

Greed Galore: Index Hits Highest Since ATH

The Crypto Fear and Greed Index, a widely used indicator of investor sentiment, recently skyrocketed to 79, its highest level since November 2021, when Bitcoin peaked at a record-breaking $69,000. This “extreme greed” reading suggests that investors are feeling euphoric about the current rally, potentially leading to risky investment decisions.

Bitcoin’s Bullish Charge: 15% Gain YTD

Fueling this optimism is Bitcoin’s impressive performance year-to-date. Since January 1st, the cryptocurrency has climbed a staggering 15%, showcasing a sustained bullish trend. This surge comes on the heels of a volatile 2023, where Bitcoin saw both dramatic dips and exciting climbs.

Spot Bitcoin ETFs: A Catalyst For Growth?

Many analysts point to the recent launch of spot Bitcoin exchange-traded funds (ETFs) in the US as a key driver of the current rally. These ETFs offer investors a regulated way to access Bitcoin, potentially attracting new money to the market. While the initial launch saw a sell-off, analysts like Cathie Wood of ARK Invest believe it was short-lived, paving the way for long-term institutional participation.

Doubled Value In A Year: A Turning Point?

Bitcoin’s current price of $50,000 is more than double what it was a year ago. This significant growth, coupled with the influx of new investors, leads some to believe that Bitcoin is entering a new era of stability and sustained growth. However, the cryptocurrency market is notoriously volatile, and past performance is not always indicative of future results.

Proceed With Caution: Experts Advise

Financial experts urge investors to exercise caution despite the current market enthusiasm. The “extreme greed” reading on the Fear and Greed Index serves as a warning sign of potential irrational exuberance. Investors should always conduct their own research, understand their risk tolerance, and not blindly follow market trends.

Bitcoin’s future remains uncertain, but one thing is clear: the crypto market is once again buzzing with excitement. Whether this translates into another $69,000 peak or a sudden correction remains to be seen. Only time will tell if the current “greed” translates into long-term prosperity or a fleeting blip on the radar.

Featured image from Adobe Stock, chart from TradingView

Read More
Blockchain

XRP Price Prediction: A Fresh Rally Is Around The Corner?

XRP price is consolidating below the $0.538 resistance. The price could start a fresh rally if it clears the $0.5380 and $0.5500 resistance levels.

XRP is struggling to clear the $0.5350 and $0.5380 resistance levels.
The price is now trading above $0.520 and the 100 simple moving average (4 hours).
There is a key bullish trend line forming with support at $0.5170 on the 4-hour chart of the XRP/USD pair (data source from Kraken).
The pair could start a fresh rally if it clears the $0.5380 and $0.5500 resistance levels.

XRP Price Eyes Fresh Rally

In the past few days, XRP price recovered higher from the $0.4980 zone. There was a move above the $0.505 and $0.5120 resistance levels. However, the bears remained active near the $0.5380 resistance and protected more upsides, unlike Bitcoin and Ethereum.

The recent high was formed at $0.5375 before there was a downside correction. There was a move below the $0.5220 level. The price even spiked below the 50% Fib retracement level of the upward move from the $0.4980 swing low to the $0.5375 high.

Ripple’s token price is now trading above $0.520 and the 100 simple moving average (4 hours). There is also a key bullish trend line forming with support at $0.5170 on the 4-hour chart of the XRP/USD pair. On the upside, immediate resistance is near the $0.5300 zone.

Source: XRPUSD on TradingView.com

The first key resistance is near $0.5380, above which the price could rise toward the $0.550 resistance. A close above the $0.550 resistance zone could spark a strong increase. The next key resistance is near $0.5850. If the bulls remain in action above the $0.5850 resistance level, there could be a rally toward the $0.600 resistance. Any more gains might send the price toward the $0.620 resistance.

Another Decline?

If XRP fails to clear the $0.5380 resistance zone, it could start another decline. Initial support on the downside is near the $0.518 zone and the trend line.

The next major support is at $0.5120. If there is a downside break and a close below the $0.5120 level, the price might accelerate lower. In the stated case, the price could retest the $0.480 support zone.

Technical Indicators

4-Hours MACD – The MACD for XRP/USD is now losing pace in the bearish zone.

4-Hours RSI (Relative Strength Index) – The RSI for XRP/USD is now near the 50 level.

Major Support Levels – $0.517, $0.512, and $0.480.

Major Resistance Levels – $0.530, $0.538, and $0.550.

Read More
Blockchain

Stacks (STX) Skyrockets Over 43% And Smashes $2 Threshold, Setting Sights On New All-Time Highs

Stacks (STX) has garnered significant attention in the cryptocurrency industry as it emerges as a leading altcoin contender. With an impressive performance surpassing all top 100 tokens, except for Dymension (DYM), Stacks has witnessed a remarkable surge in the past 24 hours, catapulting its value well above the $2 mark and inching closer to its all-time high (ATH) of $2.492. 

This surge can be attributed to various factors, including its positioning as a Bitcoin layer for smart contracts, the recent surge in Bitcoin’s price, and the token’s adoption and growth rate.

Stacks Climbs The Market Cap Rankings

As outlined in the project’s white paper, Stacks serves as a Bitcoin layer for smart contracts, enabling trustless utilization of Bitcoin as an asset in smart contracts and facilitating transaction settlements on the Bitcoin blockchain. 

The recent surge in Bitcoin’s price over the past few weeks has also acted as a catalyst for Stacks’ price surge. Currently trading at $2,156, Stacks has experienced a significant recovery from its low of $1,241 during a market downturn that bottomed on January 23. 

Notably, this recovery coincided with Bitcoin’s price rebound from $38,500 to $43,000, highlighting the correlation between the two assets.

Market expert Trover.btc, known on X (formerly Twitter), has noted Stacks’ impressive ascent in the market cap rankings. From being ranked around 60, Stacks has climbed to the 34th position within a year, surpassing well-known projects. 

With the Bitcoin Layer 2 narrative gaining prominence and Layer 1 network fees reaching all-time highs, expectations are high for Stacks to enter the top 20 rankings around the halving, according to Trevor.btc. 

STX Sets All-Time High Total Value Locked 

A key metric to consider is its market capitalization (fully diluted) to gauge Stacks’ adoption and growth rate. According to Token Terminal data, Stacks’ market cap has experienced a notable surge of 187% in the past 90 days and an impressive increase of over 527% year-to-date, aligning with the token’s price surge.

Moreover, data from on-chain analytics aggregator DefiLlama reveals that Stacks’ total value locked (TVL) has reached an all-time high of $70.41 million. 

This represents a significant increase of over 400% in just four months, highlighting the growing confidence and demand for Stacks within the decentralized finance (DeFi) ecosystem.

As the demand and interest in the protocol and its native token continue to grow, whether Stacks will surpass its previous all-time high or experience a correction remains to be seen. 

The notable correlation between STX and BTC suggests that Bitcoin’s retracement from its current two-year high could also impact the price of STX.

However, the token has significant interest, as reflected in the highlighted metrics above. With the anticipated bull run gaining momentum leading up to the Bitcoin halving event, STX has the potential to reach even higher levels and climb the crypto rankings within the industry.

Observing how the STX price reacts in the coming days and weeks will be interesting. While uncertainties exist, the token’s current high level of interest suggests a positive outlook for its future performance.

Featured image from Shutterstock, chart from TradingView.com 

Read More
Blockchain

Ethereum Price Close Above $2,700 Could Spark Larger Degree Rally

Ethereum price is consolidating gains above the $2,575 support. ETH could start a major rally if there is a close above the $2,700 resistance.

Ethereum is consolidating gains above the $2,575 support zone.
The price is trading above $2,620 and the 100-hourly Simple Moving Average.
There is a short-term breakout pattern forming with resistance at $2,640 on the hourly chart of ETH/USD (data feed via Kraken).
The pair could start a fresh increase if it stays above the $2,575 support zone.

Ethereum Price Eyes Another Increase

Ethereum price gained pace above the $2,600 level and traded close to the $2,700 resistance zone. ETH traded as high as $2,681 before it started a downside correction.

There was a move below the $2,640 and $2,620 levels. The price declined below the 23.6% Fib retracement level of the upward move from the $2,472 swing low to the $2,681 high, like Bitcoin. However, the bulls were active near the $2,600 zone.

Ethereum found support at $2,600 and is currently attempting a fresh increase. It is now trading above $2,620 and the 100-hourly Simple Moving Average.

Immediate resistance is near the $2,640 level. There is also a short-term breakout pattern forming with resistance at $2,640 on the hourly chart of ETH/USD. The first major resistance is near the $2,680 level. The next major resistance is near $2,720, above which the price might rise and test the $2,800 resistance.

Source: ETHUSD on TradingView.com

If the bulls remain in action, they could even push the price above the $2,800 resistance. In the stated case, the price could rise toward the $3,000 level.

Another Decline In ETH?

If Ethereum fails to clear the $2,640 resistance, it could start another decline. Initial support on the downside is near the $2,620 level.

The next key support could be the $2,600 zone. A clear move below the $2,600 support might send the price toward $2,575 or the 50% Fib retracement level of the upward move from the $2,472 swing low to the $2,681 high. The main support could be $2,550 or the 100 hourly SMA. Any more losses might send the price toward the $2,440 level.

Technical Indicators

Hourly MACDThe MACD for ETH/USD is gaining momentum in the bullish zone.

Hourly RSIThe RSI for ETH/USD is now above the 50 level.

Major Support Level – $2,600

Major Resistance Level – $2,640

Read More
Blockchain

Zcash To Enhance User Protection With Privacy-Focused Partnership

A partnership between privacy-focused projects Nym and Zcash was recently announced. The partnership aims to address some persisting issues in the sector to enhance user protection and data privacy in the Zcash ecosystem.

Data Leakage, A Challenging Issue

Electric Coin Company (ECC), the Zcash development organization, is collaborating with Nym, a privacy blockchain project focused on enhancing data confidentiality. The collaboration is possible through a Zcash Community Grants (ZCG) grant, as the project’s team announced on its X (former Twitter) account.

The partnership aims to address challenging user protection issues by integrating Nym’s mixnet into the Zcash ecosystem. Integrating with the Zcash light client libraries would allow the wallet developers to implement Nym mixnet’s privacy protection at their discretion.

1/6  Nym is happy to announce a grant from Zcash Community Grants to integrate the Nym mixnet with Zcash, and enhance privacy for Zcash users by protecting against metadata leaks.

— Nym (@nymproject) February 13, 2024

The goal, as the announcement explains, is for the integration process of Nym and Zcash to fill the gap in the network layer.  This gap allows the metadata of user’s transactions to be traceable and leaves the data vulnerable, which then presents a privacy problem for users, as the post explains:

Powerful adversaries can analyze traffic patterns such as the stream of TCP/IP packets used to submit transactions, which can then be used to de-anonymize users. ISPs can snoop on traffic patterns to passively record Zcash activity. And the growing crypto surveillance industry can passively spy on peer-to-peer traffic, as well as conduct active attacks.

Nym will work with Zcash’s already existing privacy-preserving infrastructure to “help provide an end-to-end protected solution for users’ privacy. Zcash uses zero-knowledge proofs to secure transaction privacy, but “even advanced privacy protections like Zcash’s auto-shielding feature are vulnerable at the network later.”

The Nym mixnet is a technology that prevents government, corporate, and criminal surveillance adversaries from tracing metadata by encrypting user data into sphinx packets and dispersing them across global ‘mix nodes’, making metadata patterns untraceable and ensuring online privacy:

The mixnet achieves this by splitting data into identically sized encrypted Sphinx packets and dispersing these in three hops to ‘mix nodes’ worldwide at randomized intervals. Next, the mixnet shuffles in dummy ‘cover’ traffic, further complicating tracing. Together these features make tracking metadata patterns impossible even for powerful adversaries with a global view of the network.

A Shared Vision: Privacy For Everyone

Nym and Zcash are privacy-focused projects that protect users’ rights to their personal information and transaction data. “It is an alienable right to a dignified life free from gross intrusion and interference,” said Harry Halpin, cofounder and CEO at Nym Technologies.

Halpin also commented on the state of the digital realm regarding privacy matters. The CEO believes that although intrusion and interference are the “normal state of affairs,” a change is needed. “With this groundbreaking integration, Nym and Zcash are working to make real privacy online a reality,” he concluded.

Josh Swihart, CEO of ECC, expressed his positive outlook on the partnership, reaffirming that network-level privacy has been a “missing piece since Zcash’s inception.” He believes that privacy ecosystems coming together will only “deepen protections from everyday users to protect their financial privacy.”

Global regulators have scrutinized privacy-focused projects and accused them of enabling criminal activity. Last year, Zcash (ZEC), alongside other privacy coins like Monero (XMR), was announced to be delisted from Binance, the largest crypto exchange in the world, in four European countries. Similarly, Binance recently announced its plan to delist Moreno in the US amid regulatory pressure.

Read More
Blockchain

Inflationary Concerns Rise As US CPI Exceeds Predictions, Bitcoin Price Reacts

The latest US inflation data significantly impacted the Bitcoin price and most of the cryptocurrency market, with some exceptions. According to a report from the Labor Department, inflation rose more than expected in January, driven by higher shelter prices.

Furthermore, the consumer price index (CPI), which measures the prices consumers face for goods and services across the economy, saw a 0.3% increase for the month. On a 12-month basis, the CPI stood at 3.1%, slightly lower than December’s 3.4%.

Bitcoin Price Retreats Amid Higher-Than-Expected CPI Figures

According to recent reports, the higher-than-expected CPI figures could pose challenges for the Federal Reserve (Fed), as officials anticipate inflation to recede and reach their 2% annual target. The central bank aims to adjust monetary policy, which has been tight over two decades. 

However, the January increase in inflation may delay the Fed’s plans to ease rates, as it will require more data before initiating a rate-cutting cycle. This outcome disappointed those who expected inflation to decrease and prompted a reassessment of the timing for potential rate adjustments.

On this matter, market intelligence platform Santiment reported that the 3.1% CPI result caused market cap losses in cryptocurrency and equities markets. The Bitcoin price, which had breached the $50,000 mark for the first time in over two years, has fallen below $49,000 in response. 

According to the crypto platform’s analysis, this mild retrace will likely polarize crowd sentiment, potentially leading to significant panic sales. In such a scenario, the justification for dip buying becomes more viable, but sentiment may turn negative. 

Bitcoin’s Market Cycle Patterns

Market expert Crypto Con has identified a striking pattern in Bitcoin’s market cycles, specifically concerning the 20 Week Exponential Moving Average (EMA). Despite mounting concerns regarding inflation data, the analysis suggests that the Bitcoin price behavior tends to follow a consistent six-step pattern, with significant implications for support and potential correction levels.

According to Crypto Con’s analysis, Bitcoin’s price movement in each market cycle has adhered to a similar pattern involving the 20-week EMA. The pattern unfolds as follows: 

First, as seen in the chart below, the Bitcoin price breaks above the moving average, marking the beginning of a new cycle and a notable uptrend. However, after the completion of the initial run, the price retraces and falls below the moving average, signaling a temporary shift in sentiment.

Despite the temporary setback, Bitcoin’s price then breaks above the moving average once more, indicating the start of a true rally and resumption of the upward trend. At this stage, price action creates a false retest of support, narrowly missing the moving average as a crucial support level. This false retest is a common occurrence in Bitcoin’s market cycles.

Following the false retest, Bitcoin embarks on a second run, representing a further advancement in the market cycle. Bitcoin’s price is currently positioned during this phase. 

According to the analysis made by Crypto Con, the full correction in Bitcoin’s price may not need to be as deep, as the moving average currently sits at approximately $40,000. 

Ultimately, the analysis’s suggestion that the Bitcoin price may not dip below the $40,000 level during the ongoing bull run, even in the face of anticipated corrections, is particularly encouraging for bullish investors. 

Bitcoin is trading at 48,600, down 3% in the last 24 hours.

Featured image from Shutterstock, chart from TradingView.com

Read More
Blockchain

Bitcoin Price Holds Support, BTC Uptrend To Continue Soon?

Bitcoin price started a downside correction from the $50,400 zone. BTC tested $48,250 and is currently attempting a fresh increase above $50,000.

Bitcoin price is holding gains above the $48,250 and $48,500 support levels.
The price is trading above $48,850 and the 100 hourly Simple moving average.
There is a key bullish trend line forming with support at $48,750 on the hourly chart of the BTC/USD pair (data feed from Kraken).
The pair could continue to move up if it clears the $50,000 resistance zone.

Bitcoin Price Remains Supported

Bitcoin price gained pace above the $48,800 resistance zone. BTC even spiked above the $50,000 resistance zone before the bears appeared. A new multi-week high was formed near $50,339 before the price corrected lower.

There was a move below the $49,500 and $49,200 levels. The price even dived below $49,000, but the bulls were active above the $48,250 support. A low was formed near $48,240 and the price is now moving higher. There was a move above the $48,800 zone.

Bitcoin cleared the 50% Fib retracement level of the recent decline from the $50,390 swing high to the $48,240 low. It is now trading above $48,850 and the 100 hourly Simple moving average.

There is also a key bullish trend line forming with support at $48,750 on the hourly chart of the BTC/USD pair. Immediate resistance is near the $49,880 level or the 76.4% Fib retracement level of the recent decline from the $50,390 swing high to the $48,240 low.

Source: BTCUSD on TradingView.com

The next key resistance could be $50,000, above which the price could start another decent increase. The next stop for the bulls may perhaps be $50,400. A clear move above the $50,400 resistance could send the price toward the $51,200 resistance. The next resistance could be near the $52,000 level.

Another Decline In BTC?

If Bitcoin fails to rise above the $50,000 resistance zone, it could start another downside correction. Immediate support on the downside is near the $49,200 level.

The first major support is $48,800 and the trend line. If there is a close below $48,800, the price could gain bearish momentum. In the stated case, the price could dive toward the $47,800 support.

Technical indicators:

Hourly MACD – The MACD is now gaining pace in the bullish zone.

Hourly RSI (Relative Strength Index) – The RSI for BTC/USD is now above the 50 level.

Major Support Levels – $49,000, followed by $48,750.

Major Resistance Levels – $50,000, $50,400, and $51,200.

Read More
Blockchain

Behind Ethereum’s Surge: Here’s How This Whale Is Taking Advantage Of The ETH Rally

In recent weeks, Ethereum has witnessed a noticeable uptick in its market price, reaching a one-month high and showcasing a growing demand for the asset. Amid this development, the on-chain analytics platform Lookonchain revealed an Ethereum whale’s noteworthy strategy, marking a bold stance on Ethereum’s future trajectory.

Strategic Accumulation Amid Rising Prices

According to Loookonchain, an unknown whale has been actively increasing their Ethereum holdings, utilizing the Spark platform’s revolving loan feature. Spark platform is a decentralized finance (DeFi) product that enables users to borrow stablecoins like USDC or DAI against their cryptocurrency holdings.

This investor has managed to withdraw 39,900 ETH worth roughly $99.5 million from major exchanges such as Binance, Bybit, OKEx, and Bitfinex, leveraging the flexibility of revolving loans to boost their position in Ethereum.

Further insights from Lookonchain reveal that these withdrawals by the whale represent a continuous strategy rather than an isolated event. Since the start of the month, the whale has consistently been pulling out ETH, averaging a withdrawal price of $2,492, and has secured about 56.8 million DAI in loans from the Spark platform so far.

A whale is accumulating $ETH and going long $ETH by revolving loans on #Spark!

The whale has withdrawn 39.9K $ETH($99.5M) from #Binance, #Bybit, #OKEx and #Bitfinex since Feb 1 at an average price of $2,492, and borrowed 56.8M $DAI from #Spark.https://t.co/9EQSrwHnJD pic.twitter.com/6CydURt2pc

— Lookonchain (@lookonchain) February 13, 2024

While bold, this strategy highlights the optimism surrounding Ethereum’s potential growth, especially in anticipation of the upcoming altcoin bull run and the expanding interest in Ethereum-based investment products like the spot exchange-traded funds (ETFs).

Spotlight On Ethereum Spot ETFs

While the United States Securities and Exchange Commission (SEC) is yet to disclose any latest update on the already filed applications of the spot Ethereum ETFs, asset manager Franklin Templeton has recently jumped on the spot ETH ETF queue.

A recent post by James Seyffart, an experienced analyst at Bloomberg Intelligence, highlights that Franklin Templeton has joined the ranks as the eighth firm in the cryptocurrency sector to apply for product authorization.

This follows submissions by other prominent asset managers for Ethereum ETFs, namely Hashdex, BlackRock, Fidelity, Ark and 21Shares, Grayscale, VanEck, Invesco, and Galaxy.

Here’s the most recent table of other filers that I have pic.twitter.com/xCRRMwK76r

— James Seyffart (@JSeyff) February 12, 2024

These developments come when Ethereum has sustained a positive momentum, closely tracking Bitcoin’s performance. The asset has witnessed more than 10% surge in the past week, maintaining this upward trend with an additional nearly 1% increase in the past 24 hours.

This price performance has elevated Ethereum to a current trading value of $2,614 as of this writing.

Featured image from Unsplash, Chart from Tradingview

Read More