Crypto Corner Café

Taste The Future

Blockchain

Blockchain

Litecoin Stuck In A Rut: Will Bullish Momentum Or Bearish Pressure Prevail?

Litecoin (LTC) has spent the past week trading within a tight price range, with its value hovering steadily around the mid-range point of $64. The price action for LTC in September has remained primarily bearish, with sellers maintaining control over the market. 

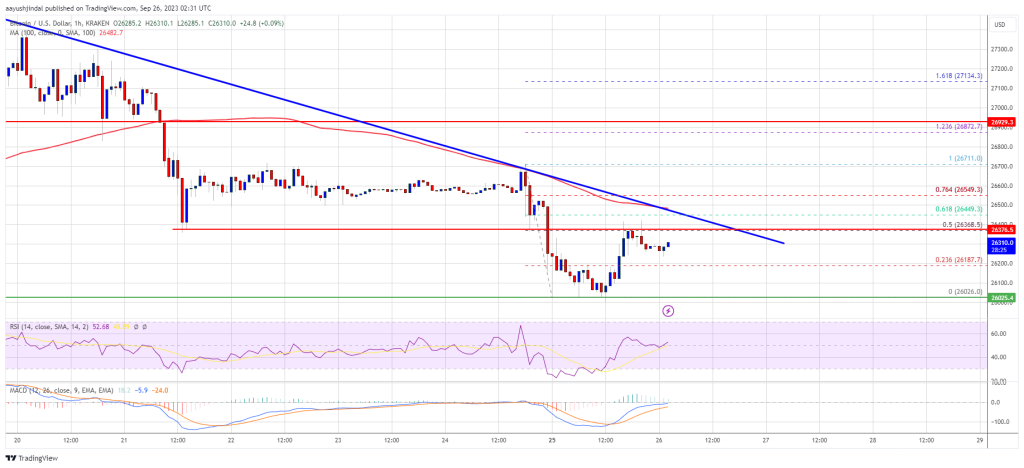
While LTC has a history of volatile price swings, recent times have seen it mirroring the sideways movement of the overall market, largely influenced by Bitcoin’s fluctuations, which rose from $25,000 to $27,000 before dropping to $26,000.

As of the latest data from CoinGecko, Litecoin is currently trading at $64.63, with a 24-hour gain of 0.7%. However, over the past seven days, LTC has experienced a decline of 2.9%, reflecting the prevailing bearish sentiment in the market, according to a recent price report.

Chasing Litecoin Bulls and Avoiding The Bears

For those looking for a bullish revival in Litecoin’s price,  a price report notes that the key level to watch is the 23.6% Fibonacci retracement level, which stands at $69. Breaking above this level could open the door for further gains, with potential targets lying at $78 and $80.

On the other hand, if the flat trading volume persists, bears may exert further pressure, potentially leading to a drop in LTC’s price to the $60 mark.

Market speculators have not been particularly enthusiastic about Litecoin’s recent sideways movement. The Open Interest (OI) for LTC has continued to decline, with data from Coinalyze indicating a $9 million drop within the past 48 hours. This suggests that traders and investors are becoming increasingly cautious as they monitor the developments in the Litecoin market.

Litecoin’s Investment Appeal in Q3/Q4

Despite the recent lackluster performance, some analysts believe that Litecoin remains an attractive investment opportunity in the third and fourth quarters of this year. Litecoin’s established reputation, solid ecosystem, and upcoming halving events are factors that contribute to its appeal.

Halving events have historically had a positive impact on Litecoin’s price, reducing the rate at which new LTC coins are mined and potentially increasing scarcity.

Market participants are closely watching the 23.6% Fibonacci retracement level at $69 for signs of a bullish revival, while a continuation of flat trading volume could see LTC drop to $60.

Despite recent market concerns, Litecoin’s strong fundamentals and upcoming halving events make it an investment opportunity worth considering as we move into the later part of the year.

(This site’s content should not be construed as investment advice. Investing involves risk. When you invest, your capital is subject to risk).

Featured image from Invest Right

Read More
Blockchain

XRP Price Prediction – Will Recent Correction Trend Push XRP Under $0.50?

Ripple’s token price is holding gains above $0.50 against the US Dollar. XRP price could take a hit if it fails to recover above $0.512.

Ripple’s token price is attempting a fresh increase above $0.508 and $0.512 against the US dollar.
The price is now trading above $0.500 and the 100 simple moving average (4 hours).
There is a major contracting triangle forming with resistance near $0.505 on the 4-hour chart of the XRP/USD pair (data source from Kraken).
The pair might gain bullish momentum if there is a close above $0.512.

Ripple’s Token Price Holds Key Support

In the last XRP price prediction, we discussed the chances of more gains in Ripple’s XRP against the US Dollar. The price did climb above the $0.515 resistance level, but upsides were limited, like Bitcoin and Ethereum.

The price struggled to clear the $0.525 resistance. A high was formed near $0.5254 and the price saw a downside correction. There was a move below $0.512 and a spike below $0.50. A low is formed near $0.4907 and the price is now consolidating.

It is back above the 23.6% Fib retracement level of the recent decline from the $0.5254 swing high to the $0.4907 low. XRP price is also trading above $0.500 and the 100 simple moving average (4 hours).

On the upside, immediate resistance is near the $0.508 level. Besides, there is a major contracting triangle forming with resistance near $0.505 on the 4-hour chart of the XRP/USD pair. The triangle resistance coincides with the 50% Fib retracement level of the recent decline from the $0.5254 swing high to the $0.4907 low.

Source: XRPUSD on TradingView.com

The next major resistance is near the $0.5120 level. A close above the $0.512 level could send the price toward the $0.525 barrier. A successful break above the $0.525 resistance level might start a strong rally toward the $0.555 resistance. Any more gains might call for a test of the $0.580 resistance.

Downside Break in XRP?

If ripple fails to clear the $0.512 resistance zone, it could start another decline. Initial support on the downside is near the $0.50 zone and the 100 simple moving average (4 hours).

The next major support is at $0.490. If there is a downside break and a close below the $0.490 level, XRP’s price could extend losses. In the stated case, the price could retest the $0.460 support zone.

Technical Indicators

4-Hours MACD – The MACD for XRP/USD is now losing pace in the bullish zone.

4-Hours RSI (Relative Strength Index) – The RSI for XRP/USD is now below the 50 level.

Major Support Levels – $0.500, $0.490, and $0.460.

Major Resistance Levels – $0.508, $0.512, and $0.525.

Read More
Blockchain

Ethereum Price Hints At Potential Correction But Faces Uphill Task

Ethereum price is attempting a recovery wave from $1,565 against the US Dollar. ETH could struggle to recover above $1,600 and might resume its decline.

Ethereum is slowly moving higher toward the $1,600 resistance zone.
The price is trading below $1,600 and the 100-hourly Simple Moving Average.
There is a major bearish trend line forming with resistance near $1,595 on the hourly chart of ETH/USD (data feed via Kraken).
The pair could start a fresh decline if it fails to clear the $1,600 resistance zone.

Ethereum Price Struggles Below $1,600

Ethereum’s price started a fresh decline below the $1,620 and $1,600 levels. ETH even declined to a new weekly low below the $1,580 level, unlike Bitcoin.

It traded as low as $1,565 and recently started a short-term upside correction. There was a move above the $1,580 level. The price climbed above the 50% Fib retracement level of the recent drop from the $1,600 swing high to the $1,565 low.

However, the bears are still active near the $1,600 resistance. The price is struggling to clear the 76.4% Fib retracement level of the recent drop from the $1,600 swing high to the $1,565 low.

Ether is now trading below $1,600 and the 100-hourly Simple Moving Average. There is also a major bearish trend line forming with resistance near $1,595 on the hourly chart of ETH/USD. On the upside, the price might face resistance near the $1,595 level.

Source: ETHUSD on TradingView.com

The next major resistance is $1,600. A push above $1,600 might send Ethereum toward $1,620. If the bulls succeed in clearing the $1,620 hurdle, the price could start a decent increase toward the $1,650 resistance. Any more gains might open the doors for a move toward $1,700.

More Losses in ETH?

If Ethereum fails to clear the $1,600 resistance, it could start another decline. Initial support on the downside is near the $1,580 level.

The next key support is $1,565, below which the price could test the $1,540 support. A downside break below $1,540 might push the price further into a bearish zone. In the stated case, there could be a drop toward the $1,500 level.

Technical Indicators

Hourly MACDThe MACD for ETH/USD is losing momentum in the bearish zone.

Hourly RSIThe RSI for ETH/USD is now above the 50 level.

Major Support Level – $1,565

Major Resistance Level – $1,600

Read More
Blockchain

Bitcoin Price Turns Vulnerable As Indicators Point To More Weakness

Bitcoin price is struggling below the $26,500 resistance. BTC could accelerate lower if there is a close below the $26,000 support in the near term.

Bitcoin is struggling and trading well below the $27,500 resistance.
The price is trading below $26,500 and the 100 hourly Simple moving average.
There is a key bearish trend line forming with resistance near $26,420 on the hourly chart of the BTC/USD pair (data feed from Kraken).
The pair could resume its decline unless there is a close above the $26,500 level.

Bitcoin Price Faces Hurdles

Bitcoin price started a fresh decline below the $26,800 level. BTC traded below the $26,500 and $26,200 support levels to move into a negative zone.

Finally, the pair tested $26,000 and a low was formed near $26,026. Recently, the price started a minor recovery wave above the $26,200 level. The price climbed above the 23.6% Fib retracement level of the recent drop from the $26,712 swing high to the $26,026 low.

However, the bears are protecting a break above the $26,500 resistance. The price is struggling to clear the 50% Fib retracement level of the recent drop from the $26,712 swing high to the $26,026 low.

Bitcoin is now trading below $26,500 and the 100 hourly Simple moving average. Immediate resistance on the upside is near the $26,400 level. There is also a key bearish trend line forming with resistance near $26,420 on the hourly chart of the BTC/USD pair.

Source: BTCUSD on TradingView.com

The next key resistance could be near the $26,500 level, above which the price could gain bullish momentum. In the stated case, the price could climb toward the $27,000 resistance. Any more gains might call for a move toward the $27,500 level.

More Losses In BTC?

If Bitcoin fails to start a fresh increase above the $26,500 resistance, it could continue to move down. Immediate support on the downside is near the $26,150 level.

The next major support is near the $26,000 level. A downside break and close below the $26,000 level might start another major decline maybe toward the next support at $25,400. Any more losses might call for a test of $25,000.

Technical indicators:

Hourly MACD – The MACD is now losing pace in the bearish zone.

Hourly RSI (Relative Strength Index) – The RSI for BTC/USD is now below the 50 level.

Major Support Levels – $26,150, followed by $26,000.

Major Resistance Levels – $26,400, $26,500, and $27,000.

Read More
Blockchain

NEAR Protocol’s Daily Active Addresses Spike, Will Prices Follow?

In the past month, there have been more daily active addresses on the NEAR Protocol than in Ethereum and its layer-2 protocols, including Arbitrum and OP Mainnet, Artemis data from September 25 reveals.

Artemis, an institutional data platform for digital assets, shows that the number of daily active addresses on NEAR Protocol has been consistently above the 400,000 level in September. 

Daily Active Addresses On NEAR Protocol Surging

Looking closer at the data confirms that the number of daily active addresses on Ethereum, the pioneer smart contract platform that hosts most decentralized finance (DeFi) and non-fungible token (NFT) activity, has been dropping.

To illustrate, the number of daily active on Ethereum rose above 1 million in mid-September but has since more than halved to below 400,000. The same trend can be seen in Arbitrum, which dropped from around 200,000 in late June to 150,000 when writing on September 25.

During this time, NEAR Protocol’s daily active addresses have rapidly spiked from around 40,000 in late June to above 400,000, outperforming Ethereum in this metric. With rising daily active addresses, there has been a spike in daily transactions over the past month. According to trackers, the NEAR Protocol processes more transactions than Ethereum.

Public ledgers like NEAR Protocol and Ethereum depend on a community of users who actively transact—moving value or running protocols—or validators- to secure the network. However, the number of daily active addresses can provide valuable insights into the level of adoption, user engagement, and the network’s overall health.

Besides user engagement, rising daily active addresses might also point to changing market sentiment, which could significantly impact prices.  

Bears In Control As DEX Trading Volume Remains Relatively Stable

When writing, NEAR, the native token of the NEAR Protocol, is trading at around 2023 lows. Changing hands at $1.107, the coin is down 61% from 2023 highs and remains under pressure.

The candlestick arrangement in the daily chart points to consolidation and stability above the primary resistance level at $1. Bears have the upper hand if prices remain below $1.23, a critical resistance level marking the August 17 highs.

As evidence shows, the network activity and price action diverge. Although the transaction count also rose, the number of unique addresses interacting with NEAR Protocol decentralized exchanges has mostly been stable. Looking at the numbers, DEX volume on the platform is significantly lower than those registered in Ethereum and its popular layer-2 platforms.

Read More
Blockchain

Cardano: Factors That Could Drive ADA Price As High As $12

The Cardano community has been one of the fastest-growing in the crypto space and this has shone a heavy spotlight on the ADA price. With expectations mounting already even amid the crypto winter, there are key factors that stakeholders believe could drive the altcoin’s price as high as $12.

ADA Price Could Reach $12

In the last bull market, the ADA price went on a tremendous rally that saw the coin rise from as low as $0.03 to as high as $3.10 at its peak. This price action cemented the token as one of the winners of the bull, and some investors believe that the coin could be poised for another repeat of this price action. One X (formerly Twitter) user has given some points as to why this could be the case.

In the post, the user points to the current state of interaction and sentiment in the crypto market right now, which they refer to as brutal. However, they do not believe that this will always be the way things will be. According to the user, a quick change in the interaction and sentiment would lead to a rapid price increase.

At this point, they believe that most investors will end up entering the asset at a much higher price of $3 and above. This would put it at its previous all-time high. However, it doesn’t end there. They put forward that at the end of the next bull market, the ADA price would be between $8 and $12.

$ADA will be a top mover in the bull mrkt once again

But most will be jumping in above $3

Interaction & sentiment out here in #crypto is brutal at this point

But this will change very quickly –
and when it does there will be drastic price movements that most won’t be able…

— ADA WON’T BE UNDERVALUED FOREVER (@ADA_ONEVETCOTI) September 23, 2023

As with any forecast, a timeframe is often asked and they responded that they expect this to happen in the second quarter of 2025. This would coincide with the current 4-year cycle that usually sees prices of cryptocurrencies topping out by Q2 and Q3.

Cardano Is In Better Shape

A prominent Cardano influencer has also painted a bullish picture for the digital asset. @cardano_whale, an account that boasts over 137,000 followers on X, said in a tweet that the Cardano network is currently in better shape than it has ever been.

They urged investors who have been increasingly critical of the network to think if they are that way because they are projecting their emotions from the ADA price action onto the network itself. “If you’ve noticed yourself become increasingly negative about it over the last year or so, consider that you might just be projecting emotions from price action onto it,” the post read.

Although ADA has not seen the most impressive performance, it has not deterred bullish predictions from analysts. One analyst explained that ADA at $0.25 was a prime accumulation price and that the price of the digital asset could climb as high as $5.

Read More
Blockchain

Huobi Hacked For $8 Million Worth Of ETH, Offers Hacker 5% Bounty

According to Arkham Intel, the Huobi crypto exchange platform (HTX) fell victim to a hacking incident resulting in the theft of 5000 ETH, valued at approximately $8 million. The hacker reportedly moved 1,000 ETH to a separate wallet, 0x799, shortly after compromising the platform and has since remained silent.

Huobi Resolves Breach, Offers Hacker Lucrative Deal For Stolen ETH

Justin Sun, the Founder of TRON and an Advisor to Huobi, confirmed the incident on X (formerly Twitter), stating that HTX suffered a loss of 5,000 ETH due to the hack. Sun stated:

HTX has suffered a loss of 5,000 ETH ($8 million USD) due to a hacker attack. HTX has fully covered the losses incurred from the attack and has successfully resolved all related issues. All user assets are SAFU and the platform is operating completely normally.

Sun reassured users that HTX had fully covered the losses and resolved all related issues. He emphasized that user assets were secure and that the platform operated normally. 

According to Sun, the stolen amount of $8 million represents a relatively small fraction compared to the $3 billion worth of assets held by HTX users and is equivalent to just two weeks’ revenue for the platform.

Sun further stated that the hack was detected immediately after the incident on September 24th. HTX swiftly took action to prevent further losses and promptly addressed all issues, restoring the platform to its normal state immediately. Trading operations have continued without interruption.

Notably, as an incentive for the hacker to return the stolen funds, HTX offers a 5% white hat reward of $400,000. Additionally, if the hacker returns the funds, they will be considered for a position as a security white hat advisor for HTX. On this matter, Sun claimed: 

We are willing to offer 5% of the stolen amount (400,000 USD) as a white hat reward to encourage the hacker to return the stolen funds. If the hacker returns the funds, we will also hire them as a security white hat advisor for HTX.

However, if the hacker fails to return the funds within seven days, HTX will transfer the information to law enforcement authorities for further action and potential prosecution.

Overall, Justin Sun’s statement regarding the recent hack suffered by Huobi’s HTX platform reassured users that the losses incurred had been fully covered and all related issues had been successfully resolved.

The native token of the exchange, HT, is currently trading at $2.44, reflecting a 1.3% decline in the past 24 hours following the revelation of the hack that occurred on Sunday. 

Featured image from Shutterstock, chart from TradingView.com 

Read More
Blockchain

Crypto’s Six-Week Bleed Out: XRP And Solana Defy The Outflow Downtrend

With contrasting events in the industry, crypto investment products have witnessed a continuous outflow for the sixth week. Some altcoins demonstrate resilience in this trend, defying the broader market sentiment.

Dissecting The Crypto Outflow Trend

Crypto funds have witnessed a net outflow of $9 million in the past week, taking the total to roughly $464 million over the last ten weeks, according to Coinshares’ latest digital asset fund flow weekly report.

Relevant digital asset management players like CoinShares, Grayscale, 21Shares, Bitwise, and ProShares have felt the heat of this ongoing trend.

To put things into perspective, the outflows have cooled from the previous week’s $54 million, but they still extend the continuous ten-week streak of net capital movement away from these products.

A closer look into the report reveals this trend isn’t uniform across regions. Europe has somewhat resisted this wave, recording inflows of $16 million. James Butterfill, Research Head at CoinShares, pinpoints the regional sentiment divergence to varying reactions to the regulatory environment.

According to Butterfill, European investors see the “recent regulatory disappointment as an opportunity,” while their US counterparts have pulled out $14 million, possibly due to dismay over recent events.

Moreover, trading volumes in crypto funds have reflected the same caution. From exceeding $1 billion in the previous week, the volume plunged to $820 million, substantially less than the yearly average of $1.3 billion.

Not All Assets Feel The Pinch

Bitcoin, the flag bearer of crypto, hasn’t been immune to this trend, registering outflows for three consecutive weeks, with a dip of $6 million in the past week alone. Interestingly, Short-Bitcoin products, which gain when Bitcoin prices fall, have seen outflows of $2.8 million.

This suggests a larger narrative where investors may unwind their bearish bets on Bitcoin. According to Butterfill, this outflow signifies a reduction of 78% in those assets under management over the past 22 weeks.

Ethereum, another heavyweight in the crypto arena, has also felt the pinch, with outflows recorded for six weeks consecutively, resulting in a recent reduction of $2.2 million.

In contrast to the major players, XRP and Solana are bright spots in the market. This week, they registered inflows of $660,000 and $310,000, respectively. Interestingly, this isn’t the first time these two altcoins have shone amidst the gloom.

Last week, both assets witnessed significant inflows. Solana led the way with $700,000, followed by Cardano and XRP, which attracted inflows of $400,000 and $100,000, respectively.

While Cardano didn’t cut notable inflows this week, XRP and Solana’s positive inflows amid broader negativity suggest a selective and value-driven approach by some investors in the altcoin market, according to the report. 

Meanwhile, despite their recorded upward capital movements, XRP and Solana still feel the brunt of the global crypto market downturn.

Particularly, both assets have been in red, with XRP down by 1.5% in the past day with a current price of $0.50 and Solana seeing a slight 0.5% upward move over the same period with a trading price of $19.60 at the time of writing.

Featured image from iStock, Chart from TradingView

Read More
Blockchain

MicroStrategy Expands Bitcoin Holdings with $147.3 Million Purchase

In a strategic move, MicroStrategy, the business intelligence (BI) company, and its subsidiaries have made a bold financial maneuver by increasing their Bitcoin (BTC) holdings. 

MicroStrategy Bolsters BTC Holdings

According to a recent filing with the US Securities and Exchange Commission (SEC), MicroStrategy has expanded its Bitcoin holdings by acquiring an additional 5,445 BTC, totaling approximately $147.3 million. The average purchase price for these Bitcoins was $27,053 per unit.

With this latest acquisition, MicroStrategy’s total Bitcoin holdings now stand at 158,245 BTC. The company has accumulated this substantial amount of digital assets at an average price of around $29,582 per Bitcoin, equivalent to approximately $4.68 billion.

According to the company, these acquisitions underscore MicroStrategy’s commitment to Bitcoin and long-term belief in its potential. The company has been actively accumulating Bitcoin over time, establishing itself as a major participant in the cryptocurrency market.

In contrast, MicroStrategy’s stock, listed as MSTR on the Nasdaq, has followed a prolonged downward trend since July 13th.

As of the latest trading session, the stock is currently priced at $321.25, reflecting a decrease of 0.14% since the stock market’s opening. 

Notably, the stock’s performance has exhibited a significant correlation with the value of Bitcoin over the same period, as both have experienced declines.

Furthermore, MicroStrategy’s decision to expand its Bitcoin portfolio coincides with a consolidation phase in the cryptocurrency market. Bitcoin has been trading between $25,000 to $27,000 since August 16.

The largest cryptocurrency in the market is valued at $26,200, representing a 1.5% decline over the past 24 hours and a decrease of over 4% over the past seven days.

Bitcoin Bearish Fractal Holds Strong

Renowned crypto analyst Rekt Capital suggests that the bearish Bitcoin fractal, previously highlighted by NewsBTC, remains intact, raising whether the cryptocurrency is still in Phase A-B or has transitioned to Phase B-C, as seen in the chart below.

According to Rekt Capita, Bitcoin typically forms a new lower high in Phase A-B, and recent price movements, whether reaching around $29,000 or as low as $27,400, satisfy this criterion. 

However, a more pronounced lower high is possible if the support level of $25,000 to $26,000 is broken and the Bull Market Support Band becomes resistant.

For Phase B-C to commence, two conditions need to be met. Firstly, a relief rally must occur, confirming a new lower high. Secondly, the $25,000 to $26,000 support area must be lost. 

Although a relief rally forming a new lower high has been witnessed recently, the second condition remains unfulfilled. Phase B-C will be initiated if the $25,000 to $26,000 support area fails.

Several key technical events are anticipated. During the downward movement, Bitcoin may briefly touch the $25,000 to $26,000 area. If the price struggles to surpass $26,000 and acts as resistance, it could indicate weakening support in the $25,000 to $26,000 range. 

In such a case, a collapse to the $22,000 to $24,000 region might occur to establish a local bottom denoted as “C.”

To invalidate the bearish Bitcoin fractal, three criteria need to be met. Firstly, the Bull Market Support Band must be held as support. Secondly, a weekly close above the lower high resistance is required. Finally, breaching the yearly high of $31,000 would further challenge the bearish scenario.

Featured image from Shutterstock, chart from TradingView.com 

Read More
Blockchain

$200 Million In Crypto Lost As Mixin Network Comes Under Attack

Decentralized finance peer-to-peer service Mixin network, experienced an attack on Saturday, September 23, 2023, leading to $200 million worth of crypto funds lost as a result of the attack.

$200 Million In Crypto Lost In The Attack

The decentralized finance (DeFi) network Mixin network revealed that the attack was caused by a compromise in the network’s cloud service provider database. The attack reportedly led to a loss of approximately $200 million worth of crypto funds stolen from its mainnet.

Blockchain security platform Peckshield conducted a separate investigation and it was revealed that Mixin network’s total portfolio accounted for approximately $141 million as at the time of the attack.

According to the announcement made by the Mixin team on X on Sunday, September 24, 2023, the attack happened during the early hours of September 23, 2023, Hong Kong time. The Mixin network immediately suspended deposits and withdrawals to prevent more losses.

However, the Mixin team has assured its users that these services are expected to resume once all vulnerabilities are thoroughly checked and fixed, but in the meantime, transfers are not affected during the period of suspension.

In addition, the Mixin team stated that once these vulnerabilities are determined, an announcement will be made later concerning a solution for handling the lost funds. 

The Mixin team stated that the exchange’s founder Feng Xiaodong will throw more light on the alleged attack on September 25, 2023, in a public Mandarin live stream at 13:00 Hong Kong Time, of which an English version is also expected to come afterwards to cover a wider audience.

So far, the exchange has contacted Google and blockchain security company Slowmist to aid in the investigation of the attack. SlowMist also took to X to announce its assistance in the investigation of the attack following a security alert post on September 24, 2023.

Mixin is a decentralized network service that offers a high-speed peer-to-peer transactional network for digital assets, which enables other blockchain ledgers to gain high transactions in seconds, and faster transaction confirmations, with low transaction fees. 

However, it is believed that Mixin which is a decentralized network depended on a centralized database for its network and that led to its vulnerabilities.

Mixin Founder Throws More Light On The Attack

As promised by the Mixin team that its founder would throw more light on the alleged attack on September 25, 2023, in a Mandarin live stream at 13:00 HKT, the exchange kept its word.

During the live stream, Mixin founder Feng Xiaodong stated that the exchange can only guarantee the safety of half of its user’s assets from the affected $200 million worth of crypto assets.

“No matter what your assets are — whether it’s Bitcoin or Ethereum — we will ensure that half of it is unaffected, We are trying to find a way to recover the compromised money, but that is very difficult,” Feng stated.

However, for the other half of the funds, Feng added that the Mixin team will issue “bond tokens” for its users to claim which the exchange intends to buy these tokens back from its users in the future. This way, the users get back their funds.

Nevertheless, the exchange has promised to establish a new system to host user’s assets with enhanced security measures.

Read More