Crypto Corner Café

Taste The Future

Blockchain

Blockchain

Bonds Out, Bitcoin In? Bloomberg Analyst Predicts Major Portfolio Shifts

In a comprehensive evaluation of global market dynamics, Bloomberg Intelligence analyst and Chartered Market Technician (CMT) Jamie Coutts has opined on the shifting sands of financial asset volatility. With bonds potentially falling out of favor and Bitcoin cementing its place as a debasement hedge, traditional portfolio models may be on the verge of a renaissance.

Major Portfolio Shift Towards Bitcoin?

Coutts tweeted, “It looks like we are about to see a substantial uptick in volatility across all markets, given where yields, USD, & global M2 are heading. Despite what lies ahead, there has been a big shift in the volatility profiles of global assets vs. Bitcoin over the past years.”

A comparative analysis by Coutts highlighted that since 2020, the volatility profiles of Bitcoin and Gold have declined, while most other assets have seen an increase in volatility.

His breakdown indicates that the traditional 60/40 portfolio volatility is up by 90%, NASDAQ’s volatility has surged by 53%, and global equity volatility rose by 33%; meanwhile, only Bitcoin’s volatility decreased by 52% as well as Gold’s volatility, which went down by 6%

Coutts further elaborated that following the “hyper-volatile” phase of Bitcoin during 2011-14, the cryptocurrency’s volatility has been on a downward trajectory. From a peak above 120 in early 2018, this metric currently stands at 26.39.

However, Coutts maintains skepticism over Bitcoin’s short-term prospects given the deteriorating macro environment: “Given that BTC volatility is near the bottom of the range plus a deteriorating macro environment: US dollar (DXY) is up, 10Y Treasury Yield is up, Global M2 money supply is up. It’s difficult to see how BTC (& all risk assets) can hold up with this setup.”

BTC Vs. Global Asset Classes

On the bright side, from an asset allocation perspective, Coutts considers the real question to be whether “Bitcoin can add value as a risk diversifier & improve risk-adjusted returns.” Comparing the risk-adjusted returns using the Sortino ratio during the last bear market, Bitcoin’s performance is not the best.

In the 2022 bear market, Bitcoin’s Sortino ratio is -1.78, positioning BTC above global equities, the NASDAQ 100, and the traditional 60:40 portfolio. However, it trails the S&P 500 (-1.46), European Equities (-1.01), Gold (+0.1), Silver (+0.28), and commodities (+1.25).

Elaborating on the cyclical behavior of Bitcoin, Coutts added, “The problem with BTC is the relatively short history makes inferences difficult and 1 year periods are certainly not significant. The best we can go on is multiple cycles. It’s clear that holding over the full cycle has been a winning strategy.”

Evaluating the Sortino ratio over the past three Bitcoin cycles (2013-2022), Coutts found Bitcoin to lead with a score of 2.46, outperforming the NASDAQ 100 (+1.37), S&P 500 (+1.25), and global equities (+1.05).

BTC: Top Bet Against Money Printing

In this scenario, Debasement concerns further enhance Bitcoin’s proposition. Coutts emphasized this saying, “And if allocators want to outpace monetary debasement, over most timeframes, bonds are not the place to be.” He identified Bitcoin as the foremost choice for portfolio reallocation against monetary debasement.

Citing the vast difference between asset returns concerning money supply growth (M2) over the past 10 years, he highlighted Bitcoin’s dominance with a staggering ratio of +8,598, followed by NASDAQ (+109), S&P 500 (+25) and global equities (-7.5).

In a concluding statement, Coutts postulated, “In the years ahead it’s conceivable that allocators begin to shift towards better debasement hedges. BTC is an obvious choice.” Moreover, he suggests that Bitcoin could supplant bonds by securing at least 1% of the traditional 60/40 portfolio.

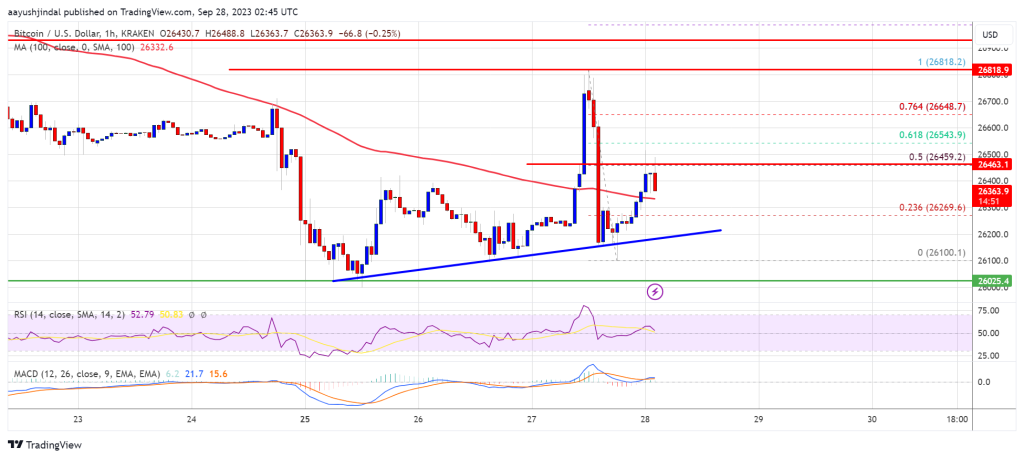
At press time, BTC traded at $26,433.

Read More
Blockchain

Dogecoin Price (DOGE) Prediction – Key Support Intact But Bulls Face Challenges

Dogecoin is holding the key support at $0.0595 against the US Dollar. DOGE could start a fresh increase if there is a clear move above $0.062 and $0.0635.

DOGE started a fresh decline and retested the $0.0595 level against the US dollar.
The price is trading below the $0.062 level and the 100 simple moving average (4 hours).
There is a key bearish trend line forming with resistance near $0.0610 on the 4-hour chart of the DOGE/USD pair (data source from Kraken).
The price could struggle to clear the $0.0615 and $0.0620 resistance levels.

Dogecoin Price Holds Support

After struggling to clear the $0.0635, Dogecoin price started a fresh decline. DOGE declined below the $0.0612 level and even spiked below $0.060.

A low was formed near $0.0593 and is currently correcting losses, like Bitcoin and Ethereum. There was a move above the $0.0602 level. The price climbed above the 23.6% Fib retracement level of the downward move from the $0.0634 swing high to the $0.0593 low.

DOGE is now trading below the $0.0615 level and the 100 simple moving average (4 hours). On the upside, the price is facing resistance near the $0.0610 level. There is also a key bearish trend line forming with resistance near $0.0610 on the 4-hour chart of the DOGE/USD pair.

The first major resistance is near the $0.0615 level. It is near the 50% Fib retracement level of the downward move from the $0.0634 swing high to the $0.0593 low.

Source: DOGEUSD on TradingView.com

A close above the $0.0615 resistance might send the price toward the $0.0635 resistance. The next major resistance is near $0.0650. Any more gains might send the price toward the $0.0685 level.

Are Dips Supported in DOGE?

If DOGE’s price fails to gain pace above the $0.0612 level, it could start another decline. Initial support on the downside is near the $0.060 level.

The next major support is near the $0.0595 level. If there is a downside break below the $0.0595 support, the price could decline further. In the stated case, the price might decline toward the $0.055 level.

Technical Indicators

4 Hours MACD – The MACD for DOGE/USD is now losing momentum in the bearish zone.

4 Hours RSI (Relative Strength Index) – The RSI for DOGE/USD is now near the 50 level.

Major Support Levels – $0.060, $0.0595, and $0.0550.

Major Resistance Levels – $0.0612, $0.0635, and $0.0650.

Read More
Blockchain

Bloomberg Analysts Say Ethereum Futures ETFs Could Start Trading Soon – Here’s When

According to Bloomberg analysts, Ethereum futures ETFs (exchange-traded funds) could start trading for the first time in the United States as early as next week. This comes just a few hours after the US Securities and Exchange Commission (SEC) delayed decisions on Ark Invest and VanEck ETH spot ETF applications.

Why Ethereum Futures ETFs Could Launch Next Week 

On September 28, Bloomberg Analyst Eric Balchunas said – via a post on X (formerly Twitter) – he was hearing that the SEC wants to accelerate the launch of Ether futures ETFs. Balchunas stated that the commission wants it “off their plate” before the potential US government shutdown. 

The United States government faces a possible partial shutdown at 12:01 a.m. ET on October 1 if Congress fails to pass spending bills for the coming fiscal year, potentially affecting most government agencies’ non-essential operations.

The Bloomberg analyst claims that, in anticipation of this scenario, various Ethereum futures ETF applicants have been asked to update their documents by Friday afternoon in order to commence trading as early as Tuesday, the 3rd of October. 

James Seyffart, another Bloomberg ETF analyst, responded to Balchunas’ revelation, saying that it appears that “the SEC is gonna let a bunch of Ethereum futures ETFs go next week potentially.” It is worth noting that neither of the analysts divulged their sources for this latest development.

According to an earlier note from the analysts, there are 15 ETH futures ETFs from at least nine issuers awaiting the SEC’s approval. In their analysis, Balchunas and Seyffart put forward a 90% chance of Ethereum futures ETFs launching in early October.

The note read:

Ethereum futures ETFs have a 90% chance of launching in October, we believe, with Valkyrie’s Bitcoin futures ETF (BTF) poised to become the first to hold Ethereum exposure on Oct. 3 after a strategy change. We expect pure Ethereum futures ETFs to start trading the following week thanks to Volatility Shares” actions.

While spot remains in limbo, Ether futures ETFs highly likely (90% odds) to start rolling out in early Oct. Valkyrie first (albeit with a btc + eth ETF) followed by dozen+ straight ether futures ETFs. Gonna be a wild race albeit w/ much lower stakes than spot via @JSeyff pic.twitter.com/no8kP5DTZt

— Eric Balchunas (@EricBalchunas) September 27, 2023

Spot Ethereum ETFs In Limbo?

Before this latest update on ETH futures ETFs emerged, the United States Securities and Exchange Commission had pushed the deadlines for ARK 21Shares and VanEck’s Ether spot ETF applications. In separate filings, the commission stated that it would designate a longer period on whether to take action on a proposed rule change for the listings of these Ethereum spot ETFs.

The SEC said:

The Commission finds it appropriate to designate a longer period within which to take action on the proposed rule change so that it has sufficient time to consider the proposed rule change and the issues raised therein.

The Securities and Exchange Commission also mentioned that it received no public comments on either proposal. Meanwhile, it set December 25 (for VanEck) and December 26 (for ARK 21Shares) as the new deadline for another delay or decision on the Ethereum spot ETFs.

The approval of an ETH spot exchange-traded fund is highly anticipated due to its potential positive impact on the Ethereum price, which has been struggling in the past few weeks. As of this writing, Ether is valued at $1,617, reflecting a 1.6% price jump in the past 24 hours.


Read More
Blockchain

Analyst Presents 4 Charts That Prove Crypto Is Not Dead

As the crypto market faces constant volatility challenges and regulatory pressures, major cryptocurrencies have experienced significant declines and slowed growth over the years. However, a new chart report has revealed that despite these downward trends, the crypto industry is still achieving new milestones in terms of adoption. 

Chart Reveals Crypto Adoption On The Rise

The broader crypto market has been recovering at a snail’s pace since the crypto crash in 2021. Cryptocurrencies were at their peak during this time, and Bitcoin had the highest growth rate, reaching a price of over $60,000 while Ethereum’s price was around $4,000. 

However, the upward trend was short-lived and the industry was hit with many challenges including regulatory hurdles that restricted its advancement into different regions and market forces which constantly caused instability in crypto prices. 

Amid all this, DeFi Researcher, Thor Hartvigsen has presented in an X (formerly Twitter) post, chart reports that display the continuous growth in adoption of the crypto industry despite negative trends in the ecosystem. 

Hartvigsen disclosed the four charts showed an increase in crypto adoption in the industry. One of the charts shows a spike in total daily wallets for users in the Ethereum and Layer 2 (L2) landscape which was previously in a bear market.

Another chart reveals a surge in traction in decentralized stablecoins which have been in decline since August 2022. 

The third chart illustrates Ethereum’s growth rate over the years, surpassing $10 billion in revenue and promoting the emergence of innovative businesses in the crypto industry.

The last chart shows liquid staking at an all-time high, growing from $7.9 billion to more than $20 billion in 2023. This report also adds to recent data which revealed a spike in liquid staking platforms in the United States after hitting 370,000 Ether (ETH) in only five days and reaching a new milestone of $20 million staked ether. 

Major Incentives Driving Growth Rates

The evolution of the crypto industry has been pushed back a couple of years following the Terra Luna crash which saw one of the largest stablecoins declining by 99%. 

After the LUNA crash, the crypto industry suffered another loss from the FTX descent and insolvency. The industry has been under scrutiny by major regulatory authorities like the United States Securities and Exchange Commission (SEC). 

There have also been multiple crypto scams, rug pulls, and cyber attacks over the years on major exchange platforms and marketplaces in the industry. 

Presently, the crypto industry is slowly gaining back its strength and advancing rapidly, as seen in some major innovative developments like the integration of spot Bitcoin ETFs, and Ethereum spot ETFs.

The ecosystem is also thriving with new infrastructure upgrades and improvements in the DeFi ecosystem, ensuring the sustainability and longevity of the industry.

Read More
Blockchain

XRP Price Set To Skyrocket: Crypto Analyst Predicts 1160% Surge Ahead

In a follow-up to his previous intricate analysis, renowned crypto analyst EGRAG CRYPTO has unveiled another riveting forecast for the XRP price trajectory. Drawing insights from his recent observations, Egrag points to a potential mammoth rise in XRP’s value, suggesting an impressive increase of 1,160%.

This surge, he predicts, could elevate the digital asset’s price to an estimated $6.7, with possible fluctuations placing it within a range of $6.5 to $7.

Here’s Why A 1,160% Move For XRP Seems Possible

The genesis of this bold prediction lies in Egrag’s methodical approach to analyzing past price surges in XRP. Delving into the historical data, he assessed significant price jumps, specifically focusing on those candles that showcased a remarkable price increase of at least 300% in a single candle in the 4-month chart.

The analyst found a total of six parabolic price spikes in the history of XRP that met this requirement. According to him, XRP recorded increases of 1,050%, 530%, 2,222%, 740%, 1,577%, and 841% within four months in the past. Through an average of these significant price moves, Egrag arrived at a potential 1,160% surge.

Adding more weight to this forecast, he aligned this prediction with the Fibonacci extension level of 1.618. This is utilized to pinpoint potential resistance levels surpassing the swing high. Using the Fibonacci extension level, the analyst concludes that both indicators predict a similar price range.

“This leads us to a tantalizing price prediction of $6.7, nestled within the range of $6.5 to $7. This prediction aligns beautifully with the Fib 1.618 level at $6.5,” the analyst concluded.

A Steel Foundation For XRP Price

In a foundational analysis preceding his latest forecast, EGRAG CRYPTO meticulously analyzed XRP’s price movements over a 4-month chart yesterday. He unveiled critical insights that now serve as the backbone of his current predictions. This prior analysis was punctuated by the identification of two salient price zones, termed by Egrag as zone A and zone B.

Zone A encapsulates a price range from $0.00485 to $0.02483, which predominantly spanned from 2013 until early 2017. Within this zone, Egrag highlighted a robust support band ranging from $0.00485 to $0.00596, which he aptly named the “steel foundation”. What is remarkable about this foundation is its resilience; the price consistently held this level even during pronounced market downturns.

Zone B, on the other hand, spans a price spectrum from $0.25939 to $2.00. The steel foundation for this zone was identified between $0.25939 and $0.32630. This foundation has exhibited strong support characteristics since 2017. However, Egrag noted that the combination of a prolonged bear market and external elements like the SEC lawsuit, momentarily nudged the price below this threshold.

Furthermore, Egrag underscored that in the 4-month timeframe, XRP’s price never sealed a closing above the $2.00 mark. This observation is instrumental, as breaking this resistance could pave the way for XRP to approach its all-time high of $3.40, which it touched on January 7, 2018. According to the analyst, the $2 mark is the FOMO zone where investors will rush into buying XRP.

At press time, XRP remained in its sideways trend of the past four weeks, trading at $0.4956.

Read More
Blockchain

Shiba Inu At $0.0000072: Sellers Push For Breakout From Compact Zone

Shiba Inu (SHIB) has been navigating turbulent waters in the crypto market since mid-April. With its price oscillating between the lows of $0.0000068 and the highs of $0.0000076, SHIB holders have been eagerly awaiting a breakout from this sideways movement. The question on everyone’s mind: Will sellers succeed in pushing SHIB out of its current zone?

Price analysis shows that since mid-August, SHIB has been grappling with a bearish market structure on both higher and lower timeframes. The ominous signs began with a sharp price rejection at the $0.00001 price zone, triggering a cascade of sell-offs that brought the price crashing below the once-strong support at $0.0000080.

The Relative Strength Index (RSI) has consistently remained below the neutral 50 mark, underscoring the relentless selling pressure. Furthermore, the Chaikin Money Flow (CMF) plummeted from positive to negative during this prolonged range-bound period.

Current SHIB Stats 

As of the latest data available on CoinGecko, SHIB is trading at approximately $0.000007258220, showing a minor 0.2% decline in the past 24 hours and a seven-day dip of 3.1%. These figures indicate the prevailing bearish sentiment surrounding SHIB.

The $0.0000080 level, which had previously acted as a stronghold for bulls, has now transformed into a formidable resistance barrier due to the sustained selling pressure. While SHIB has maintained a sideways trajectory since this resistance flip, the looming threat of further bearish activity cannot be ignored. 

A successful bearish breakout could potentially lead SHIB to target the June low of $0.000006, the analysis notes. Conversely, if Bitcoin (BTC) stages a rally beyond $27,000, it might just be the catalyst for an unexpected bullish surge in SHIB’s current range.

SHIB Bulls Hold On To Optimism

On a more optimistic note, some analysts believe that if SHIB manages to hold support at $0.0000070, in conjunction with an ascending trendline, it could pave the way for a sentiment shift and potential price recovery, aiming for levels beyond $0.00001. The first crucial step towards this ascent is conquering the immediate seller congestion at $0.0000074.

Shiba Inu (SHIB) remains firmly entrenched in a bearish market structure, with several indicators pointing to sustained selling pressure. However, the crypto world is known for its unpredictability, and market sentiment can shift rapidly. 

Traders and enthusiasts alike will be closely monitoring these critical levels, hoping for a change in SHIB’s fortune, but with caution as they navigate the treacherous crypto waters.

(This site’s content should not be construed as investment advice. Investing involves risk. When you invest, your capital is subject to risk).

Featured image from iStock

Read More
Blockchain

Ethereum Price Faces Rejection But Bulls Are Not Out of Woods Yet

Ethereum price is attempting a fresh increase above $1,620 against the US Dollar. ETH must settle above $1,620 and $1,650 to start a decent increase.

Ethereum is attempting a recovery wave above the $1,600 level.
The price is trading above $1,600 and the 100-hourly Simple Moving Average.
There is a key bullish trend line forming with support near $1,600 on the hourly chart of ETH/USD (data feed via Kraken).
The pair could start a decent increase if there is a close above $1,620 and $1,650.

Ethereum Price Holds Ground

Ethereum’s price remained well-supported above the $1,580 level. ETH formed a base above $1,600 and recently moved a few points higher, like Bitcoin.

There was a move above the $1,620 level but upsides were limited. A high was formed near $1,633 before there was a strong bearish reaction. The price trimmed most gains and revisited the $1,580 zone. A low is formed near $1,583 and the price is now rising.

Ethereum is trading above $1,600 and the 100-hourly Simple Moving Average. There is also a key bullish trend line forming with support near $1,600 on the hourly chart of ETH/USD.

On the upside, the price might face resistance near the $1,608 level or the 50% Fib retracement level of the recent decline from the $1,633 swing high to the $1,583 low. The next major resistance is $1,620. It is close to the 76.4% Fib retracement level of the recent decline from the $1,633 swing high to the $1,583 low.

Source: ETHUSD on TradingView.com

A push above $1,620 might send Ether further higher in the coming sessions. The main hurdle is still near the $1,650 and $1,660 levels. If the bulls succeed in clearing the $1,660 hurdle, the price could start a decent increase toward the $1,720 resistance. Any more gains might open the doors for a move toward $1,800.

Another Drop in ETH?

If Ethereum fails to clear the $1,620 resistance, it could start another decline. Initial support on the downside is near the $1,600 level and the trend line.

The next key support is $1,580, below which the price could test the $1,540 support. A downside break below the $1,540 support might spark strong bearish moves. In the stated case, there could be a drop toward the $1,450 level.

Technical Indicators

Hourly MACDThe MACD for ETH/USD is losing momentum in the bearish zone.

Hourly RSIThe RSI for ETH/USD is now above the 50 level.

Major Support Level – $1,580

Major Resistance Level – $1,620

Read More
Blockchain

Bitcoin Bulls Keep Pushing But Faces Rejection, 100 SMA Is The Key

Bitcoin price attempted a fresh increase above the $26,500 resistance. However, BTC failed to settle above $26,700 and reacted to the downside.

Bitcoin is still struggling to clear $26,500 and $26,700.
The price is trading above $26,200 and the 100 hourly Simple moving average.
There is a connecting bullish trend line forming with support near $26,200 on the hourly chart of the BTC/USD pair (data feed from Kraken).
The pair could again climb higher unless there is a close below $26,200 and $26,000.

Bitcoin Price Faces Uphill Task

Bitcoin price started a decent recovery wave from the $26,000 support zone. BTC climbed higher above the $26,350 and $26,500 resistance levels.

The price even spiked above the $26,700 resistance. However, the bears defended more gains. A high was formed near $26,818 and there was a strong rejection pattern. The price trimmed all gains and declined below the $26,500 level.

It even dived below $26,200. A low is formed near $26,100 and the price is now attempting a fresh increase. Bitcoin is trading above $26,200 and the 100 hourly Simple moving average. There is also a connecting bullish trend line forming with support near $26,200 on the hourly chart of the BTC/USD pair.

Immediate resistance on the upside is near the $26,450 level. It is close to the 50% Fib retracement level of the downward move from the $26,818 swing high to the $26,100 low.

Source: BTCUSD on TradingView.com

The next key resistance could be near the $26,650 level or the 76.4% Fib retracement level of the downward move from the $26,818 swing high to the $26,100 low. To start a recovery wave, the price must settle above $26,650. In the stated case, the price could climb toward the $27,000 resistance. Any more gains might call for a move toward the $27,500 level.

Another Decline In BTC?

If Bitcoin fails to start a fresh increase above the $26,450 resistance, it could start another decline. Immediate support on the downside is near the $26,200 level and the trend line.

The next major support is near the $26,000 level. A downside break and close below the $26,000 level might start another major decline. The next support sits at $25,400. Any more losses might call for a test of $25,000.

Technical indicators:

Hourly MACD – The MACD is now losing pace in the bearish zone.

Hourly RSI (Relative Strength Index) – The RSI for BTC/USD is now above the 50 level.

Major Support Levels – $26,200, followed by $26,000.

Major Resistance Levels – $26,450, $26,650, and $27,000.

Read More
Blockchain

Uniswap Unveils Funding Plan For Ecosystem Revamp As UNI Price Hits 4-Month Low

In a move aimed at advancing their vision of creating a self-sovereign Internet with a permissionless alternative to traditional finance (TradFi), the Uniswap Foundation (UF) has submitted a proposal to secure the second tranche of funding

The desired funding, totaling $62.37 million, will be put to an on-chain vote scheduled for Wednesday, October 4th, with a 10% buffer included to mitigate price volatility.

Uniswap Foundation Seeks Community Approval

The separation of the funding request into two tranches was initially established to allow the UF to finalize its legal entity and obtain non-profit status from the Internal US Revenue Service (IRS), as the company is based in Brooklyn New York, ensuring clarity on tax implications before receiving the larger portion of funds. The UF obtained this status in the spring of this year, prompting the request for the second tranche.

The first tranche of funding, approved by Uniswap governance last year, aimed for $20 million but experienced a decrease in value due to a drop in the price of UNI, the native token of the Uniswap Protocol

Consequently, the Uniswap Foundation received $17.3 million worth of UNI, creating a remainder of $56.7 million to be requested in the second tranche. A 10% buffer of $5.67 million has been included to account for potential price fluctuations, bringing the total request to $62.37 million.

The Uniswap Foundation plans to receive the funds in UNI, with the amount determined using a 30-day UNI/USD TWAP (Time-Weighted Average Price). The pricing and its source will be explicitly noted in the on-chain proposal to ensure transparency in the process.

Regarding future operations, Uniswap currently holds 452,534 UNI tokens for employee vesting, valued at around $1.9 million. Factoring in a capital loss of $259,000 and the current UNI price, the UF has approximately $9.24 million remaining for operational expenses, expected to sustain them until Q4 2024. 

Lastly, according to the proposal discussion, the Uniswap Foundation anticipates revisiting governance in mid-2024 to extend its operational runway.

UNI Consolidates Amid Bearish Market Sentiment

Uniswap’s native token, UNI, has been consolidated between the price range of $4.198 and $4.311 over the past week. 

This price stagnation comes from the overall market trend and a bearish macro outlook, with the token experiencing a 0.5% decline in the fourteen-day timeframe. Furthermore, UNI has dropped 9.6% over the past 30 days, reaching a four-month low.

In the short term, UNI bulls must defend the current price floor to establish a strong support level. They aim to surpass the resistance walls at $4.418 and $4.487 to break the downtrend structure and potentially rally toward $6.259. It is worth noting that this price level is still below UNI’s annual high of $7.629.

According to Token Terminal data, Uniswap’s circulating market cap currently stands at $3.67 billion, experiencing a recent decrease of 6.66%. The fully diluted market cap, which considers the total number of UNI tokens that could enter circulation, stands at $4.27 billion, displaying an 8.15% decrease.

The total value locked (TVL) in Uniswap, representing the amount of cryptocurrency assets deposited and utilized within the platform, has recently declined by 5.31%. This decline reflects the broader Decentralized Finance (DeFi) sector’s challenges.

Featured image from Shutterstock, chart from TradingView.com 

Read More
Blockchain

Ethereum’s Price Vs. Bitcoin: Can Upcoming ETH Futures-Based ETFs Turn The Tables?

The Ethereum price is hovering around yearly lows compared to the dominant cryptocurrency, Bitcoin. This decline, notable since September 2022, has brought ETH to trade as low as $1,594 at the time of writing.

However, amid the concerns about Ethereum’s notable plunge, there are hints of a potential trend reversal, according to the latest report from crypto research firm K33 Research.

Ethereum Price Declines, Underlying Reasons

K33 Research, a renowned figure in the crypto analytical space, has been closely monitoring the relationship between Ethereum and Bitcoin. Their recent findings highlight a palpable drift in the market’s preferences between these two titans.

Ethereum’s native token is under strain, hovering at a trading value near 0.06 Bitcoin. This trend traces back to a pivotal moment in Ethereum’s timeline – its transition from proof-of-work to proof-of-stake consensus, a migration dubbed “The Merge.”

However, Ethereum’s trajectory isn’t solely a product of its internal variation. External market factors have also played their part. The Decentralized Finance (DeFi) and Non-Fungible Tokens (NFTs) sectors have seen their buzz quiet down, which has indirectly cast a shadow over Ethereum’s performance.

Lunde, a Senior Analyst with K33, alongside Vice President Anders Helseth, reflected on this scenario in their recent report. The analysts pointed out:

Ether has experienced a steady downward trend throughout the year as DeFi and NFT activity has faded. Without any meaningful narratives or adoption stories, ether has struggled to maintain strength versus bitcoin

Market Sentiments And Potential Catalysts

Furthermore, insights from Chicago Mercantile Exchange (CME) derivative traders reveal a bearish sentiment towards Ethereum. According to the report, despite a notable 60% surge in open interest since August, the disparity between ETH futures prices and its spot remains considerably lower than that of Bitcoin.

Lunde and Helseth interpret this data to suggest that expectations of potential ETH futures ETFs being approved in the forthcoming weeks failed to gain the attention of the CME Ethereum traders.

However, not everything appears grim for Ethereum. Despite the bearish landscape, analysts at K33 are optimistic about a shift as the year ends. According to the report, the potential approval of new Ethereum futures-based Exchange Traded Funds (ETFs) could reverse this trend.

Such financial products could infuse new vigor into the market, attracting more institutional interest and potentially driving Ethereum’s value against Bitcoin. If approved, they could not only bolster the confidence of existing investors but might also lure new participants to the ETH platform.

Meanwhile, Ethereum and Bitcoin have seen losses over the past week. Ethereum has been down 2.1% with a current trading price of $1,591, and Bitcoin is down by 3.7% with a current price of $26,212.

Featured image from Shutterstock, Chart from TradingView

Read More