Crypto Corner Café

Taste The Future

Blockchain

Blockchain

Here’s Why The Ethereum Price Fell Toward $1,500

The price of Ethereum has experienced a notable decline following a major Ether sale this week. The unexpected decrease has left the crypto community anxious about the stability of the world’s second-largest cryptocurrency and the long-term effects of the decline. 

Ethereum Price Drops After Large-Scale Ether Swap

On Monday, October 9, the price of Ethereum declined following an extensive Ether swap by the Ethereum Foundation, a non-profit community-run organization dedicated to enabling better human coordination. 

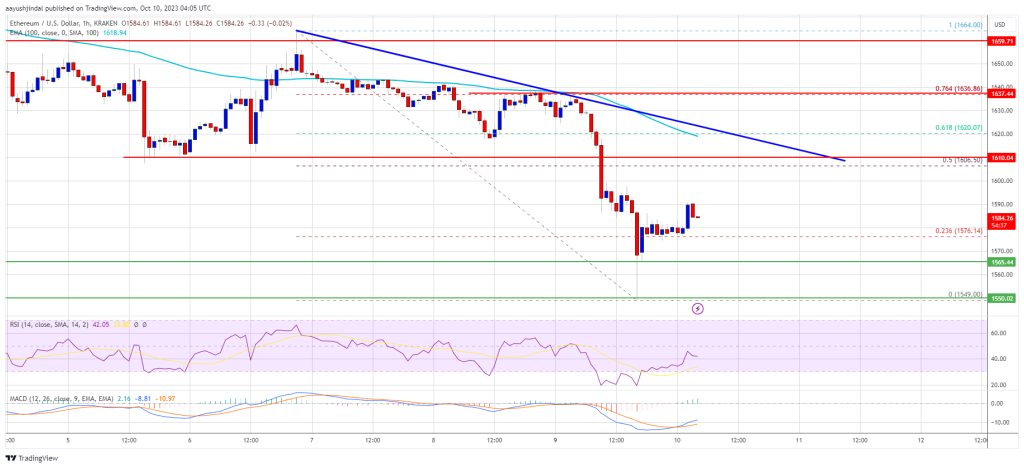
The Ether transaction which took place on Uniswap, a decentralized crypto exchange platform, saw the ETH price drop 5% from its daily high of $1,635 to a local low of $1,553 before recovering once more.

According to Arkham data, the Ethereum Foundation swapped approximately 1,700 ETH worth $2.7 million to a single wallet address which contained almost $400,000 worth of cryptocurrencies and was titled ‘Grant Provider’ by Etherscan.

The specific intentions behind the large-scale swap have not been disclosed by the Ethereum Foundation. However, the Ethereum Foundation, an organization that holds a considerable influential position, regularly swaps large amounts of tokens to fund its operations. 

Presently, Ethereum is trading at a price value of 1589.36 after recovering from the initial decline. The steep decline has left the crypto community worried about the health of the cryptocurrency and whether the price of Ethereum would recover. 

ETH Whales Dump $8.5 Billion

The Ethereum Foundation has not been the only large wallet to sell in recent times as other ETH whales have taken advantage of the altcoin’s price. According to crypto analyst Ali Charts on X, ETH whales dumped a whopping $8.5 billion worth of tokens.

This large selling started in February this year and has continued into October. As a result, the whale selling has seen over 5 million ETH sold and redistributed over this 8-month period. The analyst also points out that “this selling trend continues with no current indication of a shift towards #ETH accumulation yet.”

Compared to its all-time high of $4891.70 in 2021, the price of ETH has dropped by more than half and has been struggling to reclaim the $2,000 mark. However, this could present a unique buying opportunity for investors who could see the price decline as ETH being on discount. 

Nevertheless, Ethereum continues to hold its position as the second-largest cryptocurrency in the market with a market cap of $191.5 billion at the time of writing. Over the last day, the altcoin has also seen some recovery, rising to $1,593 as bulls gear up to retest the $1,600 resistance.

Read More
Blockchain

Shiba Inu Price Dips Below Key Support: Time To Enter Or Exit SHIB?

The Shiba Inu (SHIB) price currently treads on crucial technical terrains. As highlighted in previous comprehensive analysis, the potential impacts of two distinct chart patterns were observed on the 1-week timeframe for SHIB, both leading to vastly different price trajectories.

The 1-week chart reveals a compelling quadruple bottom formation for SHIB. If this pattern materializes, it could suggest a bullish surge of up to 250% from its breakout point, as delineated in prior assessments. Conversely, a starkly contrasting pattern emerges in the form of a descending triangle, which has taken shape over a span of 60 weeks. A conclusive break below its defining neckline could induce substantial declines in SHIB’s valuation.

Shiba Inu Price:

Currently, the bearish sentiment around Shiba Inu seems to be intensifying in the wake of the crypto market downturn. With SHIB recording a price of $0.00000695 at the press time and briefly touching a low of $0.00000674 yesterday, it has breached the descending triangle’s neckline pegged at $0.00000715.

Should SHIB close this week below this key support level, it might portend strong bearish implications, possibly steering the price toward its annual low of $0.000006. Yet, a closure below $0.00000715, while foreboding, is not conclusively bearish.

An analogous dip occurred in June, which was swiftly followed by a robust rally. Over an 8-week period, SHIB ascended by 59%, only to face resistance at the 50-day EMA of $0.00001140, leading to a renewed breach under the descending triangle’s trend line on the weekly chart.

At this juncture, if SHIB can secure a weekly close above the $0.00000715 mark either this week or the next, it might bolster the case for the bullish quadruple bottom setup. So SHIB could see a similar rally to June this year.

From a technical viewpoint, the cryptocurrency will then confront key resistance barriers: the 20-day EMA at $0.00000806, the descending triangle’s trendline approximately at $0.000009, and the 50-day EMA at $0.00001019. Subsequently, a monumental target, pinpointed at the 23.6% Fibonacci retracement level of $0.00002545, representing a rally in excess of 250%, could be attainable.

When interpreting these patterns, investors must decide whether the quadruple bottom or the descending triangle holds more weight for them, making it a buy or sell position.

Community Insights

In a recent post on X (previously known as Twitter), prominent SHIB influencer, Lucie, urged the Shiba Inu community to persevere: “In these turbulent times, it’s imperative for us to remain resilient. The crypto landscape is indeed tumultuous, inundated with unsettling global updates. However, as the formidable ShibArmy, our collective endeavours will undoubtedly yield dividends. Let’s remain united, weathering challenges and championing our shared vision.”

Investors and traders are encouraged to exercise caution and conduct due diligence, keeping a close watch on the unfolding SHIB price narrative.

Read More
Blockchain

Dogecoin Price Faces Crucial Test: Will $0.055 Withstand The Pressure?

Dogecoin (DOGE) has been in a state of horizontal consolidation since mid-August, as it trades within the narrow range of $0.068 and $0.053. This period of consolidation has been marked by daily charts adorned with short-bodied candlesticks, a visual testament to the lack of enthusiasm from both buyers and sellers. 

It’s a curious phase in the world of DOGE, where the price appears to be biding its time, awaiting a catalyst to break free from this stasis. However, recent market fluctuations have cast a shadow over this tranquility, pushing DOGE closer to a foundational support level, possibly signaling an impending bullish resurgence.

Dogecoin Price Analysis Suggests Sideways Movement

Recent price analysis indicates that DOGE’s sideways trend may continue, with the coin hovering near the $0.055 support level within a downsloping trendline. This level, coinciding with a long-standing support trendline, forms a significant accumulation zone. 

While DOGE’s price currently stands at approximately $0.059099 according to CoinGecko, it has experienced a 2.6% decline over the past 24 hours and a 4.9% dip over the last seven days.

Should the resistance trendline maintain its influence, DOGE holders may anticipate a potential 7% drop, which could lead to a retest of the year-long support trendline located around the $0.055 region.

Influential Figures Debate Crypto’s Inherent Value

Meanwhile, on the social media platform X, a lively debate unfolded as two influential figures shared their perspectives on a contentious topic. The discussion was ignited by a statement from the Securities and Exchange Commission (SEC) regarding the Coinbase case, where they asserted that “crypto has ‘no innate or inherent value.’” 

This assertion did not go unnoticed by Dogecoin’s co-founder, Billy Markus, who responded with a pointed critique, emphasizing the taxes he had paid on his cryptocurrency earnings.

then return all the taxes y’all made me pay for receiving it you horrific evil hypocrites pic.twitter.com/rwisnADwLe

— Shibetoshi Nakamoto (@BillyM2k) October 9, 2023

Elon Musk, the CEO of Tesla and SpaceX, renowned for his influential stance on cryptocurrencies, also entered the conversation, offering support to Markus’s perspective. Musk challenged the regulatory body by posing a rhetorical question: “It’s real if you have to pay taxes, but otherwise not real?”

This exchange by DOGE proponents highlights the ongoing debate surrounding the intrinsic value of cryptocurrencies and the increasing involvement of regulatory bodies. 

As the crypto market remains in a state of flux, the perspectives of influential figures like Markus and Musk continue to shape the discourse and influence market sentiment.

It remains to be seen how these debates will impact the broader crypto landscape and whether DOGE will break free from its consolidation phase in the near future.

(This site’s content should not be construed as investment advice. Investing involves risk. When you invest, your capital is subject to risk).

Featured image from NDTV Food

Read More
Blockchain

Why Does Ripple Return Unlocked Tokens To Escrow? Pro-XRP Lawyer Provides Answers

Ripple usually returns a substantial part of its unlocked XRP tokens following every monthly release of 1 billion tokens from its escrow system. Justifying this move, pro-XRP legal expert Bill Morgan explained why Ripple does this rather than leaving these tokens in circulation.

Why Ripple Returns Some XRP Tokens To Escrow

In a tweet shared on his X (formerly Twitter) platform, Morgan suggested that Ripple’s decision not to sell most of the XRP released each month is one of the steps the firm takes to “support XRP’s price.” Morgan is likely referring to the fact Ripple selling all the 1 billion tokens could significantly affect (in a negative manner) the token’s price.

Morgan’s tweet came in response to another X user (Alter Diego), who suggested that Ripple wasn’t relocking those tokens of its own volition but because there was no demand for them. He mentioned that the crypto company’s inability to sell “even half of its monthly XRP escrow release” despite gaining clarity says a lot about the coin. 

The fact that Ripple doesn’t manage to sell even half of its monthly $XRP escrow release even after “having gained clarity” should tell you everything you need to know about this coin.

— Alter Diego (@elalterdiego) October 9, 2023

Another member of the XRP community noted that Ripple could sell all the tokens from its monthly release, and if they did, people like Diego would still complain that “they were dumping.” Meanwhile, he stated that most XRP sales from Ripple were made to “support the rails for new ODL networks which have to be primed.”

Diego’s claims that there is little or no demand for XRP seem unfounded, as XRP sales have jumped this year. Meanwhile, institutional investors seem to be taking a greater interest in the token as institutional inflows into the the token continue to spike. 

Ripple Has Lost Most Of Its Gains From ‘Second Victory’

In a prior tweet to the one where he explained why Ripple relocks its escrowed XRP tokens, Morgan noted that the token had lost most of its gains from Judge Analisa Torres’ denial of the US Securities and Exchange Commission (SEC) motion for an interlocutory appeal.

XRP had climbed as high as $0.6 following Judge Torres’ order. However, the token has dropped by over 2% since then to $0.49. However, despite the decline, many in the community are choosing to remain positive.

One particular X user (who happens to be a software developer) noted that XRP’s price wasn’t solely dependent on the court’s decision as its price “will go where the market takes it.” Irrespective, the user believes that the token’s value is growing as the network’s developers continue to build “incredible things daily.”

Read More
Blockchain

Bitcoin And Crypto Poised To Skyrocket As Endgame Of US Policy Nears: Analyst

The intricacies of US monetary policy have been placed under the microscope by Jordi Alexander, CIO of Selini Capital, who today offered an incisive analysis of the potential ripple effects these policies may have on the Bitcoin and crypto market. Drawing correlations between traditional financial mechanisms and the nascent digital asset landscape, his commentary elucidates a series of complex market dynamics that every investor should be aware of.

At the crux of Alexander’s argument is his observation that the Federal Reserve’s approach to handling current economic conditions might be nearing an inflection point. As reported by NewsBTC, there are growing concerns in the bond market. Bonds with maturities exceeding 10 years have seen a decline of 46% from their highest value in March 2020. Moreover, the 30-year bonds have fared even more poorly, with a drop of 53%.

Alexander remarked, “Haven’t expressed macro views in a while – but as things are about to really start moving – its time. I spent months analyzing the endgame of US policy. The outcome I saw is now coming into view. Gradually at first.. then all at once, the Fed will poo-poo in their pampers. ”

Why QE Might Be Back Sooner Than Later

The analyst perceives the recent shifts in the bond market, especially concerning long-term bonds, as a precursor to potential policy changes. To back this up, Alexander is referencing Nick Timiraos of the Wall Street Journal who recently highlighted a specific sentiment from the Dallas Fed President Lorie Logan that is indicative of this shift.

Logan has begun to express reservations about the earlier hawkish stance of the Federal Open Market Committee (FOMC), largely due to the recent surges in Treasury yields and term premiums. Her concerns emphasize the tug-of-war between the need for restrictive financial conditions to bring inflation down and the current strength of the labor market and overall economic output.

Remarkably, Logan believes that the reasons for the tightening of financial conditions, especially those connected with the recent surges in Treasury yields and term premiums, might reduce the necessity to raise the fed funds rate.

Commenting on this U-turn by the Fed’s Logan, Alexander argues, “This is the Bat-Signal I have been waiting for. What does it mean? Why is the Dallas Fed president in the top tweet doing a big baby U-turn? Because they are starting to realize they are losing control of the bond market!”

Expanding on the nuances of the bond market, Alexander emphasized the distinction between the front and back ends of the curve. He stated, “The front of the curve, such as T-bills & 2-year bonds, are generally very responsive to rate guidance by the Fed… But the Fed never has as good control over the back end- especially 30-year bonds.” Alexander’s analysis points towards a decelerating demand for these long-term bonds, suggesting a potential loss of market control by the Federal Reserve.

This evolving bond market scenario places the Federal Reserve in a precarious situation. Alexander, elaborating on this potential dilemma, posits, “What if they agree to stop raising rates or even initiate cuts, but bond buyers still don’t show up?” He further speculated on a possible shift – the endgame – in the Federal Reserve’s approach: “Placed between a rock and a hard place, the Fed might be pushed towards Yield Curve Control,” hinting at a reversion to Quantitative Easing (QE) policies.

Drawing a parallel to the Japanese financial scenario, Alexander prophesied, “The USD could very well be the casualty of this policy direction, much like the Yen’s predicament in Japan.” He then connected these macroeconomic shifts to the digital asset space, forecasting, “Goodbye Quantitative Tightening, hello my old friend Mr. QE. The timeline is uncertain, but it is time to start paying attention to term premium, like the Dallas Fed!”

Bitcoin And Crypto Could Profit Massively

Ultimately, QE is something that Bitcoin and cryptocurrencies have benefited tremendously from in the last bull market. Alexander therefore also predicts “yes your internet coins [aka Bitcoin and crypto] could then benefit”. Remarkably, this view is shared by several analysts.

BitMEX founder Arthur Hayes recently expressed a similar view, according to which the Fed will sooner than later find itself in a bind to reintroduce QE. Hayes predicts a Bitcoin price of $750,000 in 2026.

But this perspective isn’t universally accepted. Yuga.eth from Coinbase drew on Austan Goolsbee’s confidence in the FOMC’s commitment to tackling inflation. To this, Alexander sharply responded, “Nothing about increasing the debt is helping the inflation anyway. As I wrote at the very beginning, the only way to do it properly would be to increase taxes, especially corporate.”

At press time, Bitcoin traded at $26,677.

Read More
Blockchain

What’s Behind XRP Price Retreat? Assessing Some Eye-Opening Metrics

XRP, along with the broader cryptocurrency market, witnessed a significant decline in prices today, as bearish pressure gripped the digital asset. This downward trend has raised concerns among XRP enthusiasts and experts, who are closely analyzing the recent price movements. 

Bill Morgan, a lawyer and devoted XRP enthusiast, has drawn attention to a compelling observation that draws parallels between the current price drop and a previous significant event.

Morgan has pointed out that the recent plummet in XRP’s price bears an uncanny resemblance to the downward spiral witnessed after Judge Torres issued her summary judgment ruling back in July. It’s worth noting that XRP’s price had initially surged to as high as $0.549 on Oct. 3, following Judge Torres’ decision to deny the appeal request my by the Securities and Exchange Commission. 

XRP has now almost entirely lost the the gains from the recent Torres decision on the SEC’s motion for an interlocutory appeal as it previously almost entirely lost the gains from the summary judgment decision in July pic.twitter.com/Zloa3bcPMD

— bill morgan (@Belisarius2020) October 9, 2023

Ripple, the company behind XRP, celebrated this as another victory in their ongoing legal battle with the SEC. However, this surge was short-lived, as profit-taking activities swiftly ensued.

XRP’s Market Snapshot

Over the past six days, XRP has experienced a series of declines, with only one day in the green. Notably, during this turbulent period, XRP slipped below both its 50-day and 200-day moving averages, signaling a bearish sentiment in the market. As of the latest data from CoinGecko, XRP’s price stands at $0.497, reflecting a 3.9% decline in the last 24 hours and a 3.1% dip over the past week.

Crypto expert Benjamin Cowen weighed in on the situation, characterizing the recent drop in altcoin prices as a typical phase in the market cycle. 

“Namely, where BTC drops, but BTC dominance goes up because altcoins are dropping more. It is always the most brutal part of the market cycle,” Cowen noted. This perspective underscores the interconnectedness of the cryptocurrency market and the complex dynamics that influence price movements.

Technical Indicators, Potential Scenarios For XRP’s Future

Furthermore, technical indicators are hinting at the possibility of a bearish momentum building up for XRP. The Relative Strength Index (RSI) has slipped below the neutral line at 50.0, indicating weakening buying pressure.

Additionally, the Moving Average Convergence Divergence (MACD) indicator, which measures momentum changes, is inching closer to a potential bearish divergence. If the MACD line crosses below the signal line, XRP may face further declines.

In this scenario, there’s a real possibility that XRP’s price could drop to the September low of $0.47. Falling below this crucial level could result in the altcoin reaching a three-month low. However, if the broader sentiment in the market turns positive, XRP might manage to hold the $0.505 support level. 

As XRP navigates these turbulent waters, investors and enthusiasts will be closely watching for any signs of a reversal in its fortunes and hoping for a brighter future ahead.

(This site’s content should not be construed as investment advice. Investing involves risk. When you invest, your capital is subject to risk).

Featured image from iStock

Read More
Blockchain

BNB Market Watch: Factors That Suggest Prudence For Traders

BNB coin has managed to maintain a resilient stance. However, seasoned traders are being urged to exercise caution as they navigate their positions in this dynamic landscape.

Recent developments surrounding a long-standing BNB holder have brought the coin into the spotlight once again, shedding light on its remarkable journey.

A noteworthy event in the BNB ecosystem unveiled itself when one of the early adopters and staunch proponents of BNB decided to make a move. This dedicated holder recently sent a staggering $1.48 million worth of BNB to the Binance exchange, signaling a momentous decision.

What makes this action all the more intriguing is the jaw-dropping profit it yielded—an astonishing $54 million on the sale, as disclosed by Lookonchain.

An early $BNB holder deposited 7,005 $BNB ($1.48M) to #Binance again today.

The early holder has a profit of more than $54M on $BNB and currently has 5,447 $BNB ($1.15M) left.https://t.co/JzcPPKtog1 pic.twitter.com/k2B6IKF2RO

— Lookonchain (@lookonchain) October 8, 2023

Crypto’s Journey To The Present

The historical context of this holder’s involvement with BNB adds depth to the narrative. In 2018, they deposited a substantial 500,543 BNB into Binance when the coin was valued at $112 per unit, amounting to a staggering $56 million.

Surprisingly, this significant sale did not trigger a massive plunge in the coin’s market value, indicating its resilience amidst such significant transactions.

As of the latest available data, CoinGecko reports BNB’s price at $210.27, with a modest 0.5% decline over the past 24 hours and a 4.3% dip in the past week.

An analysis of the BNB/USD 4-hour chart by a BNB price report suggests a stabilization of BNB’s volatility, which could result in fewer pronounced price fluctuations. 

Notably, neither the upper nor lower Bollinger Bands touched the BNB price at $211, signifying that the coin was not in an overbought or oversold state. Traders are eagerly awaiting a change in market sentiment to capitalize on potential profits.

The Road Ahead For BNB

Adding to the mix of indicators is the Moving Average Convergence Divergence (MACD), which currently stands at 0.1, indicating bullish momentum for BNB.

However, a closer look reveals that the 12-day and 26-day Exponential Moving Averages (EMAs) are positioned below the zero histogram point and in close proximity to each other.

This suggests a lack of clear direction for BNB, with buyers and sellers nearly evenly matched. As a result, the crypto is likely to consolidate within the range of $210 to $215 in the short term.

Binance Coin continues to command attention with its ability to weather storms and adapt to changing market dynamics. For traders, navigating this phase requires a keen eye on emerging trends and an awareness of the nuances that can tip the balance in their favor.

As BNB holders and enthusiasts watch the coin’s journey unfold, one thing remains certain: the world of cryptocurrency is always full of surprises.

(This site’s content should not be construed as investment advice. Investing involves risk. When you invest, your capital is subject to risk).

Featured image from Shutterstock

Read More
Blockchain

XRP Price Prediction – A Plunge To $0.45 On The Horizon, Here’s Why

XRP price started a fresh decline from the $0.550 resistance against the US Dollar. It could accelerate lower and revisit the $0.45 support.

Ripple’s token price is declining from the 0.550 resistance against the US dollar.
The price is now trading above $0.500 and the 100 simple moving average (4 hours).
There is a major bearish trend line forming with resistance near $0.5065 on the 4-hour chart of the XRP/USD pair (data source from Kraken).
The pair might continue to move down if it breaks the $0.488 support zone.

XRP Price Takes Hit

Recently, XRP made another attempt to clear the $0.550 resistance. However, the bulls failed to clear the $0.550 barrier. The price traded as high as $0.5510 and started a fresh decline, like Bitcoin and Ethereum.

There was a steady decline below the $0.532 and $0.525 levels. The price even declined below the $0.50 level and the 100 simple moving average (4 hours). Finally, it retested the $0.488 support zone. A low is formed near $0.4875 and the price is now consolidating losses.

XRP is now trading above $0.500 and the 100 simple moving average (4 hours). There is also a major bearish trend line forming with resistance near $0.5065 on the 4-hour chart of the XRP/USD pair. The trend line is near the 23.6% Fib retracement level of the recent decline from the $0.5510 swing high to the $0.4875 low.

On the upside, immediate resistance is near the $0.505 level and the trend line. A close above the $0.505 level could send the price toward the $0.525 resistance or the 61.8% Fib retracement level of the recent decline from the $0.5510 swing high to the $0.4875 low.

Source: XRPUSD on TradingView.com

A successful break above the $0.525 resistance level might start a strong increase toward the $0.550 resistance. Any more gains might send XRP toward the $0.580 resistance.

More Losses?

If XRP fails to clear the $0.505 resistance zone, it could continue to move down. Initial support on the downside is near the $0.488 zone.

The next major support is at $0.450. If there is a downside break and a close below the $0.450 level, XRP price might turn red. In the stated case, the price could retest the $0.420 support zone.

Technical Indicators

4-Hours MACD – The MACD for XRP/USD is now losing pace in the bearish zone.

4-Hours RSI (Relative Strength Index) – The RSI for XRP/USD is now below the 50 level.

Major Support Levels – $0.488, $0.465, and $0.450.

Major Resistance Levels – $0.505, $0.525, and $0.550.

Read More
Blockchain

Ethereum Price Grinds Lower And It’s Vulnerable to a Drop Below $1,500

Ethereum price struggled to clear $1,660 and reacted to the downside against the US dollar. ETH remains at risk of more losses if it breaks the $1,550 support.

Ethereum resumed its decline and retested the $1,550 support.
The price is trading below $1,600 and the 100-hourly Simple Moving Average.
There is a key bearish trend line forming with resistance near $1,610 on the hourly chart of ETH/USD (data feed via Kraken).
The pair could accelerate lower if there is a close below the $1,550 support zone.

Ethereum Price Dives Again

Ethereum failed to settle above the $1,665 resistance zone. ETH started a fresh decline from the $1,665 resistance zone and dived below the $1,650 level.

The bears pushed the price below the $1,600 level and the 100-hourly Simple Moving Average. Ether retested the $1,550 support. A low was formed near $1,549 and the price is now attempting a recovery wave. There was a move above the 23.6% Fib retracement level of the recent decline from the $1,664 swing high to the $1,549 low.

Ethereum is now trading below $1,600 and the 100-hourly Simple Moving Average. There is also a key bearish trend line forming with resistance near $1,610 on the hourly chart of ETH/USD.

On the upside, the price might face resistance near the $1,600 level. The first major resistance is near the trend line and $1,610. It is close to the 50% Fib retracement level of the recent decline from the $1,664 swing high to the $1,549 low.

Source: ETHUSD on TradingView.com

The next major resistance is $1,620 or the 100-hourly Simple Moving Average, above which the price could rise toward the $1,665 resistance zone. A close above the $1,665 resistance might send the price toward the key resistance at $1,750. The next key resistance might be $1,820. Any more gains might open the doors for a move toward $1,880.

Downside Break in ETH?

If Ethereum fails to clear the $1,600 resistance, it could continue to move down. Initial support on the downside is near the $1,565 level. The next key support is $1,550.

A downside break below the $1,550 support might start another strong decline. In the stated case, the price could revisit the $1,465 level. Any more losses may perhaps send Ether toward the $1,420 level.

Technical Indicators

Hourly MACDThe MACD for ETH/USD is losing momentum in the bearish zone.

Hourly RSIThe RSI for ETH/USD is now below the 50 level.

Major Support Level – $1,550

Major Resistance Level – $1,620

Read More
Blockchain

Bitcoin Price Holds Strong At $27,200 But Can BTC Clear This Hurdle?

Bitcoin price failed to clear the $28,500 resistance and corrected lower. BTC retested the $27,250 support and is currently attempting a fresh increase.

Bitcoin is holding gains and still consolidating above the $27,250 zone.
The price is trading below $27,800 and the 100 hourly Simple moving average.
There is a key bearish trend line forming with resistance near $27,780 on the hourly chart of the BTC/USD pair (data feed from Kraken).
The pair could struggle to clear the $27,800 and $28,500 resistance levels in the near term.

Bitcoin Price Faces Key Hurdles

Bitcoin price started a decent increase above the $27,800 resistance. However, BTC failed to remain in a positive zone and revisit the $28,500 resistance zone.

There was a steady decline below the $28,000 level. The price declined below the $27,500 level, but the bulls were active above the $27,250 support zone. A low was formed near $27,275 and the price is now rising. There was a move above the $27,500 level.

Bitcoin climbed above the 23.6% Fib retracement level of the recent decline from the $28,284 high to the $27,275 high. It is now trading below $27,800 and the 100 hourly Simple moving average.

Besides, there is a key bearish trend line forming with resistance near $27,780 on the hourly chart of the BTC/USD pair. Immediate resistance on the upside is near the $27,780 level and the trend line. It is close to the 50% Fib retracement level of the recent decline from the $28,284 high to the $27,275 high.

Source: BTCUSD on TradingView.com

The next key resistance could be near the $28,100 level. The first major resistance is $28,250, above which Bitcoin might test $28,500. A close above the $28,500 resistance could start another increase. In the stated case, the price could rise toward the $29,200 resistance. Any more gains might call for a move toward the $30,000 level.

Another Drop In BTC?

If Bitcoin fails to continue higher above the $27,780 resistance, there could be a fresh decline. Immediate support on the downside is near the $27,500 level.

The next major support is near the $27,250 level. A downside break and close below the $27,250 support might spark strong bearish moves. The next support sits at $26,200.

Technical indicators:

Hourly MACD – The MACD is now gaining pace in the bullish zone.

Hourly RSI (Relative Strength Index) – The RSI for BTC/USD is now above the 50 level.

Major Support Levels – $27,500, followed by $27,250.

Major Resistance Levels – $27,780, $28,250, and $28,500.

Read More