Crypto Corner Café

Taste The Future

Blockchain

Blockchain

Bitcoin Price Soars To $28,000, Here’s Why

The world’s leading cryptocurrency, Bitcoin (BTC), has seen a significant surge in its price today, reaching $28,004. While several factors have contributed to this jump, here are the primary reasons:

#1 SEC’s Non-appeal On Grayscale Spot Bitcoin ETF

Late on Friday night, the market became aware of the US Securities and Exchange Commission’s decision not to appeal the verdict which favored Grayscale’s conversion of the Grayscale Bitcoin Trust (GBTC) into a spot ETF. This decision wasn’t perhaps fully priced in on Friday, as Bitcoin’s price rose by a mere 1.2% on Friday ((followed by a fast retracement), in stark contrast to the 8% spike on August 29 when the initial ruling was announced.

The move signifies the SEC’s potential readiness to green-light a Bitcoin ETF in the imminent weeks. As one Grayscale spokesman pointed out, “The Federal Rules of Appellate Procedure’s 45-day period to seek rehearing has now passed. The Grayscale team remains operationally ready to convert GBTC to an ETF upon the SEC’s approval.”

James Seyffart from Bloomberg Intelligence highlights the probable talks between Grayscale and the SEC in the near future, stating, “Dialogue between Grayscale and SEC should begin next week. Hoping for more info on next steps sometime next week or week after?”

As for when a Spot ETF is coming, Bloomberg Intelligence analysts predict a staggering 90% chance of the SEC’s approval by around January 10.

#2 BTC’s Correlation With Gold

Renowned analyst MacroScope recently provided in-depth insights into the complex relationship between gold and Bitcoin which may have contributed to today’s price move. Gold has soared by more than 6.5% from October 6 till Friday last week, driven by a combination of elements such as central bank policies, the US’s fiscal challenges, and unfolding geopolitical events like the Israel-Hamas war.

Remarkably, the Gold market has been witnessing a discernible pattern: savvy investors, often labeled as the ‘smart money’, have been strategically capitalizing on price dips to augment their long positions. This behavior has been particularly pronounced around the $1820-1860 price marks, suggesting a foundational shift in gold’s pricing trajectory.

Related Reading: Analyst Predicts Next Bitcoin Cycle Top – Is It $89,000 Or $135,000?

This evolving dynamic in the gold market bears significant implications for Bitcoin. Historically, gold often pioneers a trend, with Bitcoin tailing behind to emulate it. This lead-lag relationship, as highlighted by MacroScope, might have been pivotal in forecasting Bitcoin’s move today. As gold appears to be charting a bullish course, Bitcoin, while influenced by its distinct set of catalysts like the spot ETF approval, could be poised to mirror gold’s trajectory.

#3 Short Squeeze

Finally, on a more technical note, there has been significant activity in the BTC futures market that played a part in the soaring price. Thus far today, about $20 million in short positions have been liquidated, the highest amount since October 1, when $37.5 million in shorts were liquidated and BTC rose 4% from $27,000 to nearly $28,100 in a very short period of time.

In conclusion, Bitcoin’s impressive surge to $28,000 can be attributed to a combination of regulatory developments, its correlation with gold, the increasing influence of big holders or ‘whales’, and significant futures market activity.

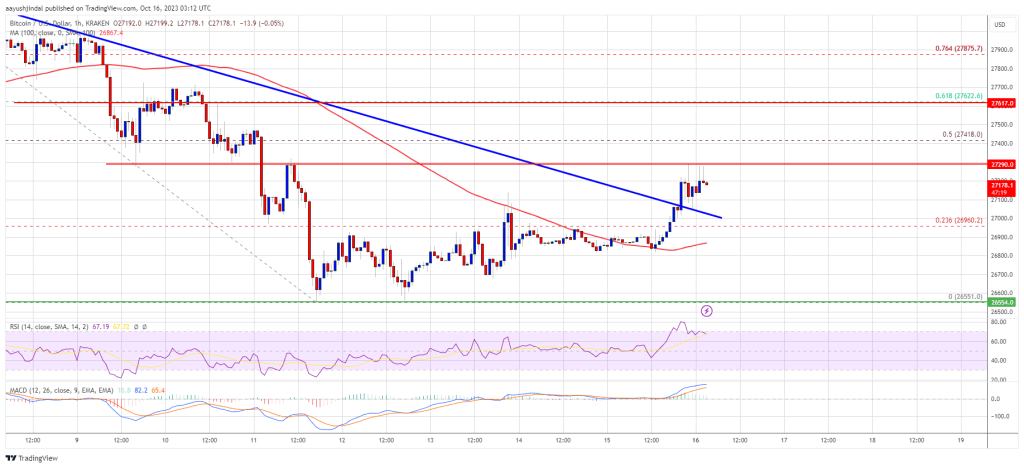
At press time, BTC traded at $27,880.

Read More
Blockchain

Cardano Yearly Support: The Key To A 15% Price Breakout?

Cardano (ADA) has remained perched above the critical annual support level of $0.24, a steadfast line of defense in the face of market volatility. Despite the notable price swings, the asset’s price action has failed to commit to either a bullish or bearish trend, leaving market participants uncertain about the coin’s future. 

A closer look at the daily chart reveals that this indecisive phase is gradually forming a symmetrical triangle pattern, potentially holding the key to forecasting the coin’s near-term trajectory.

As of the most recent data from CoinGecko, Cardano is trading at 0.251940, reflecting a modest 0.3% increase over the past 24 hours, although it has experienced a seven-day loss of 2.7%. These minor fluctuations underscore the prevailing market uncertainty surrounding ADA’s price movement.

Cardano Key Support: A Resilient Barrier

The significance of the $0.24 support level should not be underestimated, as it has acted as a formidable barrier against significant downward moves on three separate occasions in the past four months.

According to a price report, Cardano can maintain its position above this lower trendline, a moderate upswing towards the upper boundary of the triangle at approximately $0.258 could be in the cards, representing a potential gain of 5.5%.

While the triangular pattern remains intact, ADA is expected to remain trapped in a sideways trend. However, should a decisive breakout occur above the triangle, it could ignite a robust 15% rally, setting its sights on the coveted $0.3 milestone.

In a separate report, the outlook remains bearish if buyers fail to seize control of the market in the near future. Traders should brace themselves for a potential test of the $0.24 range in the coming days, adding to the prevailing uncertainty that has kept ADA investors on their toes.

ADA’s Path Ahead

Taking a midterm perspective, the immediate focus should shift to the nearest support level of $0.2380. Given the absence of any convincing reversal signals at this point, a further decline to $0.23 may be on the horizon.

These developments suggest that Cardano is currently navigating a challenging period characterized by price indecision and market fluctuation.

As Cardano continues to oscillate above the critical support level of $0.24 and grapples with a symmetrical triangle pattern, investors must remain vigilant and adapt to the evolving dynamics of this digital asset, as it inches towards a potential breakout or further testing of key support levels.

The path forward for ADA remains uncertain, but the market’s response to the ongoing price indecisiveness will undoubtedly provide valuable insights for traders and enthusiasts alike.

(This site’s content should not be construed as investment advice. Investing involves risk. When you invest, your capital is subject to risk).

Featured image from

Read More
Blockchain

Tron Price Prediction: TRX May Have Another Chance For A Bullish Streak

Tron price is gaining pace above $0.0865 against the US Dollar. TRX is outperforming Bitcoin and could rise further toward $0.091.

Tron is moving higher above the $0.0865 resistance level against the US dollar.
The price is trading above $0.0870 and the 100 simple moving average (4 hours).
There was a break above a key bearish trend line with resistance near $0.0850 on the 4-hour chart of the TRX/USD pair (data source from Kraken).
The pair could continue to climb higher toward $0.0885 or even $0.091.

Tron Price Aims Higher

After facing a rejection near $0.0910, Tron price started a downside correction. TRX declined below the $0.088 and $0.0865 support levels. Finally, it found support near the $0.0850 zone.

A low was formed near $0.0847 and the price is now rising. It broke a couple of hurdles near the $0.0850 level. There was a break above a key bearish trend line with resistance near $0.0850 on the 4-hour chart of the TRX/USD pair.

The pair is up over 2% and outperforming Bitcoin and Ethereum. It also cleared the 23.6% Fib retracement level of the downward move from the $0.0910 swing high to the $0.0847 low.

TRX price is now trading above $0.0870 and the 100 simple moving average (4 hours). On the upside, an initial resistance is near the $0.0875 level and the 100 simple moving average (4 hours). The first major resistance is near $0.0880 or the 50% Fib retracement level of the downward move from the $0.0910 swing high to the $0.0847 low, above which the price could accelerate higher.

Source: TRXUSD on TradingView.com

The next resistance is near $0.091. A close above the $0.091 resistance might send TRX further higher toward $0.095. The next major resistance is near the $0.098 level, above which the bulls are likely to aim for a larger increase toward $0.100.

Fresh Decline in TRX?

If TRX price fails to clear the $0.0875 resistance, it could start a downside correction. Initial support on the downside is near the $0.0862 zone.

The first major support is near the $0.0850 level, below which it could test $0.0847. Any more losses might send Tron toward the $0.0830 support in the coming sessions.

Technical Indicators

4 hours MACD – The MACD for TRX/USD is gaining momentum in the bullish zone.

4 hours RSI (Relative Strength Index) – The RSI for TRX/USD is currently above the 50 level.

Major Support Levels – $0.0862, $0.0850, and $0.0830.

Major Resistance Levels – $0.0875, $0.0880, and $0.0910.

Read More
Blockchain

Ethereum Price Avoids Collapse But Recovery Could Be Capped

Ethereum price managed to recover from the $1,520 level against the US dollar. ETH is now facing hurdles near the $1,565 and $1,600 resistance levels.

Ethereum is attempting a recovery wave above the $1,550 level.
The price is trading just above $1,550 and the 100-hourly Simple Moving Average.
There was a break above a major bearish trend line with resistance near $1,555 on the hourly chart of ETH/USD (data feed via Kraken).
The pair could start another decline unless there is a clear move above $1,565 and $1,600.

Ethereum Price Starts Minor Recovery

Ethereum managed to stay above the $1,500 and $1,520 levels. ETH formed a short-term support base and recently started a fresh increase from the $1,520 zone, like Bitcoin.

There was a move above the $1,550 resistance level. The price climbed above the 23.6% Fib retracement level of the main drop from the $1,664 swing high to the $1,521 low. Besides, there was a break above a major bearish trend line with resistance near $1,555 on the hourly chart of ETH/USD.

Ethereum is now trading just above $1,550 and the 100-hourly Simple Moving Average. However, the bears seem to be preventing an upside break above the $1,565 resistance.

If there is a clear move above the $1,565 resistance, Ether could rise toward the next major hurdle at $1,600. It is close to the 50% Fib retracement level of the main drop from the $1,664 swing high to the $1,521 low. A close above the $1,600 resistance might start a decent increase.

Source: ETHUSD on TradingView.com

In the stated case, Ether could rise and recover toward the $1,665 resistance. Any more gains might open the doors for a move toward $1,750.

Another Decline in ETH?

If Ethereum fails to clear the $1,565 resistance, it could start another decline. Initial support on the downside is near the $1,550 level and the 100-hourly Simple Moving Average.

The next key support is $1,520. A downside break below the $1,520 support might send the price further lower. In the stated case, the price could drop toward the $1,440 level. Any more losses may perhaps send Ether toward the $1,420 level.

Technical Indicators

Hourly MACDThe MACD for ETH/USD is losing momentum in the bullish zone.

Hourly RSIThe RSI for ETH/USD is now above the 50 level.

Major Support Level – $1,550

Major Resistance Level – $1,565

Read More
Blockchain

Bitcoin Price Hints At Potential Correction, But Can BTC Clear This Hurdle?

Bitcoin price started an upside correction from the $26,550 zone. BTC is rising and facing a strong resistance near the $27,300 and $27,500 levels.

Bitcoin managed to recover above the $27,000 resistance zone.
The price is trading above $27,000 and the 100 hourly Simple moving average.
There was a break above a major bearish trend line with resistance near $27,000 on the hourly chart of the BTC/USD pair (data feed from Kraken).
The pair is showing signs of a recovery, but it could struggle near $27,300 and $27,500.

Bitcoin Price Attempts Fresh Recovery

Bitcoin price found support near the $26,550 level. BTC bears attempted to clear $26,550, but they failed. As a result, the price started an upside correction above the $26,800 resistance.

There was a move above the 23.6% Fib retracement level of the downward move from the $28,285 swing high to the $26,550 low. Besides, there was a break above a major bearish trend line with resistance near $27,000 on the hourly chart of the BTC/USD pair.

Bitcoin is now trading above $27,000 and the 100 hourly Simple moving average. It seems like the price is facing a strong resistance near the $27,300 level.

The next key resistance could be near $27,500 or the 61.8% Fib retracement level of the downward move from the $28,285 swing high to the $26,550 low. A clear move above the $27,500 and $27,650 resistance levels could set the pace for a larger increase.

Source: BTCUSD on TradingView.com

The next key resistance could be $28,000. A close above the $28,000 resistance might start a steady increase toward the $28,500 level. Any more gains might send BTC toward the $29,200 level.

Another Decline In BTC?

If Bitcoin fails to recover higher above the $27,500 resistance, there could be a fresh decline. Immediate support on the downside is near the $27,000 level and the trend line zone.

The next major support is near the $26,900 level and the 100 hourly Simple moving average. A downside break and close below the $26,900 support might send the price further lower. The next support sits at $26,550.

Technical indicators:

Hourly MACD – The MACD is now losing pace in the bullish zone.

Hourly RSI (Relative Strength Index) – The RSI for BTC/USD is now above the 50 level.

Major Support Levels – $27,000, followed by $26,900.

Major Resistance Levels – $27,300, $27,500, and $27,650.

Read More
Blockchain

Best Time to Buy Ethereum Could Be Soon: Last Cycle Suggests

Ethereum has been in a descending channel against Bitcoin since August of last year, meaning Bitcoin has been the better investment over this time. However, historical trends show the tides could be changing soon, with Ethereum possibly on the brink of entering an accumulation phase.

Ethereum Price Action

Ethereum is trading at $1600, marking a 22% decrease from its price last August. Bitcoin, on the other hand, is 8% up over the same period.

This is a common trend that happens during bear markets. Coins with larger market capitalizations tend to be more resilient against price decreases as investors become more risk-averse and look to preserve their capital. While Ethereum isn’t short at a market capitalization of $187 billion, it’s still considerably lower than Bitcoin at $525 billion.

During bull markets, coins with lower market capitalization outperform Bitcoin again as investors lean towards assets with greater potential returns.

Ethereum Price Compared Against Bitcoin

When comparing ETH’s value to BTC, it’s evident that Ethereum has been trading within a descending channel since last August. This pattern, characterized by its lower highs and lower lows, often indicates a bearish trend in the market.


The chart above highlights three other distinct phases:

Accumulation phase: During this phase, price tends to stabilize, hinting at an upcoming change in momentum

Ascending channel: Here, the price experiences a significant reversal, often on a parabolic trajectory, characterized by highs and higher lows.

Distribution phase: In the final phase, the price ceases its upward movement. Investors typically use this phase to capitalize on their gains and liquidate their positions.

The accumulation phase is typically the best time for investors to convert their Bitcoin into Ethereum. This phase is marked by price holding on at the bottom and then showing signs of reversal. Ethereum is still forming lower lows against Bitcoin, so it has not entered the accumulation phase yet. However, the last cycle shows that this could be changing soon.

Last Cycle

Reflecting on the last cycle, Ethereum was in a descending channel against Bitcoin for 17 months. The accumulation phase then occurred from September 2019 up until February 2020. Based on the four-year theory, which suggests similar phases in the market occur every four years, this shows that the accumulation phase should also be approaching very soon in this cycle.

Yet, while the last cycle offers valuable insights, it’s important to note that no two cycles are the same. In the current cycle, ETH’s price action has not seen as much of a drop as in the previous cycle, which could be attributed to changing fundamentals and asset maturation.

Final thoughts

While an accumulation phase for Ethereum has not been confirmed yet, there remains the potential for its price to drop even further relative to Bitcoin. However, if the previous cycle is anything to go by, we could enter the accumulation phase soon. This phase typically presents prime buying opportunities for Ethereum.

Investment Disclaimer: The content provided in this article is for informational and educational purposes only. It should not be considered investment advice. Please consult a financial advisor before making any investment decisions. Trading and investing involve substantial financial risk. Past performance is not indicative of future results. No content on this site is a recommendation or solicitation to buy or sell securities or cryptocurrencies.

Predycto is the author of a cryptocurrency newsletter. Sign up for free. Follow @Predycto on Twitter.

Read More
Blockchain

ApeCoin (APE) Set For Upcoming Token Unlock, Bearish Pressure To Worsen?

ApeCoin (APE) will undergo a token unlock valued at $16.69 million. This development comes amidst the token’s bearish price action, which has led to it losing half its market value in Q3 2023. 

15.60 Million ApeCoin (APE) Set To Flood The Market Next Week

According to data from TokenUnlocks, ApeCoin’s next token unlock is set to occur on October 17, during which the ApeCoin DAO will release 15.60 million new APE tokens into circulation. 

This will mark the tenth APE token unlock in 2023, as this event occurs on the seventeenth day of every month. Based on more information from TokenUnlocks, the newly released APE coins will be allocated to five major parties. 

These include Yuga Labs and its founder, the ApeCoin DAO Treasury, charity, and the project’s launch contributors, i.e., early investors in the token before its official launch. Upon release, tokens are expected to form 4.23% of APE’s circulating supply.

ApeCoin was launched in March 2022, with a maximum supply of 1 billion tokens, of which 54.25% are currently unlocked. However, only 367.59 million APE are part of the token’s circulating supply.

APE’s Bearish Form To Continue?

Generally, token unlocks are usually accompanied by concerns of an incoming downward trend. This is because the sudden availability of large amounts of tokens may prompt some investors to sell and take profit, which puts downward pressure on the said token’s price.

As earlier stated, APE already finds itself stuck in a long bearish market. Although the token is only down by 2.79% in the last month, its overall performance in 2023 has been largely negative.

According to data from CoinMarketCap, APE has lost 70% of its value in 2023 compared to its market price as of January 1. 

APE could soon record more losses with the token unlock set for next week. However, that may not be the case. Based on historical data, token unlocks do not always result in a price loss, as notably seen with Aptos in January, in which the APT gained by 50% following its monthly token release. 

Moreover, there have been some interesting developments surrounding ApeCoin in the last week. On October 11, Polygon co-founder Sandeep Narwal proposed on the ApeCoin DAO the development of an exclusive layer 2 solution for ApeCoin, known as “ApeChain.”

Currently, APE is based on the Ethereum Network, and it functions as the governance asset of the APE ecosystem, which consists of NFT projects launched by Yuga Labs, such as the Bored Ape Yacht Club (BAYC). 

However, creating ApeChain could enable Apecoin to achieve a higher level of scalability, which, in turn, could positively affect its adoption and market price.

APE trades at $1.06 when writing, with a 1.47% gain in the last day. Meanwhile, the token’s daily volume is down by 16.96%, valued at $19.32 million.

Read More
Blockchain

On-Chain Tracker Notices Major Difference Between Bitcoin And Ethereum Whales

As earlier reported, Bitcoin holders have steadily held on to their coins in the past few months. Bitcoin whales, in particular, seem to be doubling despite the current uncertainty in Bitcoin’s future projection. Long-term holders add an average of 50,000 BTC to their wallets every month, as indicated by the HODLer Net Position Change indicator provided by Glassnode. 

On the other hand, whales of Ethereum, the second largest crypto in the world, appear to be on a different trajectory. On-chain data has shown that while Bitcoin whales hoard their coins, Ethereum whales appear to be dumping their holdings in recent years.

Bitcoin Whales Buying More, Ethereum Whales Selling

Bitcoin whales, meaning the largest holders with 1000 BTC or greater, have been steadily accumulating more BTC since 2018, according to data from on-chain analytics firms. However, there have been sell-offs, either through extended bear markets or during profit-taking after a strong bullish uptrend.

A research analyst for Cryptoslate named James Straten posted on social media that Ethereum whales with more than 1,000 ETH have been selling since the same period. While sharing a Glassnode chart, he shared a correlation between the whales of the blockchains.

On-chain data shows ETH whales have offloaded 20 million ETH since 2022, with 12 million ETH being sold off this year alone.

Possible Explanation For The Contrasting Whale Activity

The story these on-chain metrics tell provides insight into the prevailing mood among large crypto holders of different blockchains. 

Although the amount of ETH held by whales might indicate they have sold or moved their funds to other cryptocurrencies, a better possibility is that these whales transferred their ETH into Ethereum smart contracts. Since Ethereum version 2.0 kickstarted its journey in December 2020, the number of tokens in the staking protocol has grown significantly. 

ETH 2.0 requires validators to stake 32 ETH in its deposit contract to validate transactions on the Ethereum blockchain. At the moment, the contract now has 31.2 million ETH worth $48.6 billion locked. This seems consistent with on-chain data, which shows that the percentage of supply tied in smart contracts overtook the supply in addresses holding 1000+ ETH in late 2020. 

Crypto research analyst André Dragosch shared this correlation on social media platform X. The correlation buttresses that the Glassnode data doesn’t consider the ETH tied in smart contracts for its whale supply metric.

With a domination of 17.8% over the whole cryptocurrency market, the Ethereum blockchain continues to solidify its position as the undisputed leader of smart contracts. Unlike Bitcoin whales, bullish ETH whales are not just HODLing but employing techniques to maximize their crypto gains.

At the time of writing, ETH is trading at $1,557. However, a recently failed bullish pattern formation could send the price of ETH falling below $1,000.

Cover image from Unsplash, chart from Tradingview

Read More
Blockchain

Bitcoin News: Recent Data Signals Rising Accumulation Among BTC Investors

Bitcoin (BTC) struggled to build on its recent momentum over the past week, reflecting the bearish climate of the general market. However, the latest on-chain revelation suggests that investors continue to show significant faith in the premier cryptocurrency and its prospects.

Bitcoin Addresses With 10+ BTC Reach All-Time High: Santiment

According to a recent report from the blockchain data tracker Santiment, there has been considerable growth within a particular class of Bitcoin investors. The on-chain analytics platform highlighted that the number of shark and whale addresses holding at least 10 BTC has notably increased since early 2022.

The report disclosed that an additional 11,806 addresses hold more than 10 BTC, reflecting an 8.12% increase in the past 20 months. Based on data from Santiment, are currently 157,400 wallets holding at least 10 Bitcoin, surpassing its record high set in 2019.

Since February, 2022, there has been a historic rise in shark & whale wallets holding at least 10 $BTC. In the past 20 months, since this accumulation of new large wallets began, 11,806 more addresses have met this threshold, an 8.12% total increase. https://t.co/I24TAbTB97 pic.twitter.com/AShQvlRg8n

— Santiment (@santimentfeed) October 13, 2023

Another recent Santiment report has strengthened the Bitcoin accumulation argument even more. The number of addresses holding between 100 and 1,000 BTC witnessed its largest spike in a single day since February 2022.

#Bitcoin‘s whale numbers had another huge accumulation day. 16 more wallets now hold between 100-1K $BTC, and they correlate with smaller wallets ‘graduating’ to the next tier. As key stakeholders grow, the argument for a #bullish future gets stronger. https://t.co/DOvRLpGspw pic.twitter.com/EQW8jZsTtn

— Santiment (@santimentfeed) October 14, 2023

The October 14 report revealed that 16 additional addresses 100 to 1,000 BTC. Sentiment noted that this particular scenario goes in tandem with the accumulation trend of smaller wallets (addresses with at least 10 BTC).

Ultimately, these significant on-chain developments indicate a steady accumulation of Bitcoin despite price fluctuations and market instability. Meanwhile, Santiment pointed out that the case for a bullish trajectory becomes more apparent as key Bitcoin investors grow.

BTC Price – Overview

As of this writing, Bitcoin is valued at $26,901, with negligible price movement in the past day. However, a broader look at the BTC price chart shows that the cryptocurrency has struggled in the past week.

According to data from CoinGecko, Bitcoin experienced a 3.7% price decline in the last seven days. After failing to breach the $28,000 mark, the premier cryptocurrency saw its price crash towards $26,500 for the first time in October.

Although news of the United States Securities and Exchange Commission (SEC) opting not to appeal the Grayscale decision might have relieved investors, Bitcoin’s price has barely capitalized on the positive development.

Nevertheless, most investors seem optimistic about the future of Bitcoin, especially with the approval of a spot exchange-traded fund (ETF) looking more likely than ever.

Read More
Blockchain

How Ripple’s Rumored Token Burn Could Affect The XRP Price

XRP has struggled to regain bullish price momentum this month, with the crypto going on six days of red candle close last week. The XRP community appears to be feeling the effects of this lack of momentum, as speculations have begun to circulate about a potential catalyst for the next XRP price surge.

Word on the street now is that Ripple plans to burn the 41.9 billion XRP tokens they have locked up in escrow. Although this hasn’t been confirmed yet, some say this move could send the value of XRP skyrocketing.

The Potential Impact Of A Full Escrow Token Burn

Ripple, the company behind the XRP cryptocurrency, currently holds billions of XRP in escrow. As of the time of writing, Ripple has 41.9 billion XRP locked up, with 1 billion XRP released from escrow each month. This huge stockpile of XRP has led to criticism that Ripple could flood the market at any time and crash the price. 

However, rumors are swirling that Ripple may burn all of the XRP in escrow, potentially spiking up the price of XRP. If Ripple eliminated all of the escrowed XRP, it would significantly decrease the total supply of XRP and could positively impact the market price. 

The rumor was started on social media X by the account @realXRPwhale and has elicited a response from community members. Although unverified, the account posted the update of Ripple, burning the “50 BILLION $XRP.” 

While some have shown enthusiasm regarding the price effect if this happens, others have dismissed it as just a baseless rumor. 

What’s Next For XRP?

Ripple has never acknowledged or refuted rumors that it will destroy all of its tokens held in escrow, but this is not the first time that such a rumor has emerged suggesting that the technology company will do so. But the possibility of this happening is not completely out of the question, as Ripple CEO Brad Garlinghouse mentioned in a 2021 interview.

Other factors that could drive up XRP prices include major partnerships by Ripple and a clear outcome of the ongoing case with the US Security and Exchange Commission. However, one thing that’s going so well is the increased recognition of XRP after a US judge declared that the token isn’t a security. 

At the time of writing, XRP is trading at $0.4863 and is within a range as it looks to break above $0.5. According to an analyst, the price of XRP could get a boost from a blooming altcoin season if Bitcoin’s dominance continues to decline. Research has shown that October has historically seen more losses than gains for XRP.

Cover image from Unsplash, chart from Tradingview

Read More