Crypto Corner Café

Taste The Future

Blockchain

Blockchain

Analyst Predicts Bullish Bitcoin Price Rally To $41,000, Here’s When

The Bitcoin price went over $30,000 over the weekend to reach its highest point since mid-July. As part of this recent rally, crypto trader Carl From The Moon has shared his Bitcoin analysis, predicting the cryptocurrency is poised for a massive 37% rally that could send the price up to $41,000.

Analyst Carl From The Moon Predicts Bitcoin Price Rally

Bitcoin has been subject to many price predictions in recent months, particularly as the industry awaits the approval of applications for a spot Bitcoin ETF. Subsequently, Carl Runefelt, also known as Carl From The Moon, based his long-term analysis on a bullish run if these applications were approved. 

In a new YouTube video, Carl points out that Bitcoin’s price action has just completed a diamond pattern, and a big breakout move to the upside is imminent in the next 30 days. 

TRADE ALERT: #Bitcoin diamond pattern.

Target: $41,000 within 30 days.

More info here: https://t.co/4uX3lL9Sf8 pic.twitter.com/2ABJo5fYiu

— Carl From The Moon (@TheMoonCarl) October 22, 2023

Carl sees a few factors indicating Bitcoin is ready to soar. First, the crypto formed an upside movement at the beginning of the year. Subsequently, a diamond pattern began to form around April on the weekly timescale. Now, Bitcoin is in a prime position to clear the $31,000 resistance level, which would surge the cryptocurrency 37% from its current price of around $30,000 up to $41,000.

“What we can see now is a massive, massive diamond pattern on the weekly timeframe. And if Bitcoin breaks up like this, then we could see Bitcoin go all the way up to $41,000, which would be absolutely insane, right?” Carl said.

For now, Carl remains extremely bullish. Aside from his prediction, Carl also reflected on the current general sentiment of most Bitcoin traders for the near future. He does this by showing his leveraged long positions on different crypto exchanges while planning to add more when a spot Bitcoin ETF is approved. 

“Any day now, the ETF will come out, and then we will wish that we had these long positions open,” the crypto analyst said.

Carl isn’t the only analyst predicting high Bitcoin prices based on the approval of Bitcoin ETFs. Several other experts also think Bitcoin will spike in the coming months, with some giving higher price targets than others. 

For example, crypto analyst Mags on social media platform X predicted a $70,000 price tag is foreseeable. A more optimistic prediction came from Ark Invest CEO Cathie Woods, who predicted $1.48 million for each Bitcoin based on increasing mainstream adoption.

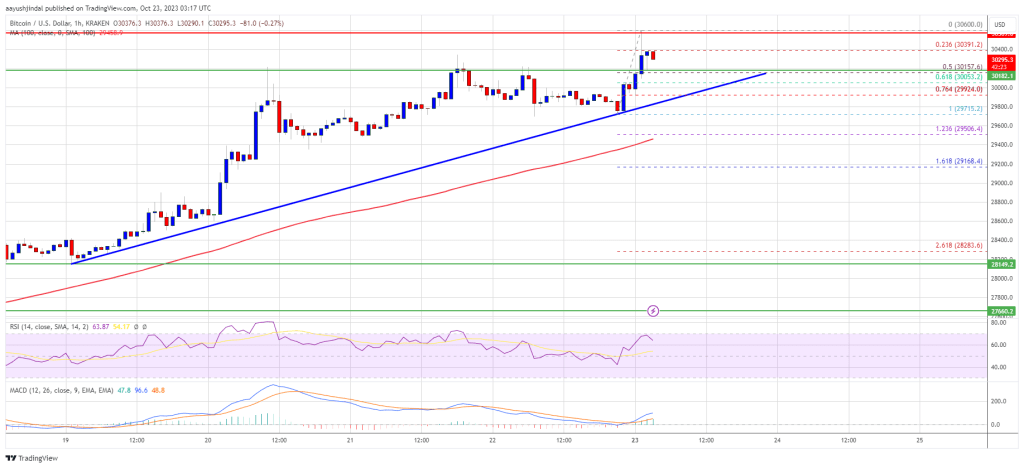
At the time of writing, Bitcoin is trading at $30,522, up by 9.86% in a 7-day timeframe. Most signs point to higher prices ahead, and many retail investors and heavyweights alike look to position themselves. Crypto whale transaction tracker Whale Alerts also recently revealed a massive 1,087 BTC withdrawal from crypto exchange Binance.US to a private wallet, suggesting there’s accumulation taking place.

1,087 #BTC (32,531,932 USD) transferred from #BinanceUS to unknown wallethttps://t.co/NsHxbV0TGS

— Whale Alert (@whale_alert) October 23, 2023

Read More
Blockchain

The Dogecoin Advance: A Double-Digit Boost In The Cards?

Dogecoin (DOGE) remains a notable outlier in the cryptocurrency market, as it struggles to replicate the impressive price surges seen in other digital assets. However, all hope is not lost. Despite its lackluster performance, market expert Ali Martinez has offered a glimmer of hope for DOGE enthusiasts. 

Martinez’s technical analysis, based on the TD Sequential indicator, has signaled a potential uptrend for Dogecoin. However, investors should approach these predictions with caution, as the market’s volatility remains a significant factor.

#Dogecoin appears ready to start a new uptrend!

The TD Sequential presented a buy signal on $DOGE weekly chart. A sustained close above $0.062 could result in an upswing to $0.070. pic.twitter.com/XAGjXHMiOe

— Ali (@ali_charts) October 21, 2023

A Promising Signal For DOGE’s Weekly Chart

In a recent analysis, Ali Martinez dissected Dogecoin’s price movements, highlighting a potential shift in its fortunes. His study pinpointed a promising buy signal on DOGE’s weekly chart, suggesting that the meme coin might be gearing up for an upward trajectory. 

The key to this potential breakthrough lies in DOGE’s ability to maintain a close above the $0.062 mark. If this level is sustained, it could trigger an upswing, propelling Dogecoin to reach $0.070, according to Martinez’s analysis.

Currently, Dogecoin is valued at approximately $0.062736, as per CoinGecko. While it has recorded a 3.2% rally over the past 24 hours and a 4.0% surge in the last seven days, it still lags behind other cryptocurrencies that have witnessed more substantial gains during this period.

Bullish Signals And Caution For DOGE Investors

On the flip side, Martinez’s analysis also identifies potential risks for DOGE holders. Should the price of Dogecoin produce a daily candlestick close below the $0.0582 mark, it could establish a lower low, signaling a bearish trend. This could attract sellers and potentially lead to an 8.90% price drop, pushing DOGE down to $0.0550.

Investors are urged to exercise caution as they navigate the volatile world of cryptocurrencies. While the weekend shows a bullish outlook for Dogecoin, it’s important to keep in mind that the start of a new week can reset existing market biases. With the crypto space constantly in flux, adopting a balanced and measured approach is imperative for those seeking to navigate the tumultuous terrain of digital assets.

Dogecoin’s recent performance, while not as remarkable as other cryptocurrencies, has sparked optimism among some analysts like Ali Martinez. His technical analysis indicates the possibility of an upward trajectory if DOGE can maintain its position above the $0.062 mark. 

(This site’s content should not be construed as investment advice. Investing involves risk. When you invest, your capital is subject to risk).

Featured image from MoneyControl

Read More
Blockchain

Mid-Term XRP Price Targets Revealed By Crypto Analyst

Egrag, a crypto analyst, today presented his medium-term predictions for the XRP price on X (formerly Twitter). He backed up his projections with the 3-day chart and pointed out several potential price points that investors should watch out for.

Analysis Of The 3-Day Chart XRP/USD

Egrag’s chart, based on Binance’s 3-day XRP/USDT pair, suggests that XRP is currently in the midst of a crucial breakout retest phase. He emphasized the current market dynamics by saying, “What’s happening right now is merely a retest of the breakout; the true pump is still on the horizon, and it’s bound to be epic!”

The analyst highlighted XRP’s triumphant rally from mid-July, which surpassed his original target of $0.85 and rose to a commendable $0.93, surpassing the original price target by 9.41%. Egrag’s 3-day chart shows a descending trend line, which the analyst calls the “Final Wake Up Line.”

According to him, the breakout above the trend line on July 13 after the summary judgment in the lawsuit between Ripple Labs and the US Securities and Exchange Commission (SEC) was the final wake-up call for investors who were still waiting on the sidelines.

Currently, the XRP price sits at around $0.52. As the analyst shows in the chart, XRP has experienced a retest of the trend line and passed it with flying colors. In particular, Egrag also points out that XRP was able to stay above the 0.236 Fibonacci retracement level at $0.4534.

This laid the foundation for the XRP price to enter bullish territory at this point. However, the price still faces the resistance zone between $0.55 and $0.60, which Egrag calls the “backbone junction”. Noteworthy is that the upper end of the price range coincides with the 0.382 Fibonacci retracement level. Exceeding this resistance is crucial, especially because it has provided strong resistance several times in the past.

Once this is accomplished, Egrag’s medium-term XRP price targets will come into focus. As explained, he has made an adjustment to his price targets as a result of the July increase. Due to the 9.41%-higher July rise compared to his original price target, Egrag now expects XRP to rise to $1.10 (instead of $1) in an initial rally.

Egrag has also raised the $5.5 price target to around $6, and the previous $6.4 benchmark has been recalibrated to nearly $7. He stated:

So, if we apply this same percentage increase to our upcoming targets, here’s what we can look forward to:

A) $1 * 9.41% = Approximately $1.10

B) $5.5 * 9.41% = Roughly $6

C) $6.4 * 9.41% = About $7

Lower Price Targets

Egrag’s analysis is based on several Fibonacci levels and shows potential resistance points. These are the Fibonacci 0.5 ($0.7528), 0.618 ($0.9442), 0.702 ($1.1095), 0.786 ($1.3038), 1 ($1.9664), and the Fibonacci extension levels at 1.272 ($3.3153), 1.414 ($4.3546), and 1.618 ($6.4420).

Overall, the analysis suggests that XRP’s upward momentum is likely to continue and build on its recent successes. The recent rise in price above the analyst’s lower target suggests robust upside sentiment in the market. However, investors should remain keenly aware of the crypto market’s inherent unpredictable nature and exercise due diligence at all times.

Egrag ended his tweet on an encouraging note for the community, “XRP Army STAY STEADY, We’re advancing step by step towards our exciting targets.”

At press time, XRP traded at $0.5291.

Read More
Blockchain

Crypto Analyst Points Out Bitcoin Sell Signal That Could Be Triggered Today

The flagship cryptocurrency, Bitcoin, is fast approaching $31,000 following its gains over the weekend. Analyzing this price action, crypto analyst Ali Martinez has predicted Bitcoin’s future trajectory as he suggests that the bears could regain dominance soon enough. 

A Price Correction Imminent For Bitcoin

In a post shared on his X (formerly Twitter) platform, Martinez noted the potential head-and-shoulders pattern that was forming on the Bitcoin daily chart following its upward trend. This chart pattern has always been considered bearish as it suggests that a trend reversal might be on the horizon, meaning there could be a dip in prices soon enough. 

Confirming this assumption, Martinez stated that the daily chart (which he shared alongside the post) “hints at a possible sell signal emerging tomorrow [October 23].” According to him, this prediction is backed by the TD Sequential indicator, which is flashing “a green 9 candlestick.” The TD Sequential indicator helps traders identify the exact time of a potential reversal. 

Martinez also alluded to the Relative Strength Index (RSI), which he mentioned has reached 74.21. He noted that this has been “a level triggering sharp corrections since March.” An RSI of over 70 also suggests that Bitcoin may be overbought with a price correction imminent. This impending price correction can only be averted if Bitcoin manages to clock “a daily candlestick close above $31,560.” 

As of the time of writing, Bitcoin is trading at around $30,700, up by over 2% in the last twenty-four hours and a further 10% in the last seven days. 

Options Market Could Contribute To Bitcoin’s Upward Momentum

In a post on his X platform, Alex Thorn, Head of Firmwide Research, highlighted the role that options traders (short gammas in particular) could play in driving Bitcoin’s price higher in the short term. 

He noted that the options market makers in Bitcoin are “increasingly short gamma as BTC spot price moves up.” This current positioning could help “amplify the explosiveness of any short-term upward move in the near term,” considering that these short gammas have to buy more Bitcoin to stay “delta neutral” as Bitcoin’s price continues to rise.

From his analysis, Thorn was simply explaining that the option market makers will have to place ‘buy orders’ to hedge against their short positions as Bitcoin’s price continues to climb, thereby adding to buying pressure, which could cause the crypto’s price to rise higher.

Meanwhile, he believes that the long gammas could provide a safety net for Bitcoin’s price in the event of a price reversal. These long gammas would have to buy back spots in order to remain delta-neutral, thereby providing support and helping resist any further decline (in the short term, at least). 

Read More
Blockchain

Shiba Inu Lead Dev Kusama Breaks Silence With Major Updates

The pseudonymous lead developer of Shiba Inu (SHIB), Shytoshi Kusama, has broken his silence and has re-engaged with the community via Telegram, offering insights into the project’s developmental trajectory and responding to pressing queries regarding its future.

In a flurry of messages, Kusama unveiled his enthusiasm and strategic engagements aimed at bolstering Shiba Inu’s ecosystem. “Excited to see ALL the incredible projects on Shibarium. Finally, get to come out of quiet mode for all the amazing projects out there,” he said, delineating the ongoing work and collaborations undertaken during his period of silence.

He further revealed dialogues with pivotal figures in the ecosystem, saying, “I’ve been talking to VERY important individuals and some top [people] in [the] community for the next phase. Now I can return and support in any way I can as we keep building.”

Kusama’s remarks suggest a phase of introspection and strategic alignments, as he mentioned, “We have also been busy with platforms to support the community and begin this network state. Sometimes silence is the best weapon.”

Major Progress For Shiba Inu, Leash, Shibarium

One of the most significant updates provided was regarding the LEASH token. Kusama outlined a vision where the community is more involved and informed. “Yes. My plan is to build a framework that expresses to the community what YOUR plans, products, and platforms that use leash are… so we all can DOOR. (DYOR) Good plan huh?” he commented, emphasizing the essence of decentralization. “This is the quiet before the typhoon and I can’t wait to learn about all the fantastic projects building with Leash, Shib, Bone or launching on Shibarium.”

On the matter of Shibarium’s low usage, Kusama imparted his perspective on broader market trends and token utility. Explaining the relationship between token “burns” and utility, he noted, “Please understand the ‘burn’ increases as the use of Shibarium and Shib (and all tokens in the ecosystem) increase. So I’ve been looking for ways at a zoomed-out level to increase usage with others in our decentralized community.”

Kusama also addressed the community’s queries about specific timelines for key developments, advocating for a broader, philosophical perspective on time, indicating that rigid timelines might not be the most effective approach in a complex and evolving ecosystem. He stated, “Because time is infinite. It cannot be framed. BUT if you’re into watches the waves of the world then you know what time it is.”

A question regarding Shiba Inu’s integration into mainstream payment systems like McDonald’s and Burger King was met with a pragmatic response, acknowledging the existing challenges in such integrations. “It is available in tens of thousands of retailers but payment systems require deeper thought and integration,” Kusama elucidated, hinting at ongoing strategic deliberations.

A noteworthy exchange occurred when a user mentioned the necessity for the Shibarium key for integration with Hoichi, highlighting the importance of community-driven initiatives.

The Shiba Inu-based project stated that they “have 30 blockchains active already waiting to connect with Shibarium,” but the key is missing. “I think the Shibarium team reached out and there was confusion on what was needed. Please reach out a second time,” Kusama advised.

At press time, SHIB traded at $0.00000722. Remarkably, SHIB managed to close above the neckline of the descending triangle on the weekly chart, which could create a new bullish momentum. The next target could be the descending trend line of the triangle.

Read More
Blockchain

Can Solana Sustain Its Recent Rally? What Traders Should Know

Solana (SOL) has been making waves in the cryptocurrency market with an impressive price performance since the beginning of 2023. The digital currency has recorded a staggering 195% increase in its value during this period, leaving traders and investors eager to know whether this rally can be sustained in the months to come.

From its humble beginnings at $9.97, the price of SOL has rapidly ascended to nearly $30 in the span of just 10 months. At the time of writing, SOL is valued at $30.72 at CoinGecko, boasting impressive 24-hour gains of 3.6% and an astonishing seven-day rally of 38.9%.

Technical analysts are cautiously optimistic about SOL’s future trajectory. They suggest that under the right conditions, SOL could potentially double in value. According to a recent price analysis report, the coin might appreciate to $32, although this uptrend is expected to proceed at a more measured pace compared to the aggressive pump witnessed in July.

Recent price action at around $30 certainly raises questions about SOL’s potential to reach $32, but many factors remain in play. What’s undeniable is that Solana’s impressive performance relative to major cryptocurrencies makes it an asset worth watching closely.

Solana Key Levels And Potential Scenarios

If SOL’s upward momentum continues, there are several notable price targets to watch for. The key resistance levels to keep an eye on are at $30, $32, $33.8, and $37.4.

If the cryptocurrency manages to break through these levels, it could signal a sustained bullish trend, and investors may consider these points as potential areas for profit-taking or reassessment of their positions.

Alternatively, if selling pressure prevails in the near future, SOL could decline to the crucial support at $24, indicating a potential shift in the trend. Keep an eye on $24 as a significant level for decision-making.

Related Reading: Solana On Fire With Over 34% Rally Within A Week – Details

A Promising Breakthrough

In a separate report, it is highlighted that Solana has successfully overcome the $25.86 hurdle after nearly a year of struggling to do so. This achievement serves as a testament to the strength of the bullish sentiment within the SOL market.

However, investors should be prepared for a potential minor pullback to $25.86 or $24.43 as part of the ongoing price action. A rebound from these levels is crucial for kickstarting a rally with the ambitious target of $69.79 in sight.

Solana’s impressive run so far in 2023 has not gone unnoticed. With technical indicators and support levels in play, traders and investors should keep a keen eye on SOL, as it navigates its way through the volatile crypto landscape, offering both opportunities and risks in the quest for substantial gains.

(This site’s content should not be construed as investment advice. Investing involves risk. When you invest, your capital is subject to risk).

Featured image from Servcorp

Read More
Blockchain

LINK Price Pumps 40% In Three Days, Why Bulls Are Not Done Yet

Chainlink’s LINK price is up over 40% and trading above $10. The bulls seem to be in control and might aim a rally toward the $12 resistance.

Chainlink price is gaining pace above the $10.00 resistance against the US dollar.
The price is trading above the $10.00 level and the 100-day simple moving average.
There is a key bullish trend line forming with support near $8.60 on the daily chart of the LINK/USD pair (data source from Kraken).
The price could continue to move up toward the $11.25 and $12.00 resistance levels.

Chainlink Price Starts Fresh Rally

In the past few days, LINK price started a strong rally against the US Dollar. The price formed a base above the $7.00 level before the bulls stepped in. There was a major pump above the $7.50 and $8.00 resistance levels.

In the last three days, the price gained over 40% and cleared many hurdles near $9.00. The recent pump in Bitcoin also helped LINK surpass the $10.00 resistance. A new multi-week high is formed near $10.99. The price is now consolidating gains well above the 23.6% Fib retracement level of the upward move from the $7.11 swing low to the $10.99 high.

LINK is now trading above the $10.00 level and the 100 simple moving average (4 hours). There is also a key bullish trend line forming with support near $8.60 on the daily chart of the LINK/USD pair. The trend line is near the 61.8% Fib retracement level of the upward move from the $7.11 swing low to the $10.99 high.

Source: LINKUSD on TradingView.com

If there is a fresh increase, the price might face resistance near $11.20. The first major resistance is near the $12.00 zone. A clear break above $12.00 may possibly start a steady increase toward the $12.20 and $12.50 levels. The next major resistance is near the $13.20 level, above which the price could test $15.00.

Are Dips Limited in LINK?

If Chainlink fails to climb above the $11.20 resistance level, there could be a downside correction. Initial support on the downside is near the $10.00 level.

The next major support is near $9.00, below which the price might test the trend line support at $8.60. Any more losses could lead LINK toward the $8.00 level in the near term.

Technical Indicators

4 hours MACD – The MACD for LINK/USD is gaining momentum in the bullish zone.

4 hours RSI (Relative Strength Index) – The RSI for LINK/USD is now above the 50 level.

Major Support Levels – $10.00 and $9.00.

Major Resistance Levels – $11.20 and $12.00.

Read More
Blockchain

Bitcoin Breaches Halfway Mark To $31,000 – How High Can BTC Go This Week?

The price of Bitcoin is maintaining an upward trajectory, catching many off guard this weekend. As of now, BTC has surged by 3.0% in the last 24 hours, and sustaining a 12% rally in the last week. At $30,780, according to data by Coingecko, the top crypto is just inches away from reaching the vaunted $31K, a territory it briefly crossed in April 10 this year.

The $30,000 mark holds considerable significance for Bitcoin, functioning as both a psychological milestone and a technical resistance point. Psychologically, it represents a round number that influences investor sentiment, inspiring confidence when surpassed and raising concerns when it becomes a barrier.

Technically, $30,000 historically acts as a level where selling pressure tends to intensify, impacting short-term and long-term price movements. As a result, this price level is closely monitored by traders and investors, making it a critical reference point in the cryptocurrency market.

The Anticipated Boost: Bitcoin ETF’s Impact On The Crypto Market

There’s a lot of excitement about the possibility of the U.S. Securities and Exchange Commission allowing a Bitcoin exchange-traded fund (ETF). This could be a big boost for the struggling cryptocurrency market. Mike Novogratz, the CEO of Galaxy Digital, thinks it’s very likely that the U.S. will approve this kind of investment fund for Bitcoin soon. This news could be a major reason for Bitcoin’s price to go up.

Bitcoin may soon break over its overhead resistance and begin a rapid surge, according to trading group Stockmoney Lizards. They anticipate widespread participation in the ETF and a subsequent surge in the run-up to the halving in April 2024.

The financial industry is currently witnessing the active participation of major players such as BlackRock, which manages assets above $10 trillion. These firms are also actively pursuing the approval of their applications for exchange-traded funds (ETFs), thereby creating an environment filled with eager expectation.

As a result of Bitcoin’s steady ascent, tokens formed by the forking of the alpha coin, namely Bitcoin Cash (BCH) and Bitcoin SV (BSV), had a significant surge of up to 26%, surpassing other altcoins in terms of gains. This surge may indicate a potential manifestation of enthusiasm.

Prospects Of A Bitcoin ETF In Late 2023 Or Early 2024

Several industry experts are suggesting that the long-anticipated approval of a spot Bitcoin exchange-traded fund (ETF) could materialize sometime between late 2023 and early 2024. This revelation has sent ripples of excitement throughout the cryptocurrency community and the broader financial world.

If BlackRock’s spot Bitcoin ETF is approved, Matrixport, a provider of cryptocurrency services, projects that the price of Bitcoin would rise to between $42,000 and $56,000. The community of U.S. registered investment advisors and prospective investment inflows from gold ETF investors form the basis of the extremely optimistic forecast.

A Bitcoin ETF is a big deal because it makes it easy for regular folks to invest in Bitcoin without needing to deal with all the complicated stuff that comes with digital currencies. It’s like a bridge that connects the regular money world with the wild world of cryptocurrencies, which could help more people get into Bitcoin.

(This site’s content should not be construed as investment advice. Investing involves risk. When you invest, your capital is subject to risk).

Featured image from Collection FRAC Lorraine

Read More
Blockchain

Ethereum Dragged Higher By Bitcoin But Can ETH Clear Hurdles?

Ethereum price started a decent increase after Bitcoin gained momentum against the US dollar. ETH is rising and might test the key $1,750 resistance.

Ethereum started a decent increase above the $1,650 resistance.
The price is trading above $1,660 and the 100-hourly Simple Moving Average.
There is a key bullish trend line forming with support near $1,645 on the hourly chart of ETH/USD (data feed via Kraken).
The pair could climb further higher, but it might face strong resistance near $1,750.

Ethereum Price Reclaims $1,650

Ethereum stayed above the $1,550 support zone. The recent pump in Bitcoin above the $28,500 resistance sparked bullish moves in ETH. There was a steady increase above the $1,600 and $1,620 resistance levels.

The price even cleared the key $1,650 resistance zone. A high is formed near $1,700 and the price is now consolidating gains. It is trading well above the 23.6% Fib retracement level of the upward move from the $1,620 swing low to the $1,700 high.

Ethereum is now trading above $1,660 and the 100-hourly Simple Moving Average. There is also a key bullish trend line forming with support near $1,645 on the hourly chart of ETH/USD. The trend line is near the 61.8% Fib retracement level of the upward move from the $1,620 swing low to the $1,700 high.

On the upside, the price is facing resistance near the $1,700 level. The first major resistance is near the $1,720 zone. The next key resistance is $1,750, where the bears might emerge. To continue higher, the price must settle above the $1,750 resistance.

Source: ETHUSD on TradingView.com

In the stated case, Ether could start a strong increase toward the $1,880 resistance. Any more gains might open the doors for a move toward $2,000.

Downside Correction in ETH?

If Ethereum fails to clear the $1,700 resistance, it could start a downside correction. Initial support on the downside is near the $1,660 level.

The next key support is $1,645 and the trend line zone. A downside break below the $1,645 support might send the price further lower. In the stated case, the price could drop toward the $1,620 level and the 100-hourly Simple Moving Average. Any more losses may perhaps send Ether toward the $1,550 level.

Technical Indicators

Hourly MACDThe MACD for ETH/USD is gaining momentum in the bullish zone.

Hourly RSIThe RSI for ETH/USD is now above the 50 level.

Major Support Level – $1,645

Major Resistance Level – $1,700

Read More
Blockchain

Bitcoin Price Hold Strong At $30K: Indicators Point More Upsides To $31.2K

Bitcoin price is gaining pace above the $30,000 resistance. BTC is showing positive signs and might rally further above toward the $31,200 level.

Bitcoin started a fresh increase above the $28,500 and $28,800 resistance levels.
The price is trading above $30,000 and the 100 hourly Simple moving average.
There is a key bullish trend line forming with support near $30,000 on the hourly chart of the BTC/USD pair (data feed from Kraken).
The pair could continue to rise toward the $31,200 resistance level.

Bitcoin Price Regains Strength

Bitcoin price formed a support base above the $27,500 level. BTC started a steady increase and cleared a few hurdles near the $28,500 resistance zone.

The bulls gained strength and managed to push the price above the main $30,000 resistance zone. A new multi-week high is formed near $30,600 and the price is now consolidating gains. There was a minor decline below the 23.6% Fib retracement level of the upward move from the $29,715 swing low to the $30,600 high.

Bitcoin is now trading above $30,000 and the 100 hourly Simple moving average. There is also a key bullish trend line forming with support near $30,000 on the hourly chart of the BTC/USD pair. The trend line is near the 61.8% Fib retracement level of the upward move from the $29,715 swing low to the $30,600 high.

Source: BTCUSD on TradingView.com

On the upside, immediate resistance is near the $30,400 level. The next key resistance could be near $30,600. A clear move above the recent high might send the price toward the $31,200 resistance. The next key resistance could be $32,000. Any more gains might send BTC toward the $33,200 level in the coming sessions.

Are Dips Limited In BTC?

If Bitcoin fails to rise above the $30,600 resistance zone, it could start a downside correction. Immediate support on the downside is near the $30,150 level.

The next major support is near the $30,000 level and the trend line. If there is a move below the trend line support, the price may perhaps decline toward the $29,500 level or the 100 hourly Simple moving average.

Technical indicators:

Hourly MACD – The MACD is now gaining pace in the bullish zone.

Hourly RSI (Relative Strength Index) – The RSI for BTC/USD is now above the 50 level.

Major Support Levels – $30,150, followed by $30,000.

Major Resistance Levels – $30,400, $30,600, and $31,200.

Read More