Crypto Corner Café

Taste The Future

Blockchain

Blockchain

XRP Price Balloons 13%, Triumphs Over Resistance: The Start Of A Bigger Story?

In the past few days, XRP has achieved a significant breakthrough of notable resistance levels, offering a hint of impending substantial price movements.

This development has been closely watched by the cryptocurrency community, who have observed a notable degree of volatility in XRP’s price dynamics in recent times.

The cryptocurrency’s ability to surmount these substantial resistance barriers signals a possible shift in market dynamics and has generated considerable interest among traders and investors.

XRP’s Legal Victory Sets The Stage For A Promising Future

Ripple’s native token, XRP, has emerged as a standout performer in the cryptocurrency space following a significant legal victory against the US Securities and Exchange Commission in mid-July. At that pivotal moment, a federal judge ruled that Ripple’s structured XRP sales did not fall under the classification of investment contracts.

Since this ruling effectively established that XRP’s status as a digital asset was distinct from being deemed a security, it delivered a much-needed boost of confidence to the cryptocurrency and blockchain communities.

It was a watershed moment for Ripple and its digital currency, highlighting the company’s potential for growth inside the industry’s shifting legal structure. The verdict in this case has rekindled hope and set XRP’s future on a promising course.

At the time of writing, XRP was trading at $0.55, up 1.6% in the last 24 hours and registering a decent 13% increase in the last seven days, data from crypto market tracker Coingecko shows.

In the context of the cryptocurrency market, where trends can change rapidly, the observation that XRP has not only crossed but exceeded both the 200-day and 50-day Exponential Moving Averages carries considerable weight.

EMAs are widely recognized as crucial technical tools, serving as essential guides for traders and analysts to evaluate an asset’s price movement over specific timescales.

XRP’s Price Action And Key Resistance

When XRP’s price action consistently rises above these key EMAs, it is taken as a bullish sign that the cryptocurrency may be headed for new highs. Given the current climate of the cryptocurrency market, where rising prices tend to coincide with rising confidence and investor interest, this event takes on greater significance.

The altcoin has exhibited a commendable weekly performance, thereby approaching a critical level of $0.56. This particular price point has consistently served as a resistance level since the middle of August.

The Relative Strength Index (RSI) indicates a prolonged bullish trend as it remains above the neutral line at 50.0. This suggests the possibility of a breakthrough at the price level of $0.54, maybe resulting in an upward movement of the XRP price towards $0.60.

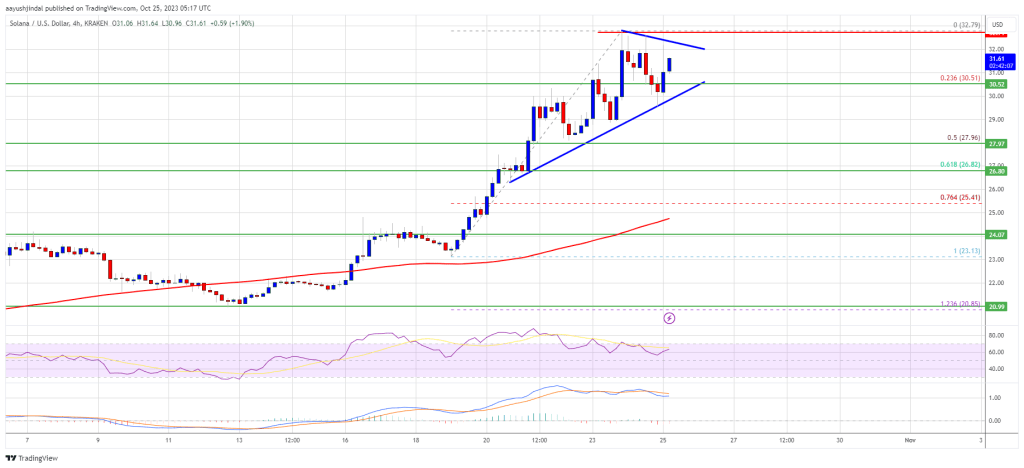
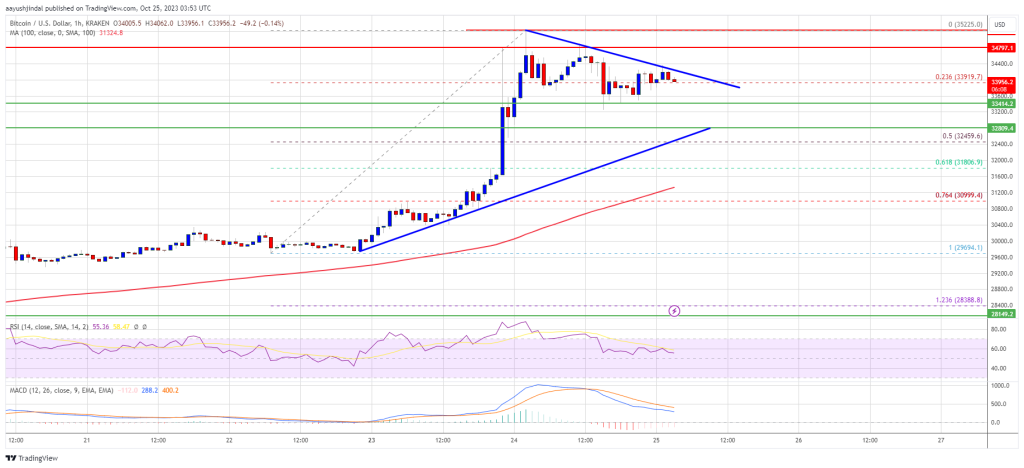
Meanwhile, the euphoric feeling surrounding Bitcoin’s ascent to $35,000, which frequently serves as a benchmark for the rest of the crypto market, can be partially ascribed to the present momentum being enjoyed by XRP. Is this the commencement of a larger narrative?

(This site’s content should not be construed as investment advice. Investing involves risk. When you invest, your capital is subject to risk).

Featured image from Protos

Read More
Blockchain

Galaxy Foresees Stellar 74% Bitcoin Price Surge In Post-ETF Debut Year

Galaxy Digital, a leading player in the digital assets sphere, has issued a bullish prediction for Bitcoin’s trajectory following the launch of the much-anticipated US-regulated spot Bitcoin ETF. According to a recent study published by the firm on October 24, the introduction of the ETF is set to considerably bolster Bitcoin’s adoption, positioning it more firmly as a recognized asset class.

Advantages Of An ETF

Galaxy’s analysis highlights that a spot Bitcoin ETF would be “one of the most impactful catalysts for the adoption of Bitcoin (and crypto as an asset class).” By the end of September, Bitcoin assets held across diverse investment products like ETPs and closed-end funds touched an impressive figure of 842,000 BTC, valuing approximately $21.7 billion.

Galaxy Digital’s study also sheds light on the challenges faced by these investment avenues, pointing to factors like high fees, tracking errors, limited liquidity, and a somewhat constrained reach amongst broader investor groups. The introduction of the spot Bitcoin ETF, the report suggests, is poised to change this scenario dramatically.

Spot Bitcoin ETFs offer a multitude of benefits over the current structures: an improved fee system, greater liquidity, better price tracking, and a much-needed break from the complications of self-custodying assets. As the report explicitly states, “The presence of a US-regulated spot Bitcoin ETF that adheres to strict regulatory compliance not only provides a more secure platform but also elevates its transparency, making it a preferable choice over existing investment products.”

Why A Spot Bitcoin ETF Matters

Galaxy believes that the introduction of a Bitcoin ETF would increase the digital asset’s “accessibility across wealth segments” and establish “greater acceptance through formal recognition by regulators and trusted financial services brands.”

The report highlights the disparity between age groups when it comes to Bitcoin investments. It reveals that while Boomers and older generations hold 62% of US wealth, only 8% of adults aged 50 and above have invested in cryptocurrency.

Galaxy sees regulatory approval for a Bitcoin ETF as a significant step towards establishing Bitcoin as a mainstream investment. An ETF could help reduce market volatility by offering “greater price transparency and discovery for market participants.”

Estimating Inflows From ETF Approval

Galaxy’s forecast suggests the US wealth management sector, managing a combined asset worth $48.3 trillion, will be the most impacted by a Bitcoin ETF’s launch. They estimate potential inflows into the Bitcoin ETF to be around $14 billion in the first year, escalating to $27 billion in the second year and reaching $39 billion by the third year.

Factoring in the historical relationship between gold ETF fund flows and gold price change, Galaxy predicts a potential price increase of 6.2% for BTC in the first month after an ETF’s launch. They project this to taper down to +3.7% by the last month of the first year, resulting in an estimated +74% increase in BTC in the first year of an ETF approval. At the current price, this would mean that BTC could rise above $59,000 in the post-ETF debut year.

The Bigger Picture

Beyond the potential inflows into a US ETF product, Galaxy predicts that there will be a much larger impact on BTC demand “from second-order effects”. The potential approval of a spot ETF in the US might instigate similar products in other global markets. Moreover, Galaxy expects that various other investment vehicles, like mutual funds and private funds, will integrate Bitcoin into their strategies.

Galaxy suggests the potential for Bitcoin’s Total Addressable Market (TAM) to grow substantially, perhaps encroaching on traditional asset sectors like real estate and precious metals. The estimated potential new inflows into BTC could range between $125 billion to $450 billion “over an extended period.”

Read More
Blockchain

Dogecoin Aggressive 12% Leap: Fear/Greed Index Uncovers Bullish Sentiment Secrets

Dogecoin has been showing renewed exuberance with impressive figures this week, surging to an intraday high of $0.06525 Tuesday. This substantial rally allowed the cryptocurrency to surpass a significant resistance level positioned at $0.0640.

Notably, this price breakthrough represented a momentous achievement for Dogecoin, as it hadn’t reached such heights since August 31. The cryptocurrency’s remarkable rebound from a low of $0.06068 indicated a resurgence in investor interest and enthusiasm, underlining the dynamic and often unpredictable nature of the cryptocurrency market.

This event also served as a reminder of Dogecoin’s ability to capture the attention of traders and investors, prompting them to join the fray during this period of heightened market activity.

Dogecoin: Market’s Shift Toward ‘Greed’ Territory

In a recent X post by @DogecoinFear, an intriguing insight into the Dogecoin Fear and Greed Index emerges, revealing a current score of 71, which signals that the market may be entering “greed” territory.

Dogecoin Fear and Greed Index is 71. Greed pic.twitter.com/TEgVW6MunR

— Doge Fear and Greed Index (@DogecoinFear) October 24, 2023

In this context, “greed” signifies an intense desire for profit. A high score on the Dogecoin Fear and Greed Index, like the 71 mentioned, reflects a market where many investors are primarily motivated by the pursuit of substantial financial gains. This heightened “greed” sentiment can raise concerns about potential overvaluation or a forthcoming market correction.

This fascinating metric holds significance for cryptocurrency enthusiasts, as it suggests the potential for an impending market correction.

Conversely, when the index dips into “Fear” territory, it may serve as an indicator for investors to consider it a buying opportunity.

At the time of writing, DOGE was trading at $0.066, down 2.8% in the last 24 hours, but still maintained a solid 12% ascent in the last seven days, data from crypto market tracker Coingecko shows.

A number of cryptocurrency analysts have recently said in X posts that they believe DOGE will eventually reach the lofty $1 target. Dogecoin, according to cryptocurrency analyst Ali Martinez over the weekend, is nearing the peak of a multiyear slipping triangle pattern.

This pattern often serves as a technical indicator that hints at a potential bullish breakout. The $1 target for DOGE has been a subject of widespread interest and speculation within the cryptocurrency community, and these insights from analysts reinforce the optimism surrounding Dogecoin’s future price trajectory.

DOGE’s Bullish Signal: TD Sequential Indicator in Action

Based on Martinez’s analysis, it has been seen that the Tom DeMark (TD) Sequential indicator has recently exhibited a bullish signal for DOGE. The TD indicator is utilized to identify potential trend reversals by tracking a sequence of price points.

#Dogecoin appears ready to start a new uptrend!

The TD Sequential presented a buy signal on $DOGE weekly chart. A sustained close above $0.062 could result in an upswing to $0.070. pic.twitter.com/XAGjXHMiOe

— Ali (@ali_charts) October 21, 2023

The analyst said:

“Dogecoin appears ready to start a new uptrend! The TD Sequential presented a buy signal on DOGE weekly chart.”

He added that a sustained close above the key resistance level at $0.062 holds the potential to trigger a notable upswing in Dogecoin’s value, potentially driving it towards the $0.070 mark. This pivotal breakthrough could signify a shift in market sentiment, attracting more traders and investors who see the potential for further gains.

It’s an important technical milestone to watch, as surpassing such resistance levels often signals renewed interest and buying activity in the cryptocurrency market.

(This site’s content should not be construed as investment advice. Investing involves risk. When you invest, your capital is subject to risk).

Featured image from Air Force Athletics

Read More
Blockchain

SOL Price Prediction: Solana Bulls Seem Unstoppable As They Aim For $35

Solana is gaining pace above the $30 resistance against the US Dollar. SOL price remains supported and might aim for a fresh rally toward $35.

SOL price started a major rally above the $28 resistance against the US Dollar.
The price is now trading above $29.20 and the 100 simple moving average (4 hours).
There is a key contracting triangle forming with resistance near $32.10 on the 4-hour chart of the SOL/USD pair (data source from Kraken).
The pair could start a strong rally if it clears the $32.10 and $32.75 resistance levels.

Solana Price Eyes More Upsides

After forming a base above $22.50, Solana started a fresh increase. SOL gained bullish momentum after Bitcoin rallied above the $30,000 resistance.

There was a strong move above the $28.80 and $30.00 resistance levels. It even spiked above the $32.50 level. A high is formed near $32.79 and the price is now consolidating gains. There is also a key contracting triangle forming with resistance near $32.10 on the 4-hour chart of the SOL/USD pair.

Solana is now trading above $29.20 and the 100 simple moving average (4 hours). It is now showing positive signs above the 23.6% Fib retracement level of the upward move from the $23.13 swing low to the $32.79 high.

Source: SOLUSD on TradingView.com

On the upside, immediate resistance is near the $32.00 level and the triangle region. The first major resistance is near the $32.75 level. A successful close above the $32.75 resistance could set the pace for a larger increase. The next key resistance is near $35.00. Any more gains might send the price toward the $36.50 level.

Are Dips Limited in SOL?

If SOL fails to recover above the $32.00 resistance, it could continue to move down. Initial support on the downside is near the $30.50 level.

The first major support is near the $28.00 level or the 50% Fib retracement level of the upward move from the $23.13 swing low to the $32.79 high. If there is a close below the $28.00 support, the price could decline toward the $26.80 support in the near term.

Technical Indicators

4-Hours MACD – The MACD for SOL/USD is gaining pace in the bullish zone.

4-Hours RSI (Relative Strength Index) – The RSI for SOL/USD is above the 50 level.

Major Support Levels – $30.50, and $28.00.

Major Resistance Levels – $32.00, $32.75, and $35.00.

Read More
Blockchain

Ethereum Price Sees Technical Correction But Key Uptrend Support Intact

Ethereum price rallied following Bitcoin and tested $1,850 against the US dollar. ETH is correcting gains, but the bulls might remain active near $1,750.

Ethereum started a downside correction from the $1,850 resistance.
The price is trading above $1,750 and the 100-hourly Simple Moving Average.
There is a major bullish trend line forming with support near $1,755 on the hourly chart of ETH/USD (data feed via Kraken).
The pair could start a fresh increase unless there is a clear move below $1,750.

Ethereum Price Remains Supported

Ethereum started a strong increase above the $1,750 resistance. Bitcoin dragged ETH higher toward the $1,850 resistance before the bears appeared.

A high is formed near $1,849 and the price is now correcting gains. It traded below the 23.6% Fib retracement level of the upward move from the $1,659 swing low to the $1,849 high. However, the price is still trading in a positive zone.

Ethereum is now trading above $1,750 and the 100-hourly Simple Moving Average. There is also a major bullish trend line forming with support near $1,755 on the hourly chart of ETH/USD. The trend line is near the 50% Fib retracement level of the upward move from the $1,659 swing low to the $1,849 high.

Source: ETHUSD on TradingView.com

On the upside, the price is facing resistance near the $1,805 level. The first major resistance is near the $1,850 zone. The next key resistance is near $1,880. A close above the $1,880 resistance could send the price further higher. The next key resistance is $1,950, above which the price could accelerate higher. In the stated case, Ether could test the main $2,000 barrier. Any more gains might open the doors for a move toward $2,200.

More Losses in ETH?

If Ethereum fails to clear the $1,805 resistance, it could continue to move down. Initial support on the downside is near the $1,780 level.

The next key support is $1,750 and the trend line zone. A downside break below the $1,750 support might send the price further lower. In the stated case, Ether could drop toward the $1,720 level. Any more losses may perhaps send Ether toward the $1,700 level and the 100-hourly Simple Moving Average.

Technical Indicators

Hourly MACDThe MACD for ETH/USD is losing momentum in the bullish zone.

Hourly RSIThe RSI for ETH/USD is now above the 50 level.

Major Support Level – $1,750

Major Resistance Level – $1,805

Read More
Blockchain

Bitcoin’s Surge Shakes Up ETF World: Who’s Soaring And Who’s Crashing?

A ripple of excitement has recently coursed through the crypto market, particularly on Bitcoin. Bolstered by speculation regarding the impending approval of a spot Bitcoin exchange-traded fund (ETF) —a sentiment propelled by BlackRock’s iShares ETF’s appearance on the DTCC website—Bitcoin recorded an 18-month high trading above $35,000.

This upward movement came on the heels of a notable 10% surge on Monday.

ProShares Short Bitcoin Strategy ETF: A Declining Tale?

Contrary to the general jubilance, not all BTC-related financial instruments are shared in the celebration. The ProShares Short BTC Strategy ETF, designed for traders banking on a decline in Bitcoin futures, grappled with a record low.

Just over a year ago, this fund basked in the glory of a peak value of $45.61; a zenith reached as crypto assets took a downturn in the aftermath of FTX’s collapse.

However, this year, the ProShares Short Bitcoin Strategy ETF has faced challenges, its value diminishing by 59.3% to stand at $16.68, a historic nadir, at the time of writing.

This dip didn’t deter investors. Despite the drop, the ProShares Short BTC ETF, boasting net assets of $62.98 million, is poised for its second consecutive month of inflows, according to data from Lipper.

Lucas Kiely, the Chief Investment Officer at digital wealth platform Yield App, offered a perspective on this trend. He posited that the market might be “buying the rumor and selling the fact.” Kiely further elaborated that the BTC short ETF provides investors a unique opportunity to speculate on a potential BTC sell-off.

The Chief Investment Officer noted:

A lot of people think this rally is a short squeeze – we have no real news coming out and a lot of anticipation around the SEC’s approval or disapproval of these spot ETFs and people are getting ahead of themselves. Ultimately, the market is again buying the rumor and selling the fact and the BTC short ETF is the only way for investors to express the view BTC is going to sell off.

Furthermore, Kiely suggested another motive behind investors’ moves. With the surge in BTC’s value, some might be seeking to “lock in” their profits and, hence, are turning to the ETF as a hedge against potential future downturns.

Other BTC-Related ETFs Enjoy The Rise

Conversely, some BTC-associated ETFs rode the wave of optimism. The ProShares Bitcoin Strategy ETF, mirroring BTC futures alongside the Valkyrie Bitcoin Miners ETF, registered gains of 7.68% and 6.54%, respectively, over the past day. 

Leading the pack among recently introduced funds that track Ethereum (ETH )futures was the Valkyrie Bitcoin and Ether Strategy ETF, with a commendable 7.64% uptick over the same period.

Furthermore, BTC has retraced from its recent traded high of $35,000 and currently trades at $33,746, at the time of writing, still up 9.2% in the last 24 hours.

Featured image from Unsplash, Chart from TradingView

Read More
Blockchain

Bitcoin Bulls Take Back Seat But Here’s Why Dips Are Still Attractive

Bitcoin price started a downside correction from the $35,000 resistance. BTC could start a fresh increase unless there is a move below $32,800.

Bitcoin rallied toward the $35,000 resistance before the bears appeared.
The price is trading above $33,200 and the 100 hourly Simple moving average.
There is a key breakout pattern forming with resistance near $34,050 on the hourly chart of the BTC/USD pair (data feed from Kraken).
The pair could correct lower toward the $33,000 zone before it starts a fresh increase.

Bitcoin Price Corrects Gains

Bitcoin price rallied over 15% after there was speculation of spot ETF being listed DTCC. BTC surged toward the $35,000 resistance zone before the bears appeared.

A new multi-week high was formed near $35,225. Recently, the price started a downside correction below the $34,500 level. There was a move below the 23.6% Fib retracement level of the upward move from the $29,694 swing low to the $35,225 high.

Bitcoin is now trading above $33,200 and the 100 hourly Simple moving average. There is also a key breakout pattern forming with resistance near $34,050 on the hourly chart of the BTC/USD pair. The triangle support is close to the 50% Fib retracement level of the upward move from the $29,694 swing low to the $35,225 high.

On the upside, immediate resistance is near the $34,050 level. The next key resistance could be near $34,800. The main resistance is now forming near the $35,000 zone.

Source: BTCUSD on TradingView.com

A clear move above the $35,000 barrier might send the price toward the $36,200 resistance. The next key resistance could be $37,000. Any more gains might send BTC toward the $38,000 level in the coming days.

More Losses In BTC?

If Bitcoin fails to rise above the $34,050 resistance zone, it could continue to move down. Immediate support on the downside is near the $33,400 level.

The next major support is near the $32,800 level and the triangle trend line. If there is a move below the trend line support, the price may perhaps decline toward the $31,500 level in the coming sessions.

Technical indicators:

Hourly MACD – The MACD is now losing pace in the bullish zone.

Hourly RSI (Relative Strength Index) – The RSI for BTC/USD is now above the 50 level.

Major Support Levels – $33,400, followed by $32,800.

Major Resistance Levels – $34,050, $34,800, and $35,000.

Read More
Blockchain

1inch Investment Fund Just Sold Ethereum, What Do They Know?

1inch Investment Fund, a fund closely tied with the crypto exchange aggregating platform, 1inch, has sold 4,685 stETH for 8.54 million USDC at $1,823, according to Scopescan, an analytics platform, on October 24. By selling at spot rates, the fund has netted $1.28 million in profits since the stETH was bought at an average price of $1,550 less than a week ago.

1inch Investment Fund Sells stETH

StETH, or staked Ethereum (ETH), is an ERC-20 token representing staked ETH on the Lido Finance protocol. The platform allows anyone to stake their coins and earn rewards without necessarily locking their coins for an extended period. 

As of October 24, Lido Finance is the most popular decentralized finance (DeFi) application looking at total value locked (TVL). DeFiLlama data shows that the protocol manages over $15.7 billion of assets, of which over 95% are ETH. 

Technically, any ETH holder wishing to stake and earn network rewards stake on Lido Finance receives stETH in return, representing the stake amount. The higher the staked amount, the more stETH the protocol issued. This stETH can be traded, transferred, or used to secure loans while concurrently earning network rewards. 

Selling stETH means 1inch Investment Fund automatically unstaked the same amount on Lido Finance and sold the underlying coins. Even so, transferring the underlying ETH can take several days when there might be changes to spot prices.

Curiously, the decision is when the crypto market seems to recover, and Ethereum is roaring back to life towards the $2,000 level. Considering that the fund is private and doesn’t divulge its strategy to the public, it couldn’t be immediately determined why it sells stETH when market confidence is high. 

Will Ethereum Prices Break $2,000?

Looking at price charts, Ethereum prices are up roughly 17% from H2 2023 lows, rallying at spot rates. The October 23 and 24 expansion has seen the coin break higher, registering new October highs. Even so, despite the overall confidence, the failure of bulls to complete reverse losses of August 17 should be a concern.

Ideally, a comprehensive surge above $1,800 and $2,000 could anchor a leg up toward $2,100 in the coming sessions. When the fund sold stETH at $1,823, price data showed it exited at around today’s peak. There is an inverted hammer in the ETHUSDT daily chart, an indicator that prices are inching lower on increasing selling pressure.

Read More
Blockchain

From $35,000 To $500,000? The Bitcoin Rollercoaster This Expert Sees Ahead

Stephan Livera, an esteemed host of his namesake podcast and Swan Bitcoin’s Head of Education, has now provided the crypto community with projections for Bitcoin’s future trajectory. This week, Bitcoin experienced a rally that took its price to as high as $35,000, marking its highest point since May 2022.

However, amid the favorable climate around a potential spot Bitcoin exchange-traded fund (ETF) approval and institutional adoption, Livera posits that this surge is merely the precursor to a much grander bull run.

The Potential Impetus: A Spot Bitcoin ETF

Approval of a spot Bitcoin ETF could be a game-changer for Bitcoin’s valuation, according to Livera. Conversing with Michelle Makori, the Lead Anchor and Editor-in-Chief at Kitco News, during the Pacific Bitcoin Festival, Livera emphasized the possible ripple effects of such an approval.

While murmurs suggest that ETF approval might be on the horizon by the close of this year, Livera diverges from this sentiment. Livera anticipates this landmark event to materialize more likely in 2024. The Head of Education at Swan Bitcoin noted:

Although many experts predict that [a spot Bitcoin ETF] will come in three to six months, I don’t believe it will happen this year. Next year is the more likely scenario … in the first or second quarter of 2024, which would coincide with the halving cycle, which is expected in April.

Notably, a significant event, such as the halving cycle, will impact Bitcoin’s market dynamics. Historically, this event – which slices the miners’ reward for new block addition to the Bitcoin blockchain by half – has spurred price shifts.

The upcoming cycle will set the block reward at 3.125 BTC. This, combined with the potential spot ETF approval, could catalyze a heightened interest and influx of investments into Bitcoin, according to Livera.

Projected Peaks And Troughs: The BTC Landscape

Livera offers a roadmap of Bitcoin’s possible pricing journey. The Swan Bitcoin’s Head of Education foresees a stabilization around the $30,000 mark shortly, with a potential escalation toward $40,000 as we approach next year’s halving event.

But the real fireworks might commence after the halving, ushering in a wild bull run. Expounding on historical trends, Livera shared:

Historically, what we’ve seen around the halving is a bit of a rise into the halving, then a bit of a selloff after. Six to 12 months out, that’s when the real crazy bull run happens, and you get 10x or 20x in the Bitcoin price at that point.

This extrapolation by Livera culminates in a noteworthy prediction for the end of 2024 – a bold ascent, perhaps reaching roughly $500,000 by 2025 or early 2026, according to the expert.

However, the climb might be coupled with a steep decline. Drawing parallels to gold, Livera posits Bitcoin could potentially mimic its valuation range. Livera added, emphasizing the volatility of the crypto domain:

It’s quite possible that Bitcoin comes close to the range of gold, and that would imply a price in the $500k range. As is a tradition in this industry, we’ll probably hit that as a blow-off top, followed by a drop of 80%. So, it might go to $500k and then crash to $100k.

Featured image from Unsplash, Chart from TradingView

Read More
Blockchain

PEPE Roars Ahead: Dominates SHIB And DOGE With Record-Breaking 6.9T Burn

In the ongoing frenzy surrounding meme coins that have captivated the cryptocurrency market throughout 2023, PEPE has experienced a significant resurgence. 

After a prolonged decline from July 14 to October 3, the memecoin halted its downtrend and entered an accumulation phase. Subsequently, it embarked on a renewed bullish uptrend starting on October 20, outperforming Ethereum-based altcoin Shiba Inu (SHIB) and Elon Musk-backed Dogecoin (DOGE) by a significant margin. 

As a result of this uptrend, PEPE has reclaimed its position in the top 100 list of cryptocurrencies, currently ranking 96th.

Bitcoin’s Surge Beyond $35,000 Sparks Market Uptrend

This surge in value has been largely influenced by the market leader, Bitcoin (BTC), which surpassed the $35,000 mark on Tuesday. 

For many, the current uptrend is driven by anticipation of the approval of a spot Bitcoin exchange-traded fund (ETF), which could potentially bring a new wave of capital into the market.

Furthermore, Dogecoin is among the five popular meme coins influenced by Bitcoin’s rise to $35,000. Shiba Inu also experienced a 5.9% gain and is currently trading at $0.00000765, following a similar pattern to DOGE.

In a significant development, the dev team behind PEPE announced on X (formerly Twitter) that approximately 6.9 trillion $PEPE tokens, worth around $6,000,000, have been burned. 

Additionally, a new team of advisors has been brought on board to guide the future direction of Pepe. The original team is exploring using the remaining 3.79 trillion tokens, attributed to the Centralized Exchange (CEX) multi-sig wallet, for strategic partnerships and marketing opportunities. 

The PEPE community can expect regular updates on future token burns, movements, or uses through Twitter and the official telegram channel.

PEPE Price Skyrockets By 25.83% In 24 Hours

As of today, the price of Pepe (PEPE) stands at US$0.000000930549, with a 24-hour trading volume of $455,035,042.79. This represents a significant price increase of 25.83% in the last 24 hours and a 43.63% increase over the past 7 days. 

With a circulating supply of 420 billion PEPE, Pepe currently holds a market capitalization of $398,014,904.

On the other hand, SHIB is currently priced at $0.00000739, with a 24-hour trading volume of $314,695,140.13. 

Over the past 24 hours, SHIB has experienced a price increase of 2.72% and a 6.04% increase over the past 7 days. With a circulating supply of 590 billion SHIB, Shiba Inu has a market capitalization of US$4,348,847,496.

Meanwhile, DOGE is trading at $0.065989, with a 24-hour trading volume of $1,064,277,555.26. Over the past 24 hours, DOGE has seen a price increase of 3.02% and an 11.02% increase over the past 7 days. 

With a circulating supply of 140 billion DOGE, Dogecoin holds a market capitalization of US$9,327,269,145.

The recent price movements and market activities of these meme coins reflect the renewed confidence and interest in the cryptocurrency market. Furthermore, these numbers solidify PEPE’s position as the standout performer in the market.

Featured image from Shutterstock, chart from TradingView.com 

Read More