Crypto Corner Café

Taste The Future

Blockchain

Blockchain

Ethereum Resilient Above $1,800 Pre-FOMC Meeting – Details

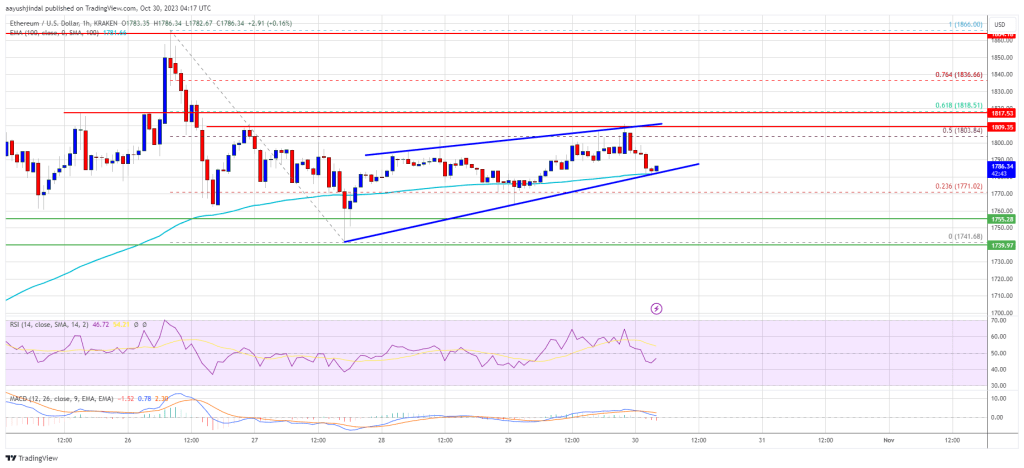
Ethereum (ETH), one of the leading cryptocurrencies, is displaying remarkable resilience in the face of recent market fluctuations. Despite experiencing relatively modest gains compared to Bitcoin (BTC) and other major altcoins, ETH has managed to consolidate its position above the $1800 mark.

The big question on everyone’s mind is whether Ethereum can sustain this level or if it will succumb to the prevailing market sentiment.

In the world of cryptocurrencies, prices are highly susceptible to market sentiment. Cryptocurrencies often exhibit dramatic price swings based on the emotions and perceptions of investors and traders. Positive sentiment tends to drive prices up, while negative sentiment can lead to sharp declines. In this particular instance, the catalyst for market sentiment is the upcoming US Federal Open Market Committee (FOMC).

The Role Of FOMC In Influencing ETH And The Crypto Market

The FOMC is a key division of the US Federal Reserve responsible for setting monetary policy in the United States. One of the primary tools at its disposal is the adjustment of interest rates. When the FOMC meetings take place, the decisions made regarding interest rates can have a significant impact on various financial markets, including cryptocurrencies.

If the FOMC decision leans towards a hawkish stance, implying an increase in interest rates, it could result in a surge of bearish sentiment across the cryptocurrency market. In such a scenario, Ethereum sellers might exert pressure, potentially pushing the altcoin below the $1700 mark.

Conversely, a dovish or unchanged policy stance could lead to a more positive sentiment, allowing ETH to maintain its current position and even experience upward momentum.

As of the latest data available on CoinGecko, Ethereum is trading at $1,816, showcasing a 1.8% gain over the last 24 hours and a notable 8.8% increase over the past seven days. While these gains may appear modest when compared to the cryptocurrency market’s usual volatility, they reflect Ethereum’s capacity to maintain a steady footing in turbulent times.

Ethereum Layer 2 Solutions Break Records

A noteworthy development in the Ethereum ecosystem is the remarkable performance of Layer 2 (L2) solutions. These scaling solutions are designed to alleviate Ethereum’s network congestion and high gas fees.

Recently, L2 solutions set a new all-time high in Total Value Locked (TVL), briefly touching $12 billion before stabilizing around $11.89 billion. This achievement surpasses the previous historic high registered back in April at $11.85 billion, signifying the increasing adoption of Ethereum’s Layer 2 solutions.

With the $1,800 threshold serving as a crucial psychological barrier, the ultimate direction of Ethereum’s price movement hinges on the delicate balance between market sentiment and the decisions of key financial institutions. 

(This site’s content should not be construed as investment advice. Investing involves risk. When you invest, your capital is subject to risk).

Featured image from Shutterstock

Read More
Blockchain

Crypto Analyst Presents Uniswap’s UNI As The Next Coin Primed For Breakout

Several altcoins are currently on the rise following Bitcoin’s resurgence, and popular crypto analyst Ali Martinez has singled out the Uniswap UNI token as one of those tokens that could rally further as he projects that UNI is set to break out soon from its current resistance level. 

Why Uniswap Is Poised For A Breakout

In a post shared on his X (formerly Twitter) platform, Martinez noted that the majority of UNI holders were positioned ‘Out of the Money,’ which suggests that the token was preparing for a breakout. Accompanying his post was data from the crypto analytics platform Intotheblock based on the ‘Historical In/Out of the Money’ metric.

The data shows that over 75% of the token holders are ‘out of the money’, which means that they were yet to break even in their investments as the average cost price at which they bought these tokens is greater than its current price. 

More addresses are out of the money | Source: IntoTheBlock

Furthermore, the crypto analyst explained that selling pressure has gotten exhausted and that the UNI token has been able to build “an important support” level at around $4. This could serve as a lift-off point for the altcoin.

Key Supply Walls UNI Needs To Break

To further support his breakout theory, Martinez noted two supply walls that UNI “needs” to overcome in order to signal a bullish breakout. According to him, one of these supply walls is at $4.23, where data from Intotheblock shows that 7,000 addresses have bought 14.24 million worth of UNI. 

The other supply wall is at $4.45, where data from Intotheblock shows that 2,000 Uniswap addresses have accumulated 10.28 million worth of UNI. Whales and institutional players may also be aware of this potential breakout and may be looking to position themselves, as Martinez noted. 

The crypto analyst also recently commented on a potential Ethereum breakout. In a different post on his X platform, he said that the second largest cryptocurrency by market cap will need to overcome the huge supply wall at $1,960, where data from Intotheblock showed that 1.14 million addresses bought close to 33 million ETH.

Meanwhile, Martinez believes that now is a good time for people to accumulate Bitcoin based on his examination of the past two cycles from the market bottom and the present Bitcoin trend. According to him, a similar trajectory points to the next Bitcoin market top being around October 2025.

At the time of writing, the UNI token is trading at around $4.10, according to data from CoinMarketCap. 

Read More
Blockchain

Bitcoin Price Poised For Another Surge Like Last Week: Here’s Why

In a recent statement via X (formerly Twitter), Alex Thorn, head of firm wide research at digital asset firm Galaxy, highlighted the potential for another Bitcoin gamma squeeze similar to the one witnessed last week. BTC gained 15% last week. He remarked, “The Bitcoin gamma squeeze from last week could happen again. If BTCUSD moves higher to $35,750-36k, options dealers will need to buy $20m in spot BTC for every 1% upside move, which could cause explosiveness if we begin to move up towards those levels.”

Elaborating on the mechanics, Thorn explained the behavior of dealers in relation to gamma and delta. “When dealers are short gamma and price moves up, or when they are long gamma and price moves down, they need to buy spot to stay delta neutral. Last week’s expiries will dampen potential explosiveness, but it’s still in play.” This essentially means that the actions of options dealers, driven by the need to maintain a neutral position, can amplify price movements.

Will Bitcoin Price Rally Like Last Week?

Thorn also emphasized the importance of on-chain data in understanding these dynamics. He mentioned a continued divergence between the supply held by long-term holders and the supply that has moved in less than 24 hours. This divergence, which has been growing over the past year, indicates a decline in on-chain liquidity, suggesting that long-term holders are not selling their holdings, potentially leading to a supply squeeze.

Furthermore, Thorn pointed to the 4-year rolling Z-score of the ratio of market price to realized price, a variation of the MVRV ratio. This metric provides insights into Bitcoin’s valuation relative to its historical average. A high positive Z-score indicates potential overvaluation, while a negative Z-score might suggest undervaluation. Thorn’s observation that the pattern is beginning to resemble those seen before previous bull runs is particularly noteworthy.

Another crucial observation made by Thorn pertains to the compression of relative cost bases. He noted a tightening pattern that has historically been observed during bear or accumulation periods that precede bull markets. This compression suggests that there is a consensus among different types of holders about the value of Bitcoin.

Thorn’s analysis of the Bitcoin supply by the price at which each coin last moved is particularly illuminating. He observed a sparse cost basis between the current price of $34,591 and the $38,400-39,100 range. Moreover, with 83% of the supply not having moved since prices were lower than today and nearly 70% of the supply stagnant for over a year, it’s evident that long-term holders are in profit and are likely waiting for even higher prices before selling.

Last week, as reported by NewsBTC, Thorn had accurately predicted a gamma squeeze. He had emphasized the significant role the options market played in influencing Bitcoin’s price trajectory. Thorn warned, “We are approaching max pain for gamma shorts.”

In summary, while Thorn does not make a direct prediction about Bitcoin’s near-term price, his analysis on X provides a comprehensive overview of the current market dynamics. The combination of potential gamma squeezes, declining on-chain liquidity, and historical patterns all point towards a favorable environment for Bitcoin bulls.

At press time, BTC traded at $34,249.

Read More
Blockchain

Charting The Dogecoin Path: More Gains On the Horizon?

Dogecoin (DOGE) continues its remarkable ascent in the cryptocurrency market, garnering attention from investors and enthusiasts alike. Over the past two years, DOGE has exhibited a strong affinity for an ascending trendline, which has played a pivotal role as a dynamic support mechanism.

This trendline, indicative of the coin’s consistent upward trajectory, has become a defining feature of the meme coin’s journey.

In the last six months, the price of Dogecoin has entered a consolidation chapter, repeatedly rebounding off the ascending support trendline situated in the $0.055-$0.06 range.

The significance of this pattern lies in the coin’s resilience to market fluctuations, bolstered by the unwavering support from its community of investors.

As of the latest data from CoinGecko, DOGE is currently trading at $0.068750, with a 0.6% gain in the past 24 hours and an impressive 10.8% surge over the past week. This upward momentum reflects the coin’s resilience and growing appeal among traders and investors.

Dogecoin Potential Upsurge

A notable technical pattern that has emerged is the formation of a double bottom, signifying a potential bullish trend. This pattern suggests that DOGE’s price could experience a substantial 20% rally, contingent on buyers maintaining support above the immediate threshold of $0.067.

The recent surge in meme coins, including DOGE, Shiba Inu (SHIB), and Floki Inu (FLOKI), has added to the excitement in the cryptocurrency sphere.

The growing enthusiasm can be attributed to the buzz surrounding the Bitcoin Exchange Traded Fund (BTC ETF), which has sent ripples across the crypto market and turned it a vibrant shade of green.

Understanding The Ascending Trendline

The significance of DOGE’s affinity for the ascending trendline cannot be overstated. This trendline serves as a visual representation of the coin’s consistent bullish trajectory over the past two years.

As the price of DOGE hovers in the $0.055-$0.06 range, it reaffirms the coin’s resilience and stability, making it an attractive option for both long-term and short-term investors.

The formation of a double bottom pattern in DOGE’s price chart is a promising development for traders. This pattern typically suggests that the coin is on the verge of a bullish trend reversal.

If buyers manage to uphold the immediate support level of $0.067, there is a potential for DOGE to embark on a significant 20% rally, offering traders an enticing opportunity for profits.

DOGE’s sustained journey along its ascending trendline, coupled with the potential of a double bottom pattern, paints an optimistic picture for the coin’s future.

As the broader cryptocurrency market experiences a surge in meme coin popularity, driven by the BTC ETF hype, DOGE enthusiasts eagerly await what the future holds for this beloved meme-inspired cryptocurrency.

(This site’s content should not be construed as investment advice. Investing involves risk. When you invest, your capital is subject to risk).

Featured image from Shutterstock

Read More
Blockchain

November Outlook For Bitcoin Price: Another Pump Or Retrace?

November has often been a standout month for Bitcoin, with historical data indicating an impressive average price jump of 43%. This would propel Bitcoin to around $48,000. But with October already showing a significant price increase, the question arises: Will Bitcoin continue its bullish trend, or is a retrace on the horizon?

November Monthly Returns

November has been particularly bullish for Bitcoin over time, with an average of 43% of price increases over the years. If this trend holds true for this year, we might see Bitcoin touching $48,000.

Related Reading: Bitcoin Price To Reach $170,000 in 2025 – Mathematical Model Predicts

However, it’s worth noting that this very high average is significantly influenced by the extreme 453% surge in 2013. If we exclude this outlier, the average settles around 11.54% This leads to a more conservative forecast, pointing to a potential rise to around $38,000.

Diving deeper into historical data, 8 of the past 13 years have shown price increases in November, making another increase this month seem plausible. Yet, a closer look reveals that 4 of the last 5 times in November there was a price dip.

In 2022, the FTX collapse played a pivotal role and 2021 marked the peak for Bitcoin, suggesting that these decreases might be outliers rather than indicative of a changing trend.

For a closer comparison, 2019 stands out as it too was a pre-halving year, just like 2023. That year, after a promising October, Bitcoin saw a 17% dip in November, which would equate to a value of $28,000 if repeated this year.

Bitcoin Price Action In 2023

Through 2023, Bitcoin has demonstrated a recurring behavior following significant price increases of more than 20%. Typically, these surges have been followed by consolidation periods, and subsequently, a retrace to at least half of the initial increase.

Related Reading: Bitcoin Season: Leading The Charge In The Crypto Market

Take January, for instance. Bitcoin’s price increased from $16,500 to $24,000, only to decline to $20,000 by March – a retrace of 60% from the initial increase.

One particularly extreme example was in August when Bitcoin retraced the entirety of a prior 20% rise.

It’s noteworthy that these retraces haven’t always been immediate. After the rise in March, it wasn’t until June – a span of three months – that the price saw a 50% retrace. On average, this year’s price retraces have taken between 1 to 3 months to manifest post-rise.

Furthermore, before any retrace occurs, there’s still room for additional upside. To illustrate, after the aforementioned March rise, Bitcoin experienced an additional 10% increase before eventually retracing the initial surge.

Potential Scenarios For November
Using the above, potential scenarios for November are listed below:

Very bullish scenario: Bitcoin rises by 10-20%, potentially reaching up to $42,000.
Bullish scenario: Bitcoin rises by 1-10%, potentially reaching up to $38,000.
Bearish scenario: Bitcoin decreases by 10%, dropping to around $31,000. This would mean a 50% retrace of the surge in October.
Very bearish scenario: Bitcoin decreases by 20%, dropping to around $28,000. This would mean a 100% retrace of the surge in October.

In conclusion, given past trends and current market behavior, November promises to be a pivotal month for Bitcoin.

Predycto is the author of a cryptocurrency newsletter. Sign up for free. Follow @Predycto on Twitter.

Read More
Blockchain

Crystal Ball For Solana: Envisioning A Staggering 2030 Valuation

A recently released report explores the future potential of blockchain technology, particularly focusing on the revival and growing influence of Solana (SOL) in the crypto market.

Asset and mutual fund manager VanEck disclosed one key driver of Solana’s influence is its advancements in Smart Contract Platforms (SCPs), defined as systems that execute contracts on a blockchain without requiring third-party involvement.

Although other SCP-compatible blockchains exist, such as BNB Chain and Ethereum (ETH), Solana has notably dominated this sector. VanEck’s analysis suggests that this sector, particularly SCPs, is poised for significant adoption in the future, positioning Solana as a prominent player in the blockchain industry.

Solana’s Dominance In Smart Contract Platforms

Solana’s emergence as a dominant force in the SCP realm is reinforced by its high throughput and scalability, surpassing many existing blockchain networks. Its ability to process a high volume of transactions quickly and at a lower cost compared to some competitors has been a pivotal factor driving its influence and potential for widespread adoption.

Additionally, Solana’s ecosystem has seen a surge in decentralized applications (dApps) and projects leveraging its infrastructure, further solidifying its position as an attractive and viable platform for developers and users alike. This growing adoption and technical superiority hint at a promising trajectory for Solana, suggesting it may remain a key player in the expanding landscape of blockchain technology.

The VanEck report underscored the undeniable dominance of Solana in the SCP sector. But despite these existing alternatives, none have managed to rival Solana’s current supremacy within the field. VanEck further highlighted the sector’s imminent surge in adoption, foreseeing a promising growth trajectory by 2030.

However, the report also emphasized the necessity of a groundbreaking application for exponential expansion. According to VanEck, among the contenders, Solana stands as the most fitting platform with the potential to fill this pivotal role, positioning itself as the likely candidate to lead the sector’s transformative growth.

VanEck observed that the blockchain hosting the groundbreaking application could experience substantial benefits from the app’s generated activity. The analysis presents a scenario where Solana becomes the pioneering blockchain to support a single application that brings on board over 100 million users.

Over the past week L1s have started to see a shift in sentiment.$SOL activity for the month has translated to sharp increased in DEX volume activity as TVL and users have seen an uptick.

Is this the start of a new trend? pic.twitter.com/wfFyYlvBVS

— Artemis (@artemis__xyz) October 26, 2023

Artemis’s Analysis: Solana’s Resurgence and Growth

Meanwhile, Artemis, an institutional digital asset data platform, recently highlighted Solana’s remarkable resurgence, underscoring the project’s growth. In an October 26 post on X (formerly Twitter), Artemis expressed being impressed by Solana’s performance, citing key metrics such as Total Value Locked (TVL), decentralized exchange (DEX) volume, active addresses, and transactions.

Notably, Artemis emphasized its expectations for the network’s future improvement, especially with its 100% uptime since March 2023. The collective positive sentiments from both Artemis and the asset management firm shed light on Solana’s recovery and significant potential, as detailed in their respective analyses.

At the time of writing, Solana (SOL) was trading at $32.83, up 3.5% in the last 24 hours and registered a decent 7.8% increase in the last seven days, according to figures by Coingecko.

(This site’s content should not be construed as investment advice. Investing involves risk. When you invest, your capital is subject to risk).

Featured image from TechSAA

Read More
Blockchain

MATIC Price Prediction: Polygon Could Blast 10% To $0.70

MATIC price is consolidating gains above the $0.58 support zone. Polygon might gain bullish momentum if it clears the $0.650 resistance zone.

MATIC price is showing positive signs below the $0.65 resistance against the US dollar.
The price is trading above $0.60 and the 100 simple moving average (4 hours).
There is a key contracting triangle forming with resistance near $0.640 on the 4-hour chart of the MATIC/USD pair (data source from Kraken).
The pair could continue to rise if it clears the $0.640 and $0.650 resistance levels.

Polygon’s MATIC Price Aims Higher

After forming a base above the $0.50 level, Polygon’s price started a steady increase. MATIC broke many hurdles near $0.550 to move into a positive zone, like Bitcoin and Ethereum.

There was a move above the $0.60 resistance and the price climbed as high as $0.6646. Recently, there was a minor downside correction below the $0.640 level. The price declined below the 23.6% Fib retracement level of the upward move from the $0.5032 swing low to the $0.6646 high.

MATIC is now trading above $0.60 and the 100 simple moving average (4 hours). There is also a key contracting triangle forming with resistance near $0.640 on the 4-hour chart of the MATIC/USD pair.

Source: MATICUSD on TradingView.com

Immediate resistance is near the $0.640 level. The first major resistance is near the $0.650 level. If there is an upside break above the $0.650 resistance level, the price could continue to rise. The next major resistance is near $0.665. A clear move above the $0.665 resistance could start a steady increase. In the stated case, the price could even attempt a move toward the $0.680 level or $0.700.

Downside Correction in MATIC?

If MATIC’s price fails to rise above the $0.640 resistance level, it could start a downside correction. Immediate support on the downside is near the $0.6100 level.

The main support is near the $0.584 level or the 50% Fib retracement level of the upward move from the $0.5032 swing low to the $0.6646 high. A downside break below the $0.584 level could open the doors for a fresh decline toward $0.550. The next major support is near the $0.532 level.

Technical Indicators

4 hours MACD – The MACD for MATIC/USD is gaining momentum in the bullish zone.

4 hours RSI (Relative Strength Index) – The RSI for MATIC/USD is now above the 50 level.

Major Support Levels – $0.610 and $0.584.

Major Resistance Levels – $0.640, $0.650, and $0.700.

Read More
Blockchain

Ethereum Price Faces Big Move – Can Bulls Send ETH To $2,000?

Ethereum price is consolidating gains below the $1,850 resistance against the US dollar. ETH must stay above the $1,750 support to start a fresh increase.

Ethereum is still struggling to gain pace for a move above $1,850.
The price is trading above $1,770 and the 100-hourly Simple Moving Average.
There is a key contracting triangle forming with support near $1,780 on the hourly chart of ETH/USD (data feed via Kraken).
The pair could extend its decline if it fails to stay above the $1,740 support.

Ethereum Price Remains In Range

Ethereum failed to continue higher above the $1,850 level and started a downside correction. ETH corrected lower below $1,800, but the bulls remained active near $1,750.

A low was formed near $1,741 and the price is now making a fresh attempt to gain pace, like Bitcoin. There was a move above the $1,780 level. The price tested the 50% Fib retracement level of the downward move from the $1,866 swing high to the $1,741 low.

Ethereum is now trading above $1,770 and the 100-hourly Simple Moving Average. There is also a key contracting triangle forming with support near $1,780 on the hourly chart of ETH/USD.

On the upside, the price is facing resistance near the $1,800 level. The first major resistance is near the $1,815 zone. It is near the 61.8% Fib retracement level of the downward move from the $1,866 swing high to the $1,741 low.

Source: ETHUSD on TradingView.com

A close above the $1,815 resistance could start a decent increase. In the stated case, Ether could revisit the $1,850 resistance. The next key resistance is near $1,865, above which the price could accelerate higher. In the stated case, the price could rise toward the $1,920 level. The main hurdle sits at $2,000.

Another Decline in ETH?

If Ethereum fails to clear the $1,815 resistance, it could start another decline. Initial support on the downside is near the $1,780 level, the 100-hourly Simple Moving Average, and the trend line.

The next key support is $1,740. A downside break below the $1,740 support might send the price further lower. In the stated case, Ether could drop toward the $1,700 level.

Technical Indicators

Hourly MACDThe MACD for ETH/USD is losing momentum in the bullish zone.

Hourly RSIThe RSI for ETH/USD is now below the 50 level.

Major Support Level – $1,720

Major Resistance Level – $1,815

Read More
Blockchain

Bitcoin Price Consolidates Below $35K – Here’s What Could Trigger Bearish Reaction

Bitcoin price attempted a fresh increase above the $34,500. BTC could start a major downside correction if there is a close below the 100 hourly SMA.

Bitcoin is still struggling to clear the $35,000 resistance.
The price is trading above $34,200 and the 100 hourly Simple moving average.
There is a key rising channel forming with support near $34,300 on the hourly chart of the BTC/USD pair (data feed from Kraken).
The pair could decline sharply if there is a close below $34,000 and then $33,400.

Bitcoin Price Holds Key Support

Bitcoin price started another increase above the $34,200 resistance zone. BTC climbed higher toward the $35,000 resistance zone, but there was lack of momentum.

The price traded as high as $34,758 and struggled to continue higher. It is now correcting gains below the $34,500 level. There was a move below the 23.6% Fib retracement level of the upward move from the $33,318 swing low to the $34,758 high.

Bitcoin is now trading above $34,200 and the 100 hourly Simple moving average. There is also a key rising channel forming with support near $34,300 on the hourly chart of the BTC/USD pair.

On the upside, immediate resistance is near the $34,500 level. The next key resistance could be near $34,750 or the channel upper trend line. The main resistance is still near the $35,000 zone. A clear move above the $35,000 resistance might start another steady increase.

Source: BTCUSD on TradingView.com

The next key resistance could be $35,500, above which the price could test $36,200. Any more gains might send BTC toward the $36,500 level in the near term.

Downside Correction In BTC?

If Bitcoin fails to rise above the $34,750 resistance zone, it could start another decline. Immediate support on the downside is near the $34,200 level and the 100 hourly Simple moving average.

The next major support is near the $34,000 level or the 50% Fib retracement level of the upward move from the $33,318 swing low to the $34,758 high. If there is a move below $34,000, there is a risk of more downsides. In the stated case, the price could decline toward the $33,400 level or even $32,500.

Technical indicators:

Hourly MACD – The MACD is now losing pace in the bullish zone.

Hourly RSI (Relative Strength Index) – The RSI for BTC/USD is now below the 50 level.

Major Support Levels – $34,200, followed by $34,000.

Major Resistance Levels – $34,500, $34,750, and $35,000.

Read More
Blockchain

Analyst Predicts Terra LUNA To Surge By 80-100% Following Key Event

LUNA, the native token of the Terra 2.0 blockchain, was among the many gainers in the past week positively affected by Bitcoin’s impressive rally toward the $35,000 mark.

According to data from CoinMarketCap, LUNA is up by 13.96% in the last seven days, providing some relief for investors who have had to endure the token’s bearish form in the previous weeks leading to this price rise. 

As expected, LUNA’s current bullish form has now attracted much attention, with some analysts speculating there could be more gains in the coming weeks. 

LUNA Could Double Its Value After Breaching Major Trendline, Analyst Says

In a post on X on Sunday, crypto analyst Captain Faibik shared with his 67,000 followers an intriguing bullish prediction on LUNA’s price trajectory.

Faibik, who claimed to not be a LUNA enthusiast, noted that the altcoin has recently broken a major bearish trendline and could potentially gain by 80-100%.

I may not be a fan of this coin, but I receive frequent Chart Requests for it.$LUNA has broken a Major trendline and could potentially see a bullish rally of 80-100%. #Crypto #LUNA #LUNAUSDT pic.twitter.com/R9UEmxK2Bx

— Captain Faibik (@CryptoFaibik) October 29, 2023

According to Faibik’s analysis, LUNA traded above $0.47 in the past week, breaching a bearish trendline that stretches as far back as January 2023 on the token’s daily chart.

Traditionally, trendlines are used by traders to connect several price points together and provide some insight into the potential direction of an asset’s price movement. 

When an asset’s price moves out of an established trendline, as in the case of LUNA, it can be interpreted as an impending price reversal.

Since the start of 2023, LUNA has produced an overall negative price performance, losing over 63% of its value in the last 10 months. However, if Faibik’s prediction proves true, the popular altcoin could be on its way to a remarkable recovery. 

At the time of writing, LUNA trades at $0.468 with a 0.70% decline in the last day. With an 80-100% price increase, this price could rise as high as $0.934 in the coming weeks.

Meanwhile, LUNA’s daily trading volume is currently down by 3.73% and valued at $48.67 million. With a market cap of $263.92 million, LUNA is ranked as the 117th largest cryptocurrency.

Related Reading: Is Terra Classic Planning For USTC To Be Pegged To The Dollar Again?

Terra Community Approves New Proposal 

In other news, the Terra Community has recently passed governance proposal 4790 aimed at the active and aggressive development of the Terra ecosystem with resources provided by Terraform Labs.

Under this newly approved proposal, Terraform Labs, alongside Terra community partners, will explore opportunities to utilize non-LUNA capital in driving the growth of the project’s economy. 

In addition, 125 million LUNA will be staked by a Terra community council to encourage and reward active network engagement, offer essential services to support the ecosystem, and guarantee equitable decentralization.

Read More