Crypto Corner Café

Taste The Future

Blockchain

Blockchain

Bitcoin Price Topside Bias Vulnerable If It Continues To Struggle Below $35K

Bitcoin price is still struggling to clear the key $35,000 resistance. BTC might correct lower and revisit the $34,000 support zone if it continues to struggle near $35,000.

Bitcoin is still facing a major hurdle near the $35,000 resistance.
The price is trading above $34,250 and the 100 hourly Simple moving average.
There is a key bullish trend line forming with support near $34,260 on the hourly chart of the BTC/USD pair (data feed from Kraken).
The pair could correct lower, but the bulls might remain active near $34,000.

Bitcoin Price Remains Supported

Bitcoin price attempted another increase above the $34,750 resistance. BTC spiked above the $34,950 level. However, the price remained capped below the main barrier at $35,000.

A high was formed near $34,953 and the price recently corrected lower. It traded close to the $34,000 level. A low was formed near $34,060 and the price is now attempting a fresh increase. There was a move above the $34,500 level.

It climbed above the 50% Fib retracement level of the downward move from the $34,953 swing high to the $34,060 low. Bitcoin is now trading above $34,260 and the 100 hourly Simple moving average. There is also a key bullish trend line forming with support near $34,260 on the hourly chart of the BTC/USD pair.

On the upside, immediate resistance is near the $34,650 level. The next key resistance could be near $34,750 or the 76.4% Fib retracement level of the downward move from the $34,953 swing high to the $34,060 low.

Source: BTCUSD on TradingView.com

The main resistance is still near the $35,000 zone. A clear move above the $35,000 resistance might start a decent increase. The next key resistance could be $35,500, above which the price could rise toward $36,200. Any more gains might send BTC toward the $37,500 level.

Bearish Reaction In BTC?

If Bitcoin fails to rise above the $34,650 resistance zone, it could start a downside correction. Immediate support on the downside is near the $34,270 level and the 100 hourly Simple moving average.

The next major support is near the $34,000 level. If there is a move below $34,000, there is a risk of more downsides. In the stated case, the price could drop toward the $33,500 level or even $33,200.

Technical indicators:

Hourly MACD – The MACD is now gaining pace in the bearish zone.

Hourly RSI (Relative Strength Index) – The RSI for BTC/USD is now just above the 50 level.

Major Support Levels – $34,260, followed by $34,000.

Major Resistance Levels – $34,650, $34,750, and $35,000.

Read More
Blockchain

Floki Inu (FLOKI) Claps Back: Counters Bitget’s Claim Of Breaching 7-Day Listing Deadline

Recently, the cryptocurrency community has witnessed a heated dispute between the protocol Floki Inu (FLOKI) and the crypto exchange Bitget

The controversy arose following Bitget’s listing of TokenFi (TOKEN) and subsequent accusations of market manipulation, unauthorized listing, and insufficient solvency.

Bitget Faces Allegations Of Market Manipulation

On October 27, 2023, Bitget announced the listing of TokenFi (TOKEN) in the Innovation Zone of its Spot market. Shortly after the trading service for TokenFi commenced, significant price fluctuations were observed, prompting suspicions of market manipulation. 

Concerns were further raised when it was discovered that TokenFi’s project team had contributed less than $2,000 worth of tokens to the liquidity pool of decentralized exchanges (DEXes), suggesting potential manipulation of initial liquidity.

Moreover, an investigation of the TokenFi project uncovered additional issues, including an “opaque” token economy and an unclear vesting schedule. 

In light of these findings and to safeguard their users, Bitget decided to delist TokenFi (TOKEN) and initiated a buyback plan for users who held the token on its platform.

Floki Inu, responded strongly to the exchange’s actions, alleging that Bitget had violated their agreement not to list TOKEN until seven days after its launch. 

The meme coin protocol claimed to have had conversations with “several Tier 1 exchanges” and respected parties in the cryptocurrency industry. While these exchanges had expressed interest in listing TOKEN earlier, they agreed to honor Floki Inu’s request to wait for the stipulated period. 

However, Bitget, which, according to Floki Inu, was “the smallest exchange” among those involved, allegedly announced the listing of a fake version of the TOKEN token just 12 minutes before the official launch on the blockchain.

Floki Inu further asserted that Bitget had engaged in “deceptive trading practices,” manipulating TOKEN’s volume without evidence of holding the actual tokens. 

The protocol alleges that Bitget’s initial announcement had even stated that withdrawals would open 24 hours after trading began, potentially indicating an attempt to manipulate the token’s price. However, the market response did not align with Bitget’s expectations, resulting in a significant financial loss.

The situation escalated when users began reporting difficulties in withdrawing TOKEN from Bitget’s platform, with some users allegedly being banned for complaints. Floki Inu claimed to have contacted Bitget to address the issue, but the response was unsatisfactory, including a request to report liquidity issues to Bitget’s support team.

Floki Inu Alleges Bad Faith

Following subsequent discussions between Floki Inu and Bitget, it was revealed that Bitget required up to 1 billion TokenFi tokens to meet user withdrawal demands and cover their financial deficit. According to Floki’s response, this amounted to approximately 10% of TokenFi’s total supply, equivalent to around $20 million at the time of Bidget’s statement.

Furthermore, the protocol accused Bitget of acting in “bad faith” and attempting to resolve the situation through an over-the-counter (OTC) deal at a deeply discounted rate. 

The proposed discount of 90% from the market price raised concerns, as it was argued that Bitget should bear the responsibility for its actions and the resulting financial shortfall.

In response to Bitget’s announcement of delisting TokenFi and accusations of market manipulation, Floki Inu disputed the claims made by Bitget. They asserted that Bitget had listed the token against their explicit instructions and falsely accused the Floki Inu team of price manipulation. 

Floki also challenged Bitget to provide verifiable evidence of their TOKEN and FLOKI holdings, expressing concerns about Bitget’s overall solvency and risk management practices.

Ultimately, the protocol cautioned its users against trading or holding FLOKI on Bitget, citing the “troubling patterns” witnessed during the TokenFi incident. As the situation develops, the cryptocurrency community awaits further clarification and resolution regarding the allegations and the impact on affected users.

Given these developments,  FLOKI has experienced a retracement of over 9% in the past 24 hours and is currently trading at $0.00003250. Nonetheless, the token has seen an impressive 85% increase over the past fourteen days. 

Featured image from Shutterstock, chart from TradingView.com

Read More
Blockchain

A Chat With Dave Weisberger: Why Bitcoin Entered A “Perfect Storm”

The price of Bitcoin might be losing bullish momentum in the short term, but on higher timeframes, the cryptocurrency is likely to extend its current rally. At least, this is part of what we spoke with Dave Weisberger, co-founder and co-CEO at CoinRoutes, a liquidity and algorithmic trading tool provider for the crypto market.

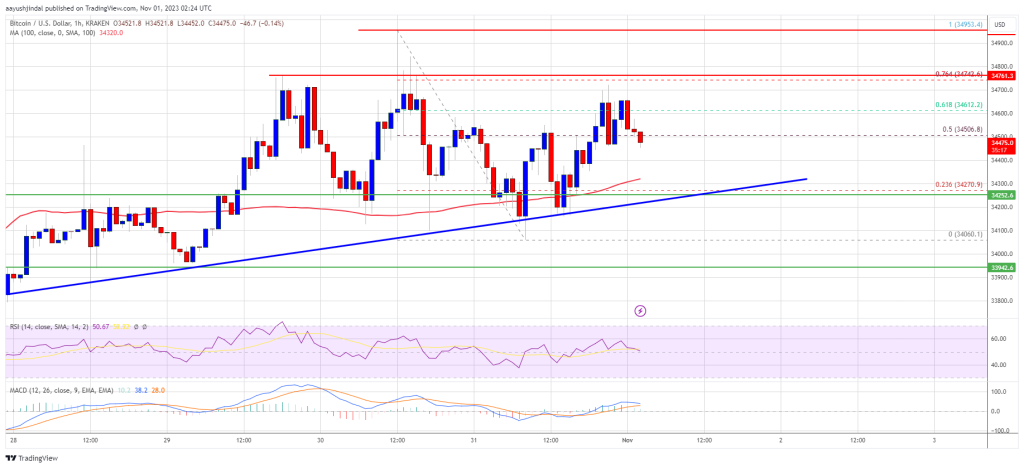
As of this writing, Bitcoin trades at $34,200 with a 2% loss in the last 24 hours. As the bullish momentum seems to fade, some analysts expect BTC to return to the critical support area of around $33,000. This area must hold if BTC bulls want to prevent a more extensive correction.

Bitcoin Becoming Digital Gold, Low Selling, And The Potential For 20x Profits

On the back of the current macroeconomic landscape, Bitcoin has become more relevant as a global financial asset, a store-of-value, and “gold 2.0,” according to CoinRoutes’ co-founder. Weisberger has been sharing his bullish thesis on cryptocurrency and the impact of the spot market on the current rally.

During our conversation, we spoke about the Israel conflict, the current market structure, and the reasons brewing a perfect storm for BTC. This is what he told us:

Q: With a delicate situation in Israel, high inflation, and talks about a potential economic recession, How is the current macroeconomic landscape impacting the Bitcoin price?

A: I think that the easiest way to look at it is to understand the famous quote from Ram Emanuel when you’re in the government, never let a good emergency go to waste. The fact is I don’t believe the Federal Reserve and the treasury have a whole lot of choice anymore. There’s really only one way out of the current macro environment in a real sense. They effectively have two choices. Door number one is to deregulate like crazy, cut taxes like crazy and hope to grow your way out of it. Choice number two is choose the Japanese approach, which is to manage the yield curve to allow the government to continue to function and kick the can down the road so it’s somebody else’s problem later. I actually, I think that there are a couple of candidates that talk about doing door number one, but none of them are in power and none of them are likely to win.

And even if they did win, they’re unlikely to have the congressional support to do the massive amount of deregulation it would take to lean into AI and digital assets and all the new technologies that will allow for a growth rate to be able to grow tax receipts while cutting spending on government programs and government bureaucracy. That seems highly, highly, highly unlikely. It’s what I would do, but I don’t think it’s going to be done. So then you’re stuck in a situation where you have a current administration that is continuing to add spending. James Lavish quotes, I think $1.6 trillion in new debt. It’s a $2 trillion yearly deficit. At the same time that debt service is approaching a trillion dollars and that’s at sub 5%. What happens if we get a normal yield curve with a 2% upward slope to 7% at that point, debt service would literally be debt service plus even a cut defense department would literally be the entire amount of tax receipts.

So if you think about that, there is no escaping the debt spiral that we’re in. The fact is all roads lead to monetary debasement. Now whether rates are high or low, that’s an interesting question. Maybe they’ll keep short rates high to try to put the genie back in the bottle. But the fact is the Bitcoin prices is responsive to the overall amount of money, monetary aggregates and debt. And Bitcoin is quite literally growing into digital gold. And digital gold. If you look at the monetary aggregates or monetary value of gold would imply a Bitcoin price. That’s 15 to 20 times where it currently is. So when you look at Bitcoin at 34,000, it’s like, okay, it’s well bid there and we’ve seen it over the last few days.

When Larry Fink started making this case a few months ago, a couple months ago, it triggered a massive rally. Well now we have Mohamed El-Erian making this case one of the most widely respected bond analysts and just yesterday, Stanley Druckenmiller making this case. So you’re starting to get a shift in the opinion leaders of the economy to say this (BTC) is a hedge against a looming fiscal disaster debt disaster. At some point, Bitcoin will reach a tipping point.

Now your question was about the Israel situation. The fact of the matter is ever since Napoleon, the world knows entering a two front war is probably not going to go well for your fiscal policy.


Q: From a broader perspective, how do the dynamics between spot buying and derivatives trading impact the overall health and sustainability of a potential crypto bull run? Do you think BTC is poised for further profits?

A: Look at CoinRoutes. Our client volumes almost doubled in October compared to September when there’s any interest in this market, liquidity comes out. There’s an old expression in trading; order flow begets order flow, liquidity begets liquidity. The fact is the crypto markets function extraordinarily well.

The fact of the matter is sometimes the volatility in crypto happens because there’s too much speculation around the edges because perpetual swaps are a much more efficient way of getting leverage than option markets are, for example, and the US people in equities use options to get leverage.

It’s much more expensive than perpetual swaps. So the crypto market has this dynamic of a small percentage of the actual liquidity speculating in perpetual swaps around the edges and moves. Things like what we saw this (past weeks) when there was the (Bitcoin ETF) fake news event. It’s kind of funny, the fake news event took Bitcoin from $28,000 to $31,000 in a blink all in the perpetual swaps markets. The spot market moved, but it wasn’t a lot of trading going on because it went up and came right back down. But a funny thing happened, people who were short realized, “oh my god, if this news does come out, I’m going to get carried out in a body bag. I better not short it.” So the natural spot buying that was going on became relentless and pushed the price to now we’re well beyond what are we, 25% above where it was before that fake news story came out.

(…) it basically proves that it was spot buying, not derivative buying because when derivative buying or derivative selling creates a market move, you see gaps in where the perpetual swap gets to be too expensive or much cheaper. When we saw that, if you remember the move down from $29,000 to $26,000 a few months ago, that was a fast five-minute move that move featured perpetual swap prices over a thousand dollars per Bitcoin below the bid on spot markets. And so that was obviously a single de-leveraging event, and that happens and you see it. But what happened last Monday was clearly spot-led because the premium never moved. I mean, it literally never moved. It was moved. The spot actually market led the derivative markets higher. And so there are clearly spot buyers and what’s going on is something that I’ve been chronicling for about eight months, which is we’ve had patient spot accumulation and you can see that in two ways.

If you look at the way things lined up over the last few weeks, the speculators got carried out and saw that in a rally there were no sellers. Well, that’s really scary. If you’re short, you have the condition for what some people would call a God candle. I don’t know about a God candle or otherwise. I think that the most bullish thing Bitcoin can do is stabilize at this level for another few weeks (…). We had seven months of no volatility in that period of time. People levered up on the short side and that’s why this move was so strong.


Q: You mentioned this earlier in your analysis, but can you tell us why Bitcoin entered a “Perfect Storm” scenario?

A: I wouldn’t call it a perfect storm because US regulators are still trying to shut down crypto because crypto is ultimately, it’s not really crypto, it’s digital assets. They’re trying to shut it down, slow it down, and stop it from overtaking the incumbents in finance.

The fact is the US has the number one capital markets in the world. 50% of investible assets are here despite being what 4% of the world’s population that is on the back of having the most efficient analog financial system. So the incumbents would love to delay digitalization or co-opt it. So that’s the one thing that’s going on that’s not perfect. But the perfect storm aspects of it are overseas. So yesterday the UK came out and basically said, listen, “if you’re going to let us be the global hub for digital finance, we’re going to be (…).”

And that is more or less exactly what happened and why the London became the big financial center. It is because of the Eurodollar market, because US regulators pushed the Eurodollar market out of the US and of course it became headquartered in London. So history may not often repeat, but it does rhyme and we see that. But take the regulation to the side, the perfect storm is very simple. It’s burgeoning deficits and monetary debasement on a global scale (…).

(…) fiat currencies have never in financial history ended with anything other than debasement ever, because governments who have the ability to print money out of thin air will do so until the market stops them. It is becoming more and more evident to anybody that the fiat experiment of Bretton Woods, which started in 1971, which isn’t very long in monetary epoch, is coming to an end. Now, will it come to an end now or could we extend it for another 10 to 15 years? Maybe 20? Yeah, maybe. But if you do that, then what’s going to happen (…).

So if you think about a perfect storm, we have an emerging digital society that’s more and more global every day. We need a store of value that people can save in. They want to spend in dollars. And that’s why Tether and stable coins are so important, but they want to save in something that’s a store of value. Bitcoin solves the part of the equation that’s saving not spending. That’s why, yeah, at some point you need the scaffolding to be able to spend the bits or lightning or whatever to be able to spend Bitcoin, but not at these levels. If you’re a Bitcoin holder, why are you buying a cup of coffee with Bitcoin? You want to be made fun of, like the pizza guy, doesn’t make sense because you think it’s going to go up 20, 30 or more times. That makes it a very expensive cup of coffee. So, Bitcoin is a savings vehicle and stable coins are a spending vehicle, and Ethereum is a technology platform to allow the world to go more and more digital. And so all of these things are happening and the meta trends are all for them. The macro trends in the economy are all for monetary debasement and trying to get out of a debt spiral. And the more geopolitical instability, the more likely that debt spiral is to materialize.

Cover image from Unsplash, chart from Tradingview

Read More
Blockchain

Ethereum Price Prediction: Analyst Reveals Where ETH Will Be By End of 2023

Prominent cryptocurrency analyst Dmitry Noskov from the  European-based trading platform StormGain has recently shed light on his predictions concerning Ethereum (ETH) and has revealed where the digital asset ought to be by the end of the year.

Dmitry Noskov On Ethereum (ETH) Price Movement

The crypto analyst predictions were fueled by the current growth of the cryptocurrency market due to the forthcoming Bitcoin halving in 2024. He highlighted that the market growth will continue to grow till the end of the year, and Ethereum is set to grow with it.

“We can say that the cryptocurrency market is now on a wave of growth, which may continue until the end of the year. The target for Ethereum before the new year may be $1800-$1900. It can also break the psychological level of $2,000,” Noskov stated.

Dmitry’s recent ETH predictions can also be traced back to the excitement and propaganda from the cryptocurrency community and the positive development encompassing a potential approval of Spot Bitcoin exchange-traded fund (ETF). 

“The positive developments around the potential approval of a Bitcoin (BTC) spot exchange-traded fund (ETF) have boosted other cryptocurrencies, including ETH,” Noskov stated.

Dmitry Noskov is not the only one who has shared projections on the price of Ethereum by the end of the year. Several other analysts have also shed light on their optimism about how Ethereum is expected to finish the year.

In July, finance platform Finder sought 32 fintech and cryptocurrency analysts for them to offer their year-end price predictions for Ethereum. From the details shared with Finbold, the experts believe that the digital asset will finish the year at $2,451, presenting over 30% price surge from the current price of Ethereum.

The future predictions for Ethereum were much more promising. Specifically, the experts predict that ETH will reach $5,845 by the end of 2025.

One of the finance experts Mitesh Shah, Chief Executive Officer and founder of Omnia gave his end-of-year predictions for Ethereum, which appeared to be in check with the panel’s consensus projections. Shah also believes that the digital asset is the exceptional second choice of investment for institutional and ordinary investors alike.

“Ethereum remains the standout second choice investment for both the retail and institutional investors alike. Following the successful upgrade to proof of stake, akin to “changing a jet plane engine, mid-flight,” ETH has become more efficient and deflationary, to mention a few,” Shah stated.

Lately, the cryptocurrency has garnered momentum, slowly heading toward the $1850 resistance level. The digital asset is set to go higher if it crosses the $1850 resistance level. Ethereum is currently sitting at approximately $1797 as of the time of writing.

Read More
Blockchain

Cardano Bearish Signal: Dormant ADA Whales Are On The Move

Cardano (ADA) may be turning bearish once more after whales began moving again. This activity was brought to light by the on-chain data tracker Santiment which showed unusual activity in dormant ADA wallets after the price crossed $0.3.

Cardano Sharks And Whale Start Moving Coins

In the report that was posted on X (formerly Twitter) by the on-chain data tracker, Cardano shark and whale addresses (that is addresses holding between 100,000 and 10 million ADA on their balances), as well as old coins, have been showing a lot of activity.

Most of this activity could be detrimental to the current ADA recovery given that these large holders have been moving their previously dormant coins. The Santiment report shows that old ADA coins are moving back into circulation once more.

It showed that the crypto just marked its largest day of old coins being moved around. The last time that this metric was this high, as pointed out by the tracker, was back in April 2022, and historical performance does not spell good news following this.

What Happened To ADA Price Last Time?

Back in April 2022 when a similar volume of old coins began moving back into circulation, it spelled doom for the ADA price. Looking at the chart in 2022 shows that ADA had finished out the month of March strong at a price of $1.21. However, once these coins began moving, it was game over.

April 2022 saw the ADA price fall from $1.21 to $0.8 before the month was over, meaning a 33% drop in price. The downtrend would carry on into the later part of the year and by December 2022, the ADA price had fallen as low as $0.24.

If this were to repeat itself, then another 30% drop would send the ADA price below $0.1 in the coming month. This would take the price back to September 2020 levels. However, it is not all bad news for the digital asset given the activity of sharks and whales.

In the same report, Sentiment revealed that Cardano sharks and whales have been buying up ADA rapidly. They had bought a total of 43.71 million ADA in the space of two weeks, now worth more than $131 million at the current price. This suggests bearish sentiment is limited given that large addresses are still accumulating coins.

At this rate, whatever is being dumped on the open market by the dormant wallets will be picked up by the sharks and whales. As long as demand continues to match supply, then the sell-off could have next to a negligible effect on the price of ADA.

Read More
Blockchain

Bitcoin’s Price Tide: Could ASIC Miner Values Signal An Approaching Crypto Surge?

Adam Back, the co-founder and CEO of Blockstream, has recently drawn attention to a notable correlation, which is that the prices of ASIC (Application-Specific Integrated Circuit) miners tend to align with Bitcoin prices.

This parallel trend has been confirmed historically, with the miners peaking in price during the 2021 Bitcoin bull run, just as BTC reached its peak of $69,000.

Back’s analysis shows that even as the market navigates through changing tides, the fate of mining equipment is an important piece of the puzzle for understanding the overall ecosystem.

The CEO of Blockstream also suggests that the price of ASIC miners is not just a reflection of manufacturing costs or technological advancements but also an indicator of market sentiment toward Bitcoin itself.

The Miners’ Market: A Reflection Of Bitcoin’s Value

According to Back in a video posted on X (formerly known as Twitter), during the prelude to the 2021 bull market, the price of ASIC miners was low, mirroring the anticipation and optimism of the Bitcoin community for a significant rally.

However, as Bitcoin’s value skyrocketed, so did the price for these mining machines, hitting a peak of $120/Terrahash (TH) alongside Bitcoin’s all-time high. Yet, with the subsequent decline in BTC value, the demand and price for ASIC miners plummeted, currently trading hands at under $15/TH—a stark contrast to their previous highs.

Despite a positive momentum for Bitcoin this year, ASIC miner prices have remained subdued. However, Back maintains an optimistic outlook for a potential resurgence in ASIC miner prices.

Historically there’s been a high correlation between ASIC miner and #Bitcoin prices. Learn how the new the Blockstream ASIC (BASIC) Note investment opportunity capitalizes on this thesis. Blockstream CEO Dr. @adam3us explains: pic.twitter.com/zHAqhLsGet

— Blockstream (@Blockstream) October 31, 2023

The CEO of Blockstream suggests that as Bitcoin enters deeper into a bull phase, the value of these essential mining components is likely to increase.

Back points to the upcoming Bitcoin Halving — an event that historically impacts Bitcoin’s price due to the reduced rate at which new Bitcoins are generated — as a possible catalyst for Bitcoin’s price surge and a parallel rise in ASIC miner values.

Bitcoin Path To Reclaim $35,000

Despite several predictions and analyses about Bitcoin, the top crypto has continued to move at its own pace. After retracing from the previously tapped $35,000, the asset has begun to thrive to reclaim that price zone.

Currently, the asset trades at $34,269, down by 1.1% in the past 24 hours. However, looking at its weekly performance, Bitcoin still appears to be in gains. Though it has dropped by 0.7% in the past 7 days, it is still up by 20% in the past two weeks.

Back mentioned that the Bitcoin Halving appears as a significant milestone that could precede a notable increase in Bitcoin’s price, typically starting around six months post-halving.

While the CEO of Blockstream hesitates to make a definitive prediction about the exact outcome this time, he remains optimistic about Bitcoin’s prospects, positing that the cryptocurrency could still grow further this year or next year.

Featured image from Unsplash, Chart from TradingView

Read More
Blockchain

FTX Transfers $150M In Assets, Including Ethereum And Solana, Amid Bankruptcy

Blockchain analytics firm Nansen has recently revealed that wallets associated with bankrupt crypto exchange FTX have transferred approximately $156 million worth of digital assets, including Ethereum (ETH) and Solana (SOL), in a series of transactions over the past week. 

The movement of these funds has raised concerns and attracted the attention of industry experts and investors. Nansen’s report sheds light on the ongoing transfers and provides valuable insights into the extent of FTX’s asset movements.

Bankrupt FTX Wallets Unstake $57 Million Worth Of SOL Tokens

According to the Nansen report, funds from FTX wallets have continued to migrate to various exchanges since the previous update. The report specifies the following notable transactions:

695,000 Perpetual Protocol (PERP) tokens worth $423,000
767,000 Biconomy (BICO) tokens worth $182,000
833,000 Kyber Network (KNC) tokens worth $616,000
108 million TrueFI (TRU) tokens worth $420,000
138,000 Band (BAND) tokens worth $221,000
2.5 million Graph (GRT) tokens worth $273,000
845 Maker (MKR) tokens worth $1.17 million
7.16 million Render (RNDR) tokens worth $17.8 million
10.5 million USD Coin (USDC)
23,000 Polygon (MATIC) tokens worth $15,000
9.5 million Ren (REN) tokens worth $500,000
1.1 million ETH tokens worth $2 million

Additionally, the report highlights that an additional 1.6 million SOL tokens worth $57.6 million have initiated the unstaking process. While these funds have not yet left the associated wallet, their potential movement would bring the total SOL tokens moved by FTX to just under $90 million. 

Moreover, considering the unstaking of SOL and the new assets transferred by FTX to Coinbase and Binance, the total value of funds moved by FTX now stands at $156 million.

Major Transfers Of LINK, AAVE, And MKR Unveiled

Nansen’s previous investigation revealed significant transfers from wallets linked to FTX and Alameda Research, FTX’s trading arm.

These funds were initially withdrawn from FTX and Alameda wallets before being sent to intermediary wallets and eventually deposited into Binance and Coinbase. The report discloses the following noteworthy movements:

2.2 million USD worth of Chainlink (LINK) tokens
1 million USD worth of Aave (AAVE) tokens
2 million USD worth of MKR tokens
3.4 million USD worth of ETH tokens

In addition to these transfers, Nansen discovered that 943,000 SOL tokens, equivalent to approximately $32 million, were moved from the FTX Cold Storage wallet.

Overall, the recent findings by Nansen regarding the movement of funds from wallets associated with the bankrupt crypto exchange FTX have sparked concerns within the cryptocurrency community. 

The report highlights substantial transfers of various digital assets, including ETH and SOL, and provides insight into the scale of FTX’s asset movements. 

As of the current market conditions, FTX’s native token, FTT, is trading at $1.23. Despite a false breakout on October 23, where the token briefly surpassed $1,360, it has since declined consistently. 

However, over the past 30 days, FTT has maintained a profit margin of 3.7%, signifying relative stability within this time frame.

Featured image from Shutterstock, chart from TradingView.com 

Read More
Blockchain

Top 5 Bitcoin-Like Altcoins That Could Make You A Millionaire In The Crypto Bull Run

With every crypto bull market, there are always altcoins that take the path of Bitcoin and end up securing good profits for their holders. With the larger options like Bitcoin already big enough to the point that their potential for high upside is limited, here are 5 altcoins that could make a Bitcoin-like run in the next bull market.

Arbitrum (ARB) Leads The Altcoins

Arbitrum (ARB) is a token that was launched less than a year ago in the thick of the bear market and can be said to have done reasonably well since then. The altcoin is still trading under the $1 mark which makes it a prime mark to make a Bitcoin-like rally.

It is also one of the altcoins that are backed by a full-fledged Ethereum Layer 2 network, making it possible for users to carry out transactions for cheap on the Ethereum network. This coin boasts a significant user base and could rally at least 10x in the bull market.

Pepe Coin (PEPE) To Rally In The Crypto Bull Market

Just like Arbitrum, Pepe Coin (PEPE) was launched this year at the height of the bull market but that didn’t stop it from making a splash. The coin went from under $500,000 market cap to over $1 billion in less than a month, which secured it the position of the third-largest meme coin in the space.

PEPE’s price has since retraced with its market cap sitting below $500 million. But this makes it a prime time for picking up the token. In the last bull market, meme coins like Dogecoin crossed the $30 billion market cap mark and a rally to a $10 billion market cap for PEPE would be a 20x return already.

Stellar (XLM) Goes The XRP Way

Stellar’s (XLM) value proposition has always been in its similarities to the XRP ecosystem and its ability to be integrated as a payments system. The blockchain offers very fast and cheap transactions compared to the likes of Ethereum, making it a prime target for those who do not want to spend too much on fees.

However, unlike XRP, the XLM price is still sitting at just $0.12 and its market cap is at a mere $3.2 billion. A return to its all-time high price of $0.9 would mean a 9x from here. But as far as bull markets go, previous all-time highs are often broken which could send XLM’s price flying.

Flow (FLOW) Joins The Altcoins List

Of the altcoins listed here, Flow is one whose price trajectory could closely resemble that of Bitcoin or Ethereum. Flow is a Layer 1 Proof of Stake blockchain which makes it a competitor for Ethereum. The blockchain already established itself as a major player when it was announced to be the blockchain powering non-fungible tokens (NFT) on Instagram in 2022.

If more large partnerships like these continue, then it is a no-brainer that FLOW crosses the $5 mark in the bull and this would be the low end of it. Nevertheless, a rise to $5 is already a 10x for investors from here, and could significantly be more.

Trust Wallet Token (TWT) Presents Unique Opportunity

With the major centralized exchange crashes that have happened over the last few years in the crypto space, self-custody has become an increasingly popular movement among crypto investors. Software wallet providers such as Trust Wallet Token (TWT) have already begun to enjoy this exodus from centralized exchanges and this is expected to continue.

The TWT token is currently still at $1.06 with a market cap of $442 million, meaning there is still a lot of room to grow. As the adoption of self-custody grows, so will demand for wallets like Trust Wallet, and with demand comes higher token prices. And the cherry on the cake is that the software wallet is owned by Binance, the largest crypto exchange in the world.

Read More
Blockchain

Expert Insights: 7 Altcoins Showing Promising Breakout Potential – A Must-Watch List

In a recent X (formerly Twitter) post, renowned crypto expert Miles Deutscher provided valuable insights into his weekly tokens and narrative watchlist, focusing on critical altcoins and upcoming events with significant trading potential. 

Altcoins Poised For Potential Breakout

Deutscher’s analysis sheds light on several altcoins, including Solana (SOL), SingularityNET (AGIX), Fetch.ai (FET), Ocean Protocol (OCEAN), Arkham (ARKM), Dogecoin (DOGE), and XRP. 

Solana:

Deutscher emphasizes the importance of Solana’s Breakpoint 2023 conference and anticipates major announcements. While previous Breakpoints have resulted in “sell the news” events, Deutscher remains cautiously short on SOL. 

On the other hand, Miles expects a positive response from the community after the recent FTX collapse. However, historical patterns suggest the possibility of a sell-off, which warrants vigilance.

Nonetheless, SOL has broken previous weekly records every week for the past month. Currently, SOL is trading at $36.27, a new record for 2023 and a level not seen since November 5, 2022. Moreover, SOL has seen significant gains of 4.4% over the past 24 hours, following its remarkable 57% rise over the past 30 days.

AGIX, FET, OCEAN:

The resurgence of the artificial intelligence (AI) narrative has sparked anticipation for a series of AI conferences, including OpenAI’s developer conference on November 6. Deutscher advises focusing on established leaders such as AGIX, FET, and OCEAN. 

These tokens have demonstrated strength during previous AI market surges. Deutscher suggests avoiding speculation on low-cap coins and opting for long positions on these altcoin AI leaders.

Over the past 30 days, AGIX has seen a remarkable 19% increase in price. However, over the past 1 year, the token has seen a staggering 350% rise amidst the AI narrative hype. It is currently trading at $0.2284. On the same note, FET has surged over 329% over the 1 year and is currently trading at $0.3665. 

OCEAN has posted smaller gains over the 1 year, but has still recorded a significant 110% surge over this period and is currently trading at $0.3645.

ARKM:

According to Deutscher, although ARKM has received less attention than other altcoins, it is promising due to its involvement in AI-related businesses and its investment by Sam Altman. 

Deutscher highlights ARKM’s potential in the AI space, especially during the Solana conferences. This makes ARKM one of the altcoins to watch closely for potential trading opportunities, according to Deutscher. 

Currently, the crypto analytics and data tracking platform’s native token is trading at $0.3833, up 20% in the last fourteen days.

XRP Speculation Intensifies Ahead Of Ripple’s ‘Swell Conference’

DOGE:

While DOGE has seen a decline in price action and hype, Deutscher highlights two key factors that could influence its performance. 

First, DOGE Day, has historically attracted retail interest. Second, the potential for a Halloween tweet from Elon Musk, as was the case last year. Deutscher suggests that DOGE is best suited for spot trading and dollar cost averaging (DCA), as it remains an attractive option for retail investors and has the potential for a strong pump in the future.

Currently, the Meme coin has lost its bullish momentum and has erased most of its gains over the past few days. Currently, the token is trading at $0.0686, down 1.9% in the past 24 hours and 42% in the 1-year time frame. 

Last but not least is XRP:

With Ripple’s “Swell Conference” scheduled for November 8-9, Deutscher acknowledges the heavy speculation surrounding a potential initial public offering (IPO), although he believes it is unlikely. 

However, given the speculative nature of the crypto market, such speculation can fuel FOMO (fear of missing out) )-driven rallies. XRP has experienced pre-conference spikes, making it a token to watch this week and next.

Currently, XRP is experiencing a sustained uptrend price action, gaining 2% in the past 24 hours, pushing the token to the 0.5949 level, which has not been seen since August.

Featured image from Shutterstock, chart from TradingView.com 

Read More
Blockchain

Ethereum Bearish Signal: MVRV Has Entered The “Danger” Zone

On-chain data shows the Ethereum Market Value to Realized Value (MVRV) ratio has entered inside a danger zone that has historically led to tops.

Ethereum MVRV Ratio Has Surged Into The Danger Zone Recently

In its latest insight post, the on-chain analytics firm Santiment has talked about some underlying metrics related to ETH. First, the firm has pointed out how the trading volume of the cryptocurrency has gone down since Ethereum’s surge from a few days back.

The trading volume observing a significant decline while the price is trying to continue its rally could indicate that momentum is weakening for the cryptocurrency.

One positive for the asset, though, could be the fact that the supply on exchanges has gone down since the rally started, implying that the investors have made net withdrawals.

Generally, investors transfer their Ethereum out of these central entities to hold onto it in self-custodial wallets for extended periods, so this decline in the supply on exchanges could be a sign of fresh accumulation.

Following the latest rise in the asset, its social dominance has also seen a jump. The “social dominance” here refers to the mindshare that Ethereum occupies on social media platforms among the top 100 cryptocurrencies by market cap.

It would appear that more eyes have been turning at Ethereum recently, which can be a sign that hype is building up among the traders. Historically, too much hype has been negative for the asset, as it has often led to top formations.

So far, though, the social dominance is still notably below the levels it was at when ETH hit its local top at the start of this month, as is apparent in the above chart. According to Santiment, this “may suggest there can be some room for it to go before things cool down.”

A signal that is more concretely bearish for Ethereum, however, is the 30-day MVRV ratio. In simple terms, what this ratio tells us is how the value that investors are holding (the market cap) compares against the capital that they invested into the asset (the realized cap).

Here, Santiment has used the 30-day MVRV ratio, which means this indicator only keeps track of the investors/addresses who bought their coins within the last 30 days.

As shown in the chart, this Ethereum indicator has recently risen into a territory that the analytics firm labels as a “danger zone.” Historically, the price has seen a correction not too long after the metric has reached this zone so another local top may be due for Ethereum right now.

ETH Price

At the time of writing, Ethereum is trading at around $1,800, up 1% in the past week.

Read More