Crypto Corner Café

Taste The Future

Blockchain

Blockchain

XRP Price Prediction: Crypto Analyst Says Price Will Jump To $0.9

XRP price predictions continue to make the rounds, and one of the latest price predictions happens to be that of prominent crypto analyst CrediBULL Crypto, who recently gave a comprehensive analysis of the token’s future trajectory

How XRP Price Could Rise To $0.9

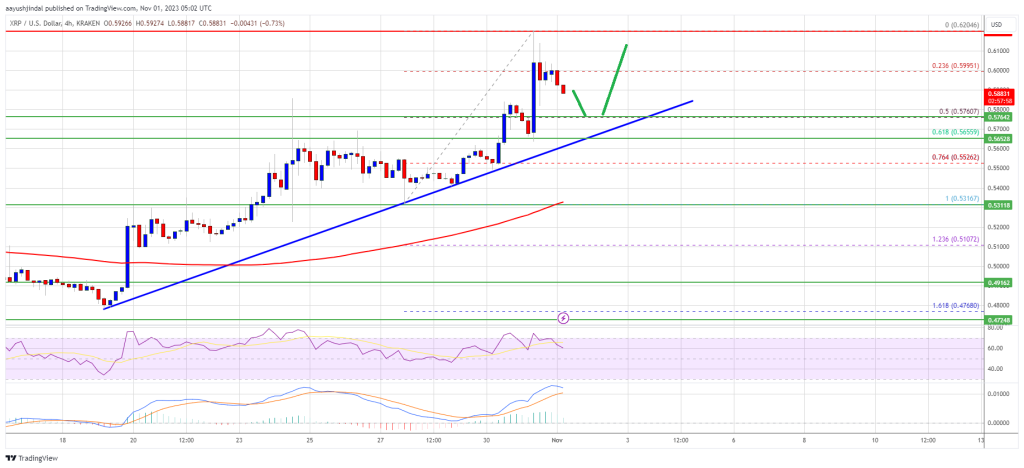
In a post shared on his X (formerly Twitter) platform, the crypto analyst highlighted that while analyzing the XRP/USD chart, the fact that XRP is currently enjoying an upward trend, but that could soon come to an end as it faces a resistance level at around the price range of $0.63. 

He was, however, quick to alleviate any fear of a potential dump as he noted that the rejection doesn’t necessarily translate to a massive dump down but could simply mean a consolidation around that price range.  

He also sounded optimistic when he stated that there is a “decent chance” that the XRP price breaks that resistance level, which, if it does, could see the token rise to as high as $0.9. He didn’t, however, provide a timeframe for when this could happen, as he mentioned that XRP holders might have to be patient. 

On the bright side, XRP’s fundamentals are looking stronger, especially with Ripple’s latest win against the SEC, with the Commission dismissing its case against the company’s founders. Ripple is also actively building to expand its services, which could see XRP’s utility increase as a result of the company’s efforts. 

What Could Hinder XRP’s Rise?

CrediBULL Crypto also mentioned the factor that was hindering a massive rally from the XRP price. According to him, the token is simply facing the same problem that other altcoins are encountering, which is a lack of liquidity in the market

He stated that this was what ultimately affected XRP’s decline in the months leading up to now, as he had predicted that XRP was going to rise above $1 following Judge Analisa Torres’ ruling in favor of Ripple in its case against the US Securities and Exchange Commission (SEC). 

Another factor that could see the XRP price decline in the short term is the projected parabolic rise of the flagship cryptocurrency, Bitcoin. While analyzing the XRP/BTC chart, CrediBULL Crypto hinted that XRP could experience as much as a 30% decline against BTC. This decline doesn’t only apply to XRP, as he expects that other altcoins will bleed against the foremost cryptocurrency.

The crypto analyst, however, does not doubt XRP’s potential, as he stated that the token would be one of the biggest benefactors once, there is an “influx of new money” in the market, which is likely to happen as Bitcoin continues to rise

Read More
Blockchain

Solana Bull Run Could Smash Through $40 Barrier This Week – Here’s How

Solana (SOL) remains on a relentless upward trajectory, defying even recent reports of the embattled crypto exchange FTX moving millions of funds in SOL and other tokens. The cryptocurrency is now hovering close to a critical resistance point at $40, showcasing remarkable resilience and determination. 

As of the latest data from CoinGecko, the current SOL price stands at $37.96, reflecting a 5% increase in the past 24 hours and a seven-day surge of 21.3%.

The journey toward $40 has been an exciting one, with SOL appreciating by approximately 80% from its intramonth low of around $21.07, a level it touched near October 12, as per CoinMarketCap figures. While SOL has demonstrated its potential, the looming question on everyone’s mind is whether it can indeed break through the $40 resistance and continue its bullish run.

Solana Bullish Momentum And Technical Indicators

Last week, there were ominous signs of a reversal when SOL dipped below the $30 mark. However, the Relative Strength Index (RSI) proved to be a strong support as it bounced off at 70, reinforcing the bullish sentiment among traders. This key technical indicator suggested that the cryptocurrency had more room to grow, encouraging traders to keep their buy positions open.

An important turning point in SOL’s chart was an accumulation drive at the $30 mark. This price level allowed bulls to build the necessary momentum for the resumption of the uptrend. The subsequent surge catapulted Solana’s price above $35, bringing it closer to the elusive $40 milestone.

The Path To $40 – Key Metrics To Watch

As Solana inches closer to the $40 resistance, several key metrics and indicators are worth monitoring to gauge the cryptocurrency’s likelihood of breaking through this crucial barrier.

Increasing trading volume often accompanies strong price movements. Traders should keep an eye on SOL’s trading volume as a surge in buying interest can indicate a potential breakout.

Sentiment analysis across social media platforms, forums, and news sources can provide valuable insights into market sentiment. Positive sentiment may fuel the bullish drive, while negative sentiment could signal potential headwinds.

The Solana ecosystem is dynamic and continuously evolving. Any significant developments, partnerships, or platform upgrades can influence SOL’s price trajectory.

Solana’s journey to $40 is characterized by a combination of technical strength, market sentiment, and ecosystem developments. While it has shown remarkable resilience, achieving this milestone will depend on a confluence of factors.

Traders and enthusiasts are eagerly watching for signs of a potential breakout, and the coming days will reveal whether SOL can maintain its bullish momentum and breach the $40 resistance.

(This site’s content should not be construed as investment advice. Investing involves risk. When you invest, your capital is subject to risk).

Featured image from Shutterstock

Read More
Blockchain

Solana (SOL) Breaks Multi-Month Trend As Firedancer Hits Testnet

The Solana price is currently experiencing a breathtaking rally. Since marking a bottom below $8 on December 29, the SOL price has risen more than 395%. And news from the Solana Breakpoint conference, which is currently being held in Amsterdam from October 30 to November 3, 2023, further fueled the price yesterday. In the last 24 hours, the price has risen 7.5%, and a whopping 23% in the last seven days.

Firedancer Launched On Solana Testnet

Central to the current excitement is the launch of Firedancer on Solana’s testnet. This new validator client, designed for the Solana blockchain, promises to significantly improve the scalability of the network, diminish latency times, and overall enhance network performance.

The brain behind Firedancer Solana is Jump Crypto, a division of the Jump Trading Group, dedicated to pioneering solutions in the blockchain space. Their vision for Firedancer is comprehensive. It is designed to refine the Solana network across all tiers, starting from its foundational consensus mechanism to its broadest performance metrics. Ultimately, Firedancer aims to scale Solana to one million transactions per second (TPS).

Highlighting the criticality of Firedancer to the future roadmap of Solana, Dan Albert, Executive Director of the Solana Foundation, proclaimed during his live stage appearance at the conference, “These guys have been hustling hard. Really did a lot of work, working around the clock in the last couple of weeks and I am really excited to announce that right now the first version of Firedancer is live on testnet.”

The first version of @jump_firedancer
Live on testnet.
Right now.

Watch @DanPaul000 share the news live on the @SolanaConf stage.

Only at #Breakpoint2023. Watch the livestream: https://t.co/51G659GtUO pic.twitter.com/llaHoiendH

— Solana (@solana) October 31, 2023

Validating this enthusiasm, Raoul Pal, CEO and co-founder of Real Vision Group and former Goldman Sachs executive, expressed his bullish outlook, stating:

Firedancer is a VERY big deal, not just for Solana but for blockchain technology overall. It is a quantum leap in speed (10x faster than the fastest blockchain today) whilst increasing security and robustness of the Solana Virtual Machine [SVM]. We’re eagerly awaiting its migration to Mainnet in the summer of 2024.

Pal further encapsulated the potential of Solana and Firedancer in a recent conversation with Scott Melker. He opined, “I’ve been observing the charts, particularly Solana versus ETH (SOL/ETH) and Solana versus Bitcoin (SOL/BTC), and it unmistakably resembles a rocket ship in its ascent. It’s truly astonishing.”

SOL Price Breaks Multi-Month Trend

However, in the midst of this euphoria, some analysts urge caution. With SOL’s price surging to touch a 1-year high of $39.88 yesterday, analyst Pentoshi offered a sobering perspective, noting, “SOL takes out these equal highs at the top of the range and in the next couple weeks likely a chance to refuel at the mid-range at $32.xx.”

In addition, the 1-day chart shows that SOL broke out of an ascending trend channel (black) in a very bullish manner. SOL rose yesterday above the late October high of $38.78, which the price marked just before it plummeted in the wake of FTX’s collapse, losing more than 68% in four days.

The next few days will be all about closing above $38.78 for the SOL bulls. If this succeeds, the Fibonacci extension level of 1.618 at $57.85 could be the next major target. Otherwise, a correction toward the 0.786 Fibonacci retracement level at $32.18 could be in the cards.

Read More
Blockchain

Galaxy Digital and Invesco Bitcoin Spot ETF Join BlackRock On The DTCC

In a recent development, another proposed Spot Bitcoin ETF has been listed on the Depository Trust and Clearing Corporation’s (DTCC) website, becoming the second proposed Spot Bitcoin ETF to appear on the corporation’s website. 

BTCO Joins IBTC On DTCC Website

The Invesco Galaxy Bitcoin ETF under the ticker ‘BTCO’ recently appeared on the DTCC website, joining BlackRock’s spot Bitcoin ETF, which goes under the ticker ‘IBTC’ as uncertainty around a possible approval of these funds continues to heighten. 

Many had speculated an approval was imminent when BlackRock’s IBTC was earlier listed. However, the optimism has sort of cooled off following a recent revelation by a spokesperson for the financial services company. The representative clarified that the listing of these ETFs was simply “Standard Practice” and that it doesn’t indicate any potential approval by the SEC. 

An ETF expert had also weighed in and stated that DTCC’s listing didn’t mean anything in the grand scheme of things regarding a possible approval of Bitcoin ETFs by the United States Securities and Exchange Commission (SEC). Going by this, the DTCC listing only suggests that these asset managers are preparing just in case they get approved by the SEC

Such preparations also include asset managers BlackRock and VanEck recently revealing their plans to begin seeding for their respective funds. While such a move doesn’t guarantee that the SEC is likely to approve these funds anytime soon, it, however, shows the optimism of these firms that their Spot Bitcoin ETF will launch sooner or later. 

Valkyrie Joins The Spot Bitcoin ETF Amendment Train

In a post shared on his X (formerly Twitter) platform, Bloomberg analyst James Seyffart noted that the asset management firm Valkyrie had joined the “prospectus amendment train” with the latest filing of their revised Spot Bitcoin ETF prospectus. Valkyrie joins the likes of ARK Invest, BlackRock, Fidelity, and Bitwise, who have also filed amendments to their prospectus. 

Seyffart happens to be one of those who believe that these amendments could mean something. ARK Invest was the first asset manager to amend its prospectus, which led Seyffart and fellow Bloomberg analyst Eric Balchunas to predict that the US Securities and Exchange Commission (SEC) could approve a fund as early as next year.

Meanwhile, it is worth mentioning that the SEC has so far not said anything regarding Grayscale’s application despite the Commission opting not to file an appeal. But that could change soon as ETF enthusiast and prominent financial lawyer Scott Johnsson said that the Commission is set to have a closed meeting on November 2; its first since the Grayscale deadline expired, and one of the agenda for the meeting includes resolving litigation claims. 

Read More
Blockchain

XRP Whale Transactions Spike To 3-Month High As Smart Money Buys

XRP has witnessed a remarkable surge of over 29% in its value over the last 12 days. The price has risen from $0.4771 to a two and a half month high of $0.6209 yesterday.

Sharks And Whales Make A Splash

This impressive price hike coincides with an increase in whale transactions as well as the number of wallets holding more than 10,000 XRP (worth approx. $5,930), indicating heightened interest from retail investors as well as large investors, commonly referred to as “whales” in the crypto community.

On-chain analytic firm Santiment shared via X (formerly known as Twitter), “XRP revisited a $0.60 market value for the first time since its tumble back on August 16th. Along this road back, we have seen whales get gradually more involved. Additionally, there are now an alltime high 277.62K wallets holding at least 10,000 XRP.”

Santiment presented the below chart and stated that the ledger has shown a noticeable increase in the number of wallets holding 10,000 coins or more, with the current number exceeding 277.6K. Moreover, there has been a significant uptick in the volume of whale transactions, with those exceeding $1 million in value spiking to a 3-month high. To be precise, October 31, 2023, saw a total of 255 such high-value transactions.

The data by Santiment provides a clear visual representation of the increasing trend in XRP’s price, which is further underscored by the corresponding rise in large transactions and whale wallet count. With an evident increase in the activity of both ‘sharks’ and ‘whales’, the market seems to be attracting significant attention from big players.

Remarkably, the most popular whale tracker on X has reported quite a few whale transactions in the last 24 hours. First of all, as usual for the 1st of the month, Ripple has released 1 billion XRP from the escrow account. Whale Alert reported 3 transactions of 500 million, 400 million and 100 million XRP.

In addition, there were also other interesting transactions. Thus, Ripple transferred 50 million XRP (about $29.87 million) to an unknown wallet. 24.9 million tokens (about $14.9 million) were transferred from an unknown wallet to Bitstamp. Moreover, 30 million XRP (about $17.2 million) were transferred from Bybit to an unknown wallet.

Smart Money Is Buying XRP

Analyst Jaydee has turned his focus to the XRP/BTC chart, suggesting that discerning investors find more than just price ticks and candlesticks. He noted, “I’m paying more attention to the XRP/BTC chart. Smart money is respecting the multi-year trendline.”

The multi-year trendline in the 1-week chart, accentuated by four touchpoints, has acted as a crucial support for the altcoin when paired against BTC. Every touch on this line has resulted in a significant price surge, emphasizing its role as a robust line of defense against bearish pressures.

The chart further showcases dramatic price increases. At one point, a bullish rally catapulted the price by a staggering 415%. This wasn’t an isolated incident. Subsequent surges of 230%, 101%, and 60% followed, painting a picture of resilience and bullish momentum for the cryptocurrency against its Bitcoin counterpart.

Yesterday, Jaydee drew attention to the recent bounce on the chart. He elaborated, “Look at that bounce on XRP/BTC chart! Looks like SMART MONEY are buying now while DUMB MONEY were buying the lawsuit narratives.”

At press time, XRP traded at $0.5983.

Read More
Blockchain

THORChain Beats Rivals In Top 100 Coin Rankings With 34% Rally – How RUNE Did It

Over the past week, the market has exhibited a pattern of lateral movement, particularly noticeable in the top cryptocurrencies which have shown a downtrend in their pricing. Notably, THORChain has emerged as the standout performer, demonstrating significant strength by surging over 5% in value within the last day, and an impressive 34% increase over the course of the week.

RUNE Soars Over 270%: A Thrilling Journey Of Value Surge

Recently, the RUNE token on THORChain has seen a tremendous ascent. It started off on a fantastic trajectory, rising from a low of just under $0.80 on June 14 to a solid high of $2.90 today—a phenomenal 270% gain.

A reversal from a descending triangle, which gained significant traction around August 15, was the catalyst for this advance. Despite some ups and downs coming up to October 20th, the token managed to gain another 80%.

This surge in value stands as a testament to the robustness of THORChain’s RUNE token, buoyed not only by the impressive price momentum but also by an evident surge in trading volume. RUNE has advanced from its lowest level this year, making the token among the top-performing cryptocurrencies in the world.

THORChain: Impending Breakout And The $10 Target

This increased trading activity not only substantiates the upward trend but also underscores a burgeoning confidence among buyers, emphasizing a collective belief in driving the coin towards even greater heights.

Captain Faibik, a well-known analyst in the cryptocurrency space with an impressive following of almost 68,000 on the X platform, recently made an observation that caught our attention: there may be an impending breakout in the price of RUNE, indicating the possibility of substantial movement in the near future.

$RUNE is approaching Major Trendline and Horizontal Resistance.

If it Successfully Breaks out, we might Expect a Significant Bullish Rally in the Midterm.#Crypto #RUNE #RUNEUSDT pic.twitter.com/efZR6e0rcM

— Captain Faibik (@CryptoFaibik) October 31, 2023

Based on the analyst’s possible breakout scenario, a big bullish upswing could happen if the RUNE price breaks through its current horizontal support level. The possible rise in price of THORChain could push it toward a major milestone, with a goal of reaching $10 during the rush.

RUNE: Breaking Resistance And The $3 Billion Milestone

Breaking through this resistance level is a key turning point that could cause prices to rise by a huge amount, indicating a bullish trend that could push THORChain’s price close to a major threshold.

The achievement of $3 billion in on-chain trade volume on major decentralized exchanges (DEXs) is one noteworthy milestone that is contributing to the price increase, along with several other basic variables.

This significant growth raises questions about the rally’s sustainability. Could the price go through $3 and rise even farther, or is it already at its breaking point?

Congrats @THORChain

October is officially the first $3b on chain trading volume & it entered the top 5 DEX list

Streaming swaps was the catalyst needed for adoption

Here’s a few observations pic.twitter.com/WGCOLNVLgD

— TCB (@THORmaximalist) October 30, 2023

Meanwhile, the network processed over $3 billion in on-chain transactions this month, setting new records. This holds significance due to the network’s substantial volume of $2.3 billion only in the third quarter.

During this period, it generated a total of $3.38 million in fees. This indicates that THORChain is experiencing an increasing level of popularity and adoption among its user base.

(This site’s content should not be construed as investment advice. Investing involves risk. When you invest, your capital is subject to risk).

Featured image from Shutterstock

Read More
Blockchain

XRP Price Prediction – A Strengthening Case For Rally Above $0.62

XRP price is correcting gains from the $0.620 resistance against the US Dollar. The price might test the $0.5760 support, where the bulls could take a stand.

XRP started a strong increase above the $0.580 resistance.
The price is now trading above $0.585 and the 100 simple moving average (4 hours).
There is a major bullish trend line forming with support near $0.5760 on the 4-hour chart of the XRP/USD pair (data source from Kraken).
The pair might correct further lower, but the bulls could remain active near $0.5760.

XRP Price Remains In Uptrend

After forming a base above the $0.532 level, XRP started a fresh rally. There was a strong move above the $0.555 and $0.565 resistance levels. It even outperformed Bitcoin and Ethereum.

A high was formed near $0.6204 and the price is now correcting gains. There was a decline below the $0.600 level. The price even moved below the 23.6% Fib retracement level of the upward move from the $0.5316 swing low to the $0.6204 high.

XRP is now trading above $0.585 and the 100 simple moving average (4 hours). There is also a major bullish trend line forming with support near $0.5760 on the 4-hour chart.

Source: XRPUSD on TradingView.com

On the upside, immediate resistance is near the $0.5950 level. The first major resistance is $0.600. A close above the $0.600 level could send the price toward the $0.620 resistance. If the bulls remain in action above the $0.620 resistance level, there could be a rally toward the $0.650 resistance. Any more gains might send XRP toward the $0.665 resistance.

Are Dips Supported?

If XRP fails to clear the $0.600 resistance zone, it could continue to move down. Initial support on the downside is near the $0.576 zone and the trend line.

The trend line is near the 50% Fib retracement level of the upward move from the $0.5316 swing low to the $0.6204 high. The next major support is at $0.5650. If there is a downside break and a close below the $0.5650 level, XRP price might accelerate lower. In the stated case, the price could retest the $0.532 support zone.

Technical Indicators

4-Hours MACD – The MACD for XRP/USD is now losing pace in the bullish zone.

4-Hours RSI (Relative Strength Index) – The RSI for XRP/USD is now above the 50 level.

Major Support Levels – $0.576, $0.565, and $0.532.

Major Resistance Levels – $0.600, $0.620, and $0.650.

Read More
Blockchain

Cardano Experiences Decline In Q3 Network Activity – Unraveling The Root Cause

Cardano, one of the prominent blockchain networks, experienced a mixed bag of performance during the third quarter of the year, leaving investors and enthusiasts intrigued about its future trajectory. While certain metrics presented a less-than-stellar picture, there are emerging indicators that suggest the potential for a positive turnaround. 

In this article, we look into Cardano’s Q3 performance, examining stagnant metrics, the impact they have had, and the potential price direction that could shape its future.

The Impact Of Stagnant Metrics

In the realm of cryptocurrencies, metrics play a crucial role in determining the health and vitality of a blockchain network. Cardano’s performance in Q3, as shown in Messari’s analysis, revealed some concerning trends, albeit not entirely bleak. The average transaction fee on the Cardano network, denominated in US dollars, saw a 29.9% decrease, dropping from $0.13 to $0.10, suggesting a reduction in the cost of network usage.

One of the more significant concerns was the decline in daily active addresses. Between July and September, the average count of daily active addresses plummeted by 29%, from the 58,000 recorded during the year’s second quarter to 41,137. This decline raises questions about the network’s ability to maintain user engagement and activity levels.

Fees denominated in Cardano’s native token, ADA, also fell by 3% quarter-over-quarter (QoQ), indicating that users may have been transacting with smaller amounts of ADA due to lower fees. Furthermore, the network’s revenue took a hit, falling by a substantial 30%, which could raise concerns about its overall financial stability.

Cardano’s Chart Signals Optimism

Amidst the stagnant metrics and challenges faced in Q3, Cardano’s chart on TradingView paints a different narrative, hinting at the potential for an upward momentum. The Relative Strength Index (RSI) for Cardano is on an upward trajectory, approaching the overbought territory. While this might typically be seen as a signal for a potential pullback, it should be considered in the context of Cardano’s recent price performance and external factors.

The moving averages on the chart provide further cause for optimism. After a period of sideways movement, the price appears to be making an effort to break above the long-term resistance trendline. This, combined with the formation of higher lows on the chart, creates a potentially bullish scenario, suggesting that Cardano may be gearing up for a significant price move.

Potential Price Direction

As of the most recent data from CoinGecko, Cardano (ADA) is trading at $0.290817. In the last 24 hours, the price experienced a dip of 3.8%, while over the past seven days, it saw a 2.8% rise. These short-term price movements indicate a level of volatility and uncertainty in the market.

Cardano’s performance in Q3 had its fair share of challenges, with stagnant metrics and declining user engagement. However, the positive signals on the trading chart and the potential for an upward momentum suggest that Cardano may be poised for a price breakout. 

(This site’s content should not be construed as investment advice. Investing involves risk. When you invest, your capital is subject to risk).

Featured image from Shutterstock

Read More
Blockchain

Ethereum Price is About to See “Liftoff” if It’s Able to Hold One Crucial Level

Ethereum price is still struggling to clear the $1,850 resistance against the US dollar. ETH might rally again if it clears $1,820 and $1,850.

Ethereum is still facing a key barrier near the $1,850 zone.
The price is trading above $1,785 and the 100-hourly Simple Moving Average.
There is a major rising channel forming with support near $1,800 on the hourly chart of ETH/USD (data feed via Kraken).
The pair could extend its increase if it clears the $1,820 resistance.

Ethereum Price Remains Supported

Ethereum started a slow and steady increase from the $1,740 zone. ETH was able to reclaim the $1,800 resistance zone and avoided a major downside correction, like Bitcoin.

The bulls even pushed the price above the 50% Fib retracement level of the downside correction from the $1,865 swing high to the $1,740 low. Moreover, there is a major rising channel forming with support near $1,800 on the hourly chart of ETH/USD.

Ethereum is now trading above $1,785 and the 100-hourly Simple Moving Average. On the upside, the price is facing resistance near the $1,820 level. It is close to the 61.8% Fib retracement level of the downside correction from the $1,865 swing high to the $1,740 low.

If ETH surpasses the $1,820 resistance, it could rise toward the key barrier at $1,850. A close above the $1,850 resistance could start a fresh rally. In the stated case, the price could rally toward $1,950.

Source: ETHUSD on TradingView.com

The next key resistance is near $2,000, above which the price could accelerate higher. In the stated case, the price could rise toward the $2,120 level. The main hurdle sits at $2,250.

Bearish Wave in ETH?

If Ethereum fails to clear the $1,820 resistance, it could start another decline. Initial support on the downside is near the $1,800 level, the 100-hourly Simple Moving Average, and the trend line.

The next key support is $1,770. The main support is now forming near the $1,750 and $1,740 levels. A downside break below the $1,740 support might spark a bearish wave. In the stated case, Ether could drop toward the $1,650 level.

Technical Indicators

Hourly MACDThe MACD for ETH/USD is losing momentum in the bullish zone.

Hourly RSIThe RSI for ETH/USD is now above the 50 level.

Major Support Level – $1,740

Major Resistance Level – $1,820

Read More
Blockchain

Solana Flying, Bulls Reverse Post-FTX Collapse Losses But SOL Analysts Cautious

SOL, the primary currency of Solana, is one of the top-performing coins in the top 10, according to CoinMarketCap, a crypto tracker. According to data on October 31, SOL is changing hands above $36, trending at 2023 highs, reversing all post-FTX collapse, which saw the coin tumble to as low as $8 in Q4 2023 before recovering steadily over the past 11 months to spot rates.

Solana Flies 150% To Reverse Post-FTX Losses

At present prices, SOL is up more than 150% from November 2022 lows. At this pace, SOL is outpacing Bitcoin (BTC) and Ethereum (ETH), whose prices have also rallied by over 100% from 2022 lows. 

Looking at the daily chart, SOL is within a bullish breakout formation, trending above the July 2023 high of around $32. Notably, the leg up is with rising trading volume, suggesting that optimistic traders possibly support the uptrend. 

Besides expanding trading volume, bull bars are riding the upper Bollinger Bands (BB), diverging from the middle BB, indicating that the uptrend momentum is also high and may support prices. BB is a technical indicator for measuring price volatility. Whenever either band diverges from the middle BB, the underlying volatility is high, as with Solana at spot rates.

The bankruptcy of FTX triggered the SOL plunge in November 2022. The exchange was one of the most popular before collapsing after it emerged that its founder, Sam Bankman-Fried, had misappropriated user funds. 

Bankruptcy Trustee Free To Sell SOL, Why Did They Stake?

FTX, through its subsidiaries, was one of the largest holders of SOL. Therefore, when FTX filed for bankruptcy protection at the United States Bankruptcy Court for the Southern District of New York in early November 2022, it had a ripple effect on the broader Solana ecosystem, forcing SOL prices lower. 

FTX holds roughly 16% of the SOL outstanding supply worth over $1 billion and over $500 million BTC. According to a ruling by the Bankruptcy Court for the District of Delaware in September, FTX can begin selling and investing its crypto holdings to repay creditors.

In mid-October, the FTX estate staked 5.5 million SOL. According to on-chain data, coins were staked via Figment, a platform leveraged mainly by institutional investors. 

By staking SOL, the FTX estate, which a bankruptcy trustee manages, is bullish on the coin since it has the option, as directed by the court, to liquidate it at any time. Moreover, by staking, the estate will receive more SOL. 

Even so, Nansen’s report on October 31 shows that the FTX estate unstaked 1.6 million SOL. It remains unclear if they will be sent to exchanges for liquidation, potentially lowering prices.

Read More