Crypto Corner Café

Taste The Future

Blockchain

Blockchain

ADA Price Prediction – 10% Surge In Two Days, Bulls Aim For $0.35

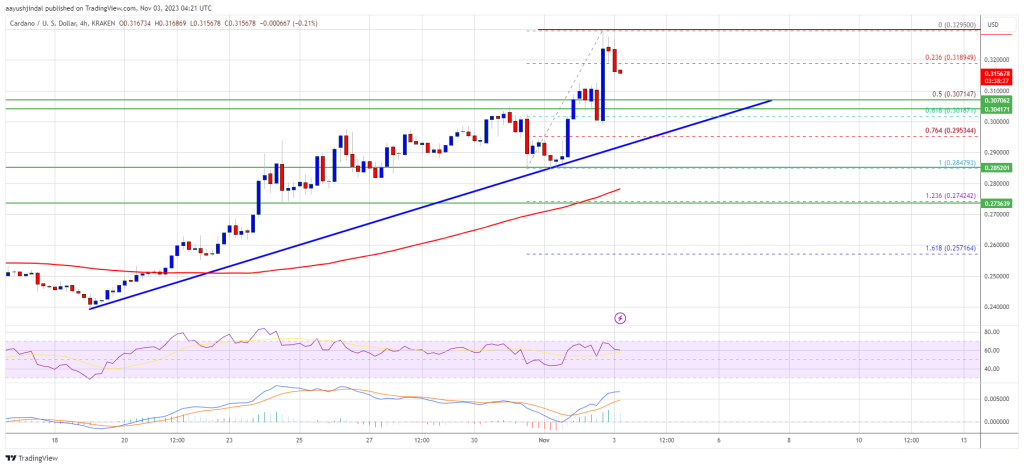
Cardano (ADA) started a fresh increase above the $0.30 resistance. ADA is outperforming Bitcoin and might aim for a move toward the $0.35 resistance.

ADA price regained strength for a move above the $0.265 and $0.280 levels against the US dollar.
The price is trading above $0.30 and the 100 simple moving average (4 hours).
There is a key bullish trend line forming with support near $0.3050 on the 4-hour chart of the ADA/USD pair (data source from Kraken).
The pair must stay above the $0.308 support to start a fresh increase in the near term.

Cardano Price Regains Strength

After a couple of swing moves, Cardano was able to gain strength for a move above the $0.28 resistance. It rallied above the $0.30 resistance to move further into a positive zone. It is up over 10% in two days, outperforming Bitcoin and Ethereum.

A new multi-week high is formed near $0.3295 and the price is now consolidating gains. There was a minor correction below the 23.6% Fib retracement level of the upward move from the $0.2847 swing low to the $0.3295 high.

ADA is now trading above $0.30 and the 100 simple moving average (4 hours). There is also a key bullish trend line forming with support near $0.3050 on the 4-hour chart of the ADA/USD pair. The trend line is close to the 50% Fib retracement level of the upward move from the $0.2847 swing low to the $0.3295 high.

Source: ADAUSD on TradingView.com

On the upside, immediate resistance is near the $0.3280 zone. The first resistance is near $0.332. The next key resistance might be $0.350. If there is a close above the $0.350 resistance, the price could extend its rally. In the stated case, the price could rise toward the $0.385 resistance zone.

Are Dips Supported in ADA?

If Cardano’s price fails to climb above the $0.328 resistance level, it could continue to move down. Immediate support on the downside is near the $0.310 level.

The next major support is near the $0.308 level and the trend line. A downside break below the $0.308 level could open the doors for a sharp fresh decline toward $0.285. The next major support is near the $0.274 level.

Technical Indicators

4 hours MACD – The MACD for ADA/USD is losing momentum in the bullish zone.

4 hours RSI (Relative Strength Index) – The RSI for ADA/USD is now above the 50 level.

Major Support Levels – $0.310, $0.308, and $0.285.

Major Resistance Levels – $0.328, $0.332, and $0.350.

Read More
Blockchain

Ethereum Price Breaking This Confluence Resistance Could Spark Fresh Surge

Ethereum price corrected lower from the $1,875 zone against the US dollar. ETH retested the $1,780 zone and might soon attempt a fresh surge.

Ethereum holds the key support at $1,780 and $1,750.
The price is trading below $1,820 and the 100-hourly Simple Moving Average.
There was a break above a steep bearish trend line with resistance near $1,795 on the hourly chart of ETH/USD (data feed via Kraken).
The pair could start a fresh increase toward the $1,850 and $1,875 resistance levels.

Ethereum Price Revisits Uptrend Support

Ethereum attempted a fresh increase above the $1,850 resistance but upsides were limited, like Bitcoin. ETH traded as high as $1,874 and recently started a downside correction.

There was a move below the $1,850 and $1,820 levels. The price even spiked below the $1,800 level and the 100-hourly Simple Moving Average. It retested the $1,780 support zone. A low is formed near $1,777 and the price is now attempting another increase.

There was a break above a steep bearish trend line with resistance near $1,795 on the hourly chart of ETH/USD. Ethereum is now trading near the 23.6% Fib retracement level of the recent drop from the $1,874 swing high to the $1,777 low.

On the upside, the price is facing resistance near the $1,810 level and the 100-hourly Simple Moving Average. The first major resistance sits at $1,825 or the 50% Fib retracement level of the recent drop from the $1,874 swing high to the $1,777 low.

Source: ETHUSD on TradingView.com

If ETH surpasses the $1,825 resistance, it could again start a steady increase and test $1,875. The next key resistance is near $1,920, above which the price could accelerate higher toward the $2,0000 level. Any more gains might call for a move toward the $2,050 level.

More Losses in ETH?

If Ethereum fails to clear the $1,825 resistance, it could continue to move down. Initial support on the downside is near the $1,780 level or the recent low.

The next key support is $1,750. A downside break below the $1,750 support might spark a bearish wave. In the stated case, Ether could drop toward the $1,650 level.

Technical Indicators

Hourly MACDThe MACD for ETH/USD is losing momentum in the bearish zone.

Hourly RSIThe RSI for ETH/USD is now below the 50 level.

Major Support Level – $1,780

Major Resistance Level – $1,825

Read More
Blockchain

Is Celestia (TIA) Crashing Because Of Large-Scale Dumping By Manipulators?

Celestia, the modular blockchain that claims to be scalable without sacrificing security, launched in late October 2023 after weeks of anticipation from the broader crypto community. However, hours after launching and TIA listing on multiple exchanges, including OKX and KuCoin, the coin is struggling to match the initial enthusiasm. 

TIA Is Dropping, Blame The Celestia Airdrop?

The coin is down 20% from recent highs and risks plunging some more. Reportedly, some airdrop recipients, chiefly Sybil groups, are liquidating the coin via mainstream exchanges. This is heaping more pressure on bulls.

These recipients, according to Celestia, were early adopters of the project. In total, the platform allocated 60 million TIA for the airdrop, representing 6% of the total supply. 

Usually, crypto projects distribute free tokens in an airdrop as a strategy to raise awareness. To receive tokens, interested users must provide their wallet addresses and actively participate as a developer or a platform user. In Celestia’s case, for example, the network distributed TIA, to among others, developers.

Related Reading: Solana Whales Deposit To Exchanges, Selloff Incoming?

In total, 191,391 addresses are set to receive TIA from the airdrop. However, according to a recent report, at least 20% of these addresses are controlled by Sybil groups. By November 1, 138,981 addresses, representing 72% of all accounts, had already claimed roughly 44 million TIA out of the 60 million set aside for the airdrop. 

Sybil Group Operators Reaping Big, Dumping TIA

That Sybil groups manipulated their way and received TIA could, according to researchers, suppress prices going forward. Technically, a Sybil group of malicious actors who create multiple fake identities aiming to take control of a given network, in this case, Celestia, or even destabilize the airdrop. Through the numerous fake identities created to receive the TIA airdrop, researchers discovered that Sybil group operators deposited to a single address before moving them to a crypto exchange. 

The report notes that large-scale Sybil groups, which operate over 20 deposit addresses, received 5.22 million TIA. Meanwhile, large Sybil groups operating between five to 20 addresses ended up with 6.65 million TIA. At the same time, 51,494 addresses were suspected to be part of the Sybil group ring that received 17.05 million TIA.

Out of this, researchers discovered that one profitable Sybil group, operating 300 airdrop addresses, received 77,391 TIA. Coins deposited to the 300 airdrop addresses were consolidated to one address and sent to OKX. Surprisingly, each of the 300 addresses ended up with 258 TIA, meaning Celestia didn’t notice they were associated and possibly operated by one entity.

Read More
Blockchain

Bitcoin Price Reaches Key Juncture, Is This Bulls Trap or Technical Correction?

Bitcoin price failed to continue higher above $36,000. BTC corrected gains and might find strong buying interest near the $34,200 support zone.

Bitcoin corrected gains from the $36,000 resistance zone.
The price is trading near $34,700 and the 100 hourly Simple moving average.
There is a major bullish trend line forming with support near $34,300 on the hourly chart of the BTC/USD pair (data feed from Kraken).
The pair must stay above the $34,000 support to start a fresh increase in the near term.

Bitcoin Price Holds Support

Bitcoin price attempted another rally above the $35,000 resistance. BTC cleared the $35,500 level but struggled near the $36,000 level. There was no test of the $36,200 resistance zone and the price started a downside correction.

There was a move below the $35,500 and $35,000 levels. The price even spiked below the $34,500 level and the 100 hourly Simple moving average. A low is formed near $34,350 and the price is now consolidating losses near the 23.6% Fib retracement level of the recent decline from the $35,945 swing high to the $34,350 low.

Bitcoin also trades near $34,700 and the 100 hourly Simple moving average. Besides, there is a major bullish trend line forming with support near $34,300 on the hourly chart of the BTC/USD pair.

On the upside, immediate resistance is near the $35,750 level. The next key resistance could be near $35,150 or the 50% Fib retracement level of the recent decline from the $35,945 swing high to the $34,350 low. A clear move above the $35,150 resistance might open the doors for a move toward the $36,000 resistance.

Source: BTCUSD on TradingView.com

The next key resistance could be $36,200, above which the price could rise toward $37,000. Any more gains might send BTC toward the $37,500 level.

More Losses In BTC?

If Bitcoin fails to rise above the $35,150 resistance zone, it could continue to move down. Immediate support on the downside is near the $34,350 low and the trend line.

The next major support is near the $35,000 zone. If there is a move below $34,000, there is a risk of more downsides. In the stated case, the price could drop toward the $33,200 level in the near term.

Technical indicators:

Hourly MACD – The MACD is now losing pace in the bearish zone.

Hourly RSI (Relative Strength Index) – The RSI for BTC/USD is now below the 50 level.

Major Support Levels – $34,300, followed by $34,000.

Major Resistance Levels – $34,750, $35,150, and $36,000.

Read More
Blockchain

Polygon’s NFT Sales Skyrocket By 131% To $20 Million In Q3 2023

Polygon (MATIC), a  Layer 2 (L2) blockchain network, experienced remarkable growth in the third quarter of 2023. According to a report by Messari, the platform witnessed a significant increase in non-fungible token (NFT) sales, successful network upgrades, and the activation of a new token. 

Polygon NFT Sales Skyrocket

Per the report, in Q3 2023, Polygon witnessed a staggering 131% quarter-on-quarter increase in weekly NFT sales volume, reaching an impressive $20 million. This growth was primarily attributed to the success of DraftKings’ Reignmaker NFT collection, which became the top collection on the network. 

The collection featured officially licensed cards from renowned sports organizations like the National Football League Players Association (NFLPA), Professional Golfers’ Association of America (PGA TOUR), and Ultimate Fighting Championship (UFC). Furthermore, through Q3, Polygon achieved significant milestones in terms of technological advancements. 

Moreover, Polygon activated the POL token on its mainnet during Q3 2023. POL serves as an upgrade to the existing MATIC token and offers holders the opportunity to contribute to network security across various chains within the Polygon ecosystem through a native re-staking protocol. 

The token features an inflationary model with an annual issuance rate that is subject to community governance, which, according to the report, enhances the overall security and decentralization of the platform.

Daily Active Addresses Surge Fueled By DeFi Dominance

During Q3, Polygon experienced a 1.4% quarter-on-quarter growth in daily active addresses, reaching an impressive 364,000. The decentralized finance (DeFi) sector accounted for the majority of the active addresses on the network, showcasing the platform’s strength and popularity within the decentralized finance space.

What’s more, Polygon Labs unveiled Polygon 2.0, a comprehensive upgrade roadmap aiming to unify all Polygon protocols and blockchains using ZK technology. This initiative seeks to establish Polygon as the “Value Layer of the Internet” and introduces significant updates to protocol architecture, tokenomics, and governance. 

One of the key upgrades includes transitioning the network to a zkEVM Validium network, ensuring enhanced security while sharing the same level of robustness as Ethereum (ETH).

Furthermore, according to Token Terminal data, Polygon has shown positive momentum in price performance, network fees, and circulating market cap.

The network’s native token, MATIC, has experienced an increase of 3.95% over the past 24 hours, trading at $0.6556, reflecting positive sentiment among investors. 

Over the past 30 days, the coin has experienced a notable increase of 13.01%, signaling a potential recovery from previous market downturns.

However, the six-month data shows a decrease of 34.97%, indicating the impact of market volatility on the long-term value of the token.

Polygon’s circulating market cap currently stands at $6.00 billion, exhibiting a 15.36% increase. However, the fully diluted market cap of $6.49 billion, which considers the total supply of tokens, has grown by 12.79%. 

The network’s fees over the past 30 days amounted to $1.21 million, representing a slight decline of 8.57%. However, on an annualized basis, the fees reached $14.68 million, indicating a downward trend of 20.24%. 

Featured image from Shutterstock, chart from TradingView.com 

Read More
Blockchain

Founder Thinks The Ethereum Chart Is “Gorgeous”: Is It True?

Raoul Pal, the CEO and founder of Real Vision, thinks the Ethereum chart is “gorgeous” and expects the coin to increase in the months ahead. Though it is unclear when the coin will break from the current consolidation and extend gains of the recent few weeks, the endorsement from the founder can be bullish for the coin.

Ethereum Is Bullish, What’s Next?

Presently, ETH is changing hands at around $1,800 but remains below the psychological $2,000 level and July 2023 highs of approximately $2,100. The failure of ETH to break above immediate resistance lines can be a concern, considering the exemplary performance of Bitcoin (BTC) in the past few weeks.

At press time, BTC is trading near 2023 highs after easing past July 2023 highs in late October 2023. The surge of Bitcoin prices shifted sentiment, forcing capital back into crypto, which had been relatively restive, reeling from the brutal effects of last year’s crypto winter, which spilled to 2023.

Looking at the performance in the daily chart, ETH is up about 20% from October 2023 lows. Technically, the path of least resistance appears northwards, syncing with the general crypto trend whose trajectory seems reliant on Bitcoin. 

As it is, the immediate resistance is around the $2,000 and $2,100 zone. If bulls build on the current momentum as Pal expects, breaking from the consolidation, ETH could surge to March 2022 highs of around $3,500. However, the leg up from spot rates largely depends on the strength of the breakout, a metric gauged by the trading volume. 

A high volume breakout, similar to the one recorded in the BTCUSDT when it broke above $32,000, may easily anchor optimistic buyers angling for a near 100% rally in the coming sessions.

Ethereum Futures ETFs Are Live, But SEC Is Mum On ETH’s Status

Though Pal is bullish, the founder didn’t specify the exact trigger that may lift the second most valuable coin to new levels, justifying why the ETHUSDT chart at the spot level is “gorgeous.” Still, the community is overly bullish because the United States Securities and Exchange Commission (SEC) recently approved the first Ethereum Futures Exchange-Traded Fund (ETF).

These products provide a new and regulated way for investors to gain exposure to ETH. Over time, this may attract institutional investors, which may drive prices higher. 

Though the SEC has yet to publicly declare ETH is a commodity like Bitcoin, their approval of Ethereum Futures ETFs as the community awaits the eventual authorization of the first spot Bitcoin ETF suggests that the regulator could be comfortable with ETH.

Read More
Blockchain

Bitcoin Cash Rally Threatened As Exchange Drops BCH Following XRP Listing Rumors

Bitcoin Cash has followed the general growth trend of Bitcoin with the price almost clearing the $250 resistance before being rejected. Even though BCH maintains this bullish momentum, it is not completely in the clear following its delisting from one crypto exchange.

EDX Markets Delists Bitcoin Cash

In another unexpected blow, Bitcoin Cash (BCH) has been delisted from the EDX Markets crypto exchange. Users had first suspected that the exchange was ending support for BCH and rumors spread like wildfire through social media. Eventually, the crypto exchange will confirm these rumors, with a spokesperson revealing that EDX Markets was indeed no longer offering support for BCH.

Contrary to the norm, EDX Markets did not give any indication of why the cryptocurrency was delisted from the exchange. Rather, users were directed to sign up for the newsletter to get updates about listings, as well as check out the website for supported coins.

Interestingly, this is happening at a time when rumors have been circulating that EDX Markets might be planning to list XRP. This would make sense given that many exchanges have resisted the cryptocurrency after Ripple’s victory over the SEC. Since then, XRP’s volume has been on the high side and crypto exchanges have clamored for a chance to get a piece of the pie.

BCH Price Struggles To HoldOn

Following the rejection from the $250 level, the Bitcoin Cash (BCH) price has been hard-pressed to continue on its previous trajectory. The fall toward the $240 level shook out a good portion of longs before the bulls were able to take over once more.

However, the BCH daily trading volume is still seeing good momentum after rising 36% in one day. If anything, this shows there is still a fair amount of interest in the altcoin with trading garnering a lot of attention from market participants.

The major resistance to a BCH breakout currently lies at the $250 level. If the price is able to clear this resistance, then the rally is expected to continue and could touch $270 before losing steam. But it is still a long way from its yearly high of $300.

At the time of writing, BCH is trading at $243 with 3.75% losses on the weekly chart. However, it is performing much better in the last day after rising 2.23%.

Read More
Blockchain

Ethereum Yet To Shake Off 2022 Bear Hangover: Glassnode

Data from Glassnode shows Ethereum is still experiencing negative momentum despite the year-to-date rise that the asset has observed.

Ethereum MVRV Ratio Has Recently Indicated Negative Momentum

According to the latest weekly report from Glassnode, the MVRV ratio has recently been below its 180-day moving average (MA). The “Market Value to Realized Value (MVRV) ratio” refers to an indicator that measures the ratio between the Ethereum market cap and realized cap.

The “realized cap” here is a capitalization model for ETH that assumes the true value of any coin in circulation is the price at which it was last moved on the blockchain. This is unlike the market cap, of course, which calculates the asset’s total value using the current spot price.

Since the price at which each coin was last moved on the network can be assumed to be the price it was bought, the realized cap can be looked at as a sum of the total capital that the investors have used to purchase ETH.

As the MVRV ratio compares the value that the holders are carrying right now (the market cap) against the amount that they have invested into the cryptocurrency, it can provide us with information about their profit/loss status.

Now, here is a chart that shows the trend in the Ethereum MVRV ratio, as well as its 180-day MA, over the last few years:

When the MVRV ratio is above the 1 mark, it means that the average investor is sitting on some profits right now, while it being below the level implies the dominance of loss in the market.

From the graph, it’s visible that the Ethereum MVRV ratio observed some rise as the rally started at the start of this year. During this period, the indicator remained above its 180-day MA.

“Periods, where the MVRV Ratio trades above this long-term mean, indicate investor profitability is increasingly meaningful, and is often a signal of a rising market,” explains Glassnode.

In the last few months, though, as the Ethereum price has found some struggle, the metric has gone under its 180-day MA. The analytics firm notes, “despite the positive market performance for ETH YTD, by this metric the market is still experiencing negative momentum.”

As is apparent from the chart, the Ethereum MVRV ratio has very recently just started to break above this mark, following the rally towards the $1,800 level. It’s still very early in the breakout, though, so it’s unclear if it will actually sustain there.

“It seems that the hangover from the 2022 bear is still being slowly worked through,” says the report. It’s not something new that ETH is going through a phase like this; as the graph highlights, the asset has also faced similar periods of uncertainty in the past.

ETH Price

At the time of writing, Ethereum is trading around $1,800, up 1% in the past week.

Read More
Blockchain

Solana Price’s 70% Rally Persuades Detractor, Arthur Hayes Makes Confession

Supported by a spike in volatility, the Solana price has skyrocketed from its yearly lows into a new high. The bullish momentum left some players in disbelief, while others capitulated to the price action and tried to capture some of the profits.

As of this writing, SOL trades at $40 with sideways movement in the last 24 hours. Over the previous week, the cryptocurrency recorded a 30% profit, but the monthly chart saw a 70% increase, while other tokens hardly saw double-digit gains.

Solana Rally Changes Arthur Hayes’ Mind

SOL’s recent bullish price action is even more impressive when considering higher timeframes. At the end of 2022, due to the collapse of its most prominent supporter crypto exchange, FTX, the cryptocurrency lost almost all its yearly profits.

During the 2021 bull run, Solana climbed to an all-time high of around $250. In the last days of FTX and Sam Bankman Fried (SBF), the cryptocurrency declined below $10. Now that the token approaches the $50 mark, critics like the former CEO of crypto exchange BitMEX, Arthur Hayes, have reconsidered their position.

Hayes has been vocal about its stance regarding FTX, Bankman-Fried, and the other bankrupted companies in 2022 and the tokens associated with these entities. However, regarding SOL, the BitMEX Co-Founder said:

Fam I have something embarrassing I must admit. I just bot $SOL, I know its a Sam-coin piece of dogshit L1 that at this point is just a meme. But it is going up, and I’m a degen. Let’s Fucking Go!

Arthur Hayes Expects Further Gains

The former BitMEX CEO has publicly expressed his position regarding Bitcoin’s potential to reach new all-time highs. A rally in the number one cryptocurrency would inevitably spill over to Solana.

As NewsBTC reported, in a detailed analysis, Hayes highlighted the intricate connection between global financial trends and Bitcoin’s future, emphasizing the influence of government policies and financial disturbances on investment strategies.

The former BitMEX CEO anticipates a period of market turbulence, with Bitcoin’s value chopping around $25,000 to $30,000, driven by negative real rates and a shift towards diversified investment portfolios. This, he believes, will particularly favor cryptocurrencies, such as Solana.

Looking ahead, Hayes projects a bullish trend for Bitcoin, estimating its value could reach approximately $70,000 by the end of 2024, influenced by the Bitcoin Halving event and potential Exchange Traded Fund (ETF) launches. His long-term vision extends even further, predicting an extraordinary financial boom across various markets, potentially driving Bitcoin’s value between $750,000 and $1,000,000 by 2026.

This optimistic forecast is rooted in his belief that major financial indices, like the NASDAQ and S&P, alongside other significant assets, will experience unprecedented growth, marking a historic boom in the financial markets.

On a related note, Hayes also speculated that a return to aggressive money printing strategies by the US Federal Reserve could act as a substantial catalyst for Bitcoin’s ascent, further fueling the anticipated financial euphoria.

Cover image from Unsplash, chart from Tradingview

Read More
Blockchain

Analyst Raises Red Flag On Bitcoin Rally, Predicts Imminent Retreat After 35% Spike

As Bitcoin (BTC) continues to consolidate above the $34,000 mark, aiming to surpass and reclaim its yearly high, theories suggest that a retracement may follow the current upward spike in the coming weeks. 

On this matter, the renowned crypto analyst known by the pseudonym “Crypto Soulz” recently shared insights on the potential short-term retracement for Bitcoin in a recent post on X (formerly Twitter).

BTC’s Local Top At $36,000 Signals Potential Reversal

According to Crypto Soulz, a key resistance level for Bitcoin is identified at $37,370. The analyst suggests that this resistance level will not likely be retested from the current position. 

Additionally, Soulz highlights that liquidity has been absorbed around $36,000, which he considers a “trigger” for taking short positions.

The analyst points out that the local top for BTC was observed at $36,000, where a long wick was formed, followed by a retracement. This price action is seen as a potential indication of a reversal.

Moreover, Crypto Soulz emphasizes using on-chain data as a confluence for BTC positions. Soulz highlights that the spot market showed an uptrend before the perpetual futures contracts followed suit. 

The spot order book (OB) is stated to be increasing but expected to decrease, along with the perpetual market. If $36,000 indeed serves as a local top, the analyst suggests that both spot and perpetual should subsequently decrease.

Furthermore, Soulz highlighted that BTC successfully broke through key technical indicators, such as the 200-day simple moving average (SMA), the 200-week SMA, and the 365-day SMA, which is currently acting as support. 

Ultimately, Soulz further states that there is no substantial liquidity available above $38,000. The analyst identifies two liquidity pools, as seen in the chart above: the first at $33,000, which he considers its initial target, and the second at $31,000, where a slight bounce may occur.

Bitcoin Potential As Store Of Value

In another development, Jurrien Timmer, Fidelity’s Director of Global Macro, delved into the characteristics of Bitcoin and its potential to serve as a store of value and hedge against monetary debasement.

Drawing parallels to gold, Timmer highlighted Bitcoin’s “unique attributes” and its ability to potentially gain market share in times of inflation and excessive money supply growth.

Timmer acknowledged that Bitcoin had followed a pattern of “boom-bust cycles,” much like its previous market behavior. However, he also emphasized Bitcoin’s evolving role as a commodity currency that aspires to be a store of value. 

Furthermore, Timmer described Bitcoin as “exponential gold,” suggesting that it shares similarities with gold but with additional growth potential.

While gold has traditionally been recognized as a store of value, Timmer noted its limitations as a medium of exchange due to its deflationary nature and lack of efficiency. 

Timmer drew attention to historical periods, such as the 1970s and 2000s, when gold exhibited strength and gained market share. These periods coincided with structural regimes marked by high inflation, negative real rates, and excessive money supply growth. 

Timmer hinted that Bitcoin, with its potential to serve as a hedge against inflation and debasement, could play a similar role in such environments.

Considering Bitcoin’s attributes and the changing macroeconomic landscape, Timmer expressed optimism about its potential to join the ranks of gold as a valuable asset. 

While acknowledging the volatility and speculative nature of cryptocurrencies, Timmer believes that Bitcoin’s unique characteristics position it as a viable contender in the store of value space.

Currently, BTC is trading at $34,700, reflecting a 1.5% increase over the past 24 hours as it persists in reaching the $35,000 mark.

Featured image from Shutterstock, chart from TradingView.com 

Read More