Crypto Corner Café

Taste The Future

Blockchain

Blockchain

$9 Trillion BlackRock Files Ethereum Spot ETF, What’s So Special About It?

Following BlackRock’s official filing of Spot Ethereum with Nasdaq, reports have confirmed that BlackRock’s Ether ETF plan has been confirmed by Nasdaq and is on its way to the US SEC to gain final approval. 

BlackRock Ethereum Spot ETF Confirmed

American multinational investment company, BlackRock has been making waves in the crypto space after news spread of NASDAQ listing the investment firm’s Ethereum Spot ETF, iShares Ether Trust in Delaware.

“BlackRock’s Ethereum ETF confirmed. They just submitted a 19b-4 filing with Nasdaq,” Bloomberg Research Analyst, Jeff Seyffart stated

While BlackRock’s Spot Bitcoin ETF proposal remains to be approved by the United States Securities and Exchange Commission (SEC), the $9 trillion asset management company has placed its focus on Ethereum Spot ETFs while it waits for the SEC’s final decision on Spot Bitcoin ETFs. 

The news of the Nasdaq Ethereum ETF filing comes as a major development for BlackRock’s move into the ETF world. Although the investment company remains tight-lipped on the ETH ETF reports flowing through the space, the possibility of an Ether Spot ETF approval could be a sign of the SEC’s approval of Spot Bitcoin ETFs in the future. 

Many crypto enthusiasts have predicted that the US SEC may continue its efforts to stop the growth of Spot Bitcoin ETFs by declining BlackRock’s Ether Spot ETF filing. 

However, in the case the regulatory body does approve the asset management company’s Ethereum Spot ETF, the SEC could be faced with potential contradictions in its decision-making processes. The acceptance of ETH Spot ETFs would stand in stark contrast to the previous disapproval of Spot Bitcoin ETFs.

Presently, the crypto community has been largely positive, as market metrics signal a potential rally for altcoins following BlackRock’s Ethereum Spot ETF confirmation. 

A crypto member has stated that the asset management company’s move into Ether Spot ETFs indicates strategic confidence in securing approval for Spot Bitcoin ETF in the future. 

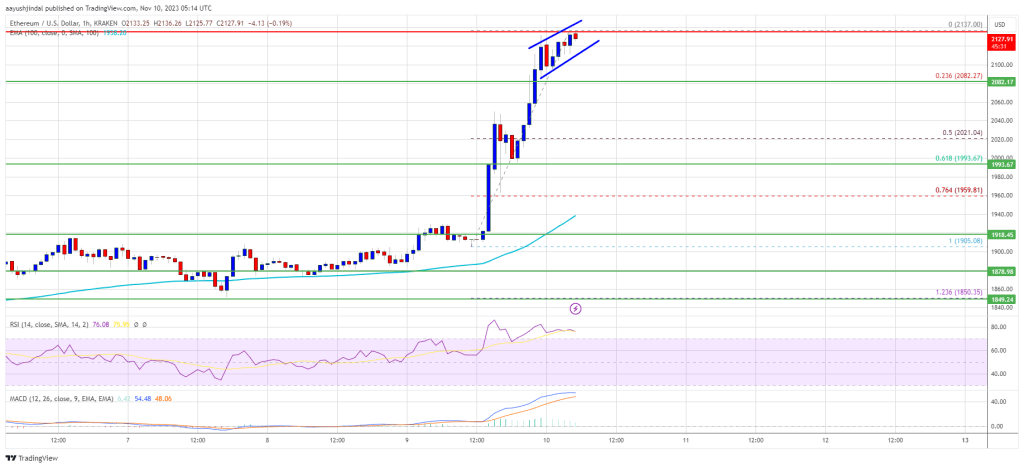
ETH Price Skyrockets

Following the news of NASDAQ registering BlackRock’s Ethereum Spot ETF, the price of ETH has increased by over 9% and is currently trading at $2,086.92 according to CoinMarketCap.

Reports of the Ethereum Spot ETF filing have sparked a rally in the cryptocurrency, topping over $2,000 for the first time since April this year. ETH’s market volume has also increased by 171.53%.

Many crypto investors are looking forward to more positive developments in the cryptocurrency regarding Ethereum Spot ETFs as an official approval may indicate a potential long-term bull run for ETH.

Read More
Blockchain

Shiba Inu Burn Rate Soars Over 3,000% – What’s The Impact On Price?

Shiba Inu (SHIB) finds itself in a curious position as it experiences minor dips in its 24-hour trading value, diverging from the upward momentum seen in altcoins such as LINK, ADA, and SOL. The surge in these alternative cryptocurrencies has been propelled by Bitcoin’s climb to the $36,000 level.

Despite the broader market’s positive movements, SHIB’s recent performance prompts a closer examination of its resilience and potential trajectory.

The Shibburn website has reported a remarkable surge in the burn rate, surpassing 3,000% in the last 24 hours, resulting in the incineration of over 9 million tokens. This significant increase in token burn raises a crucial question: What could be the potential impact of this heightened burn rate on SHIB’s price dynamics?

Analyzing SHIB’s Current Price Trends

As of the latest update from CoinGecko, SHIB is priced at $0.00000826, reflecting a 4.3% decline in the past 24 hours. However, the token has managed to secure a 5.9% gain over the last seven days, showcasing a level of volatility that demands a more nuanced understanding of the factors influencing SHIB’s price movements.

Investors keen on the Shiba Inu market are carefully scrutinizing this fluctuation, with the broader crypto market exhibiting robust rallies. While SHIB has dipped marginally in the short term, its seven-day gains suggest an underlying resilience that could be crucial in navigating the current crypto landscape.

Navigating A Formidable Barrier

Adding to the complexity, Shiba Inu’s recent price surge has brought it to a critical juncture, approaching a significant barrier that could impede further gains. According to new data, SHIB faces a colossal 250 trillion barrier within its current trading range, spanning from $0.000008 to $0.000014. Within this range, a staggering 361,080 addresses have collectively acquired 250.23 trillion SHIB at an average price of $0.000011.

Investors are closely watching this barrier, as breaking through or succumbing to it could be a pivotal moment for SHIB. The large number of addresses involved and the substantial quantity of SHIB acquired within this range underscore the significance of this price band and its potential impact on future market dynamics.

Implications For Shiba Inu Investors

The implications of this scenario raise concerns for Shiba Inu investors, as the token navigates both short-term fluctuations and the imposing 250 trillion SHIB barrier. The intensified burn rate, while potentially influencing the token’s scarcity, must be scrutinized against the backdrop of broader market dynamics and investor sentiment.

(This site’s content should not be construed as investment advice. Investing involves risk. When you invest, your capital is subject to risk).

Featured image from Pexels

Read More
Blockchain

Matrixport Reveals Top 6 Bitcoin, Ethereum And Crypto Predictions For 2024

Matrixport, a leading player in the digital asset space, released a research titled “2024 Unveiled: Six Micro and Macro Events That Will Shape Bitcoin” dated Thursday, November 9, 2023, shedding light on crucial events projected to shape the crypto landscape in 2024. The report highlights a mix of micro and macro events anticipated to positively impact the industry, with a particular focus on Bitcoin.

Top 6 Predictions For Bitcoin And Crypto

First, the report underlines the anticipation of the US Securities and Exchange Commission (SEC) approving a Bitcoin ETF. Notably, the company believes that the approval of the first spot ETFs will take a few more weeks. Matrixport stated, “By January 2024, we anticipate the SEC to approve a Bitcoin ETF, with trading expected to commence by February or March.” This event is viewed as a massive catalyst for increased institutional investment in Bitcoin.

Further, Matrixport points to the potential listing of stablecoin issuer Circle on the stock market by April 2024. This event is seen as a significant step towards mainstream acceptance of digital assets. According to a Bitcoinist report, Circle, the company behind the stablecoin USDC, is contemplating an Initial Public Offering (IPO) in early 2024.

Currently, the company is engaging with consultants to lay the groundwork for this potential public listing, though it remains uncertain whether the IPO will ultimately materialize.

The third prediction of Matrixport concerns FTX, “While the announcement of FTX’s winning bid could occur in December 2023, we project the exchange to be operational by May or June 2024,” the report forecasts. FTX is anticipated to reclaim its position as a top 3 exchange within 12 months, making a strong comeback in the crypto exchange landscape.

Also, the report mentions the interplay of these three events with the Bitcoin halving cycle, suggesting a synergistic effect that could provide momentum into the following year. The halving is expected to take place at the end of April 2024 and could be the most impactful halving of all time. Bitcoin will become the hardest asset in the world as BTC’s inflation rate will fall to half that of gold.

Ethereum And Macro Predictions

As a fifth prediction, Matrixport sees Ethereum’s EIP-4844 upgrade, scheduled for Q1 2024, as a less significant, yet noteworthy event. The report states, “Although seeing this as a significant upside catalyst is challenging, in Q1 2024, Ethereum’s IEP-4844 upgrade is scheduled to take place.”

Related Reading: A Chat With Paolo Ardoino: What’s Behind The Bitcoin Price Rally, New Role As CEO, And Adoption

Furthermore, the potential US Federal Reserve interest rate cut by mid-2024 is mentioned as a macro event that could have a significant impact on the crypto market. “This [Ethereum’s upgrade] also coincides with the potential US Federal Reserve interest rate cut by mid-2024, as market pricing indicates the first rate cut happening in June 2024,” the report elaborates.

The report concludes with an analysis of the short-term Bitcoin price movement. It notes, “Next week’s US CPI data could trigger another rally in Bitcoin if inflation declines again.”

The report forecasts Bitcoin attempting to break out, with a potential to reach up to $45,000 by the end of 2023, catalyzed by a ‘Santa Claus rally’.

At press time, BTC traded at $36,657.

Read More
Blockchain

Ripple IPO: Expert Reveals Why Investors Should Be Cautious

In a recent development, a prominent figure in the XRP community has explained why members of the community should be careful about being so excited about a Ripple IPO. Using historical data, she elaborated on why an IPO isn’t as straightforward and profitable as some might think. 

Why Investors Should Be Cautious

In a post shared on her X (formerly Twitter) platform, Crypto Eri revealed how investors aren’t excited about IPOs in what sounded like a note of warning to those who are ready to go all in if Ripple were to go public

The reason for investors’ lack of enthusiasm seems to be that the biggest IPOs of 2021 have shed 60% of their value since going public. According to her, this fact has also made other private entities cautious to hold off on their plans to go public. 

She highlighted certain “essential components” that investors should insist on when listening to anyone talk about price analysis and a company’s valuation. These components include the components cash balance, debt, value of investment portfolio, total shares outstanding, and value of any on-hand assets. 

While Eri seems to be more cautious about a potential Ripple IPO, some others have taken a more bullish stance and are ready to go all in on it. One of them happens to be pro-XRP Wall Street financial analyst Linda Jones, who had predicted that a Ripple stock could be valued as high as $600. 

She also touted XRP as the next big thing in the financial market as she likened the crypto token to Microsoft and Apple’s stocks. 

Maybe Not The Right Time For A Ripple IPO

Eri’s warning also seemed to be directed at Ripple as she highlighted key points that might make the crypto company reconsider if an IPO was already in the works. She drew comparisons between Ripple and other similar types of companies, as the former could take a cue from some of their actions. 

Interestingly, one of them happens to be Ripple’s partner, Nium Global, which she noted was holding off its US IPO to “possibly the second quarter of 2025.” She alluded to the fact that this decision was made despite the fact that Nium Global is doing pretty well and even recently launched a liquidity hub for FX. 

The XRP community might, however, not have to worry about how Ripple will fare if it goes public now, as there is evidence to suggest that the company doesn’t plan on doing so anytime soon. 

The founder of Dizer Capital, Yassin Mobarak, recently revealed that Ripple’s CEO Brad Garlinghouse mentioned that a Ripple IPO wasn’t feasible until the company’s legal battle with the SEC is over.

Read More
Blockchain

Pepe Climbs 21% – What’s Igniting The Meme Coin Fire?

PEPE, the meme coin that had seemingly fallen into silence with no major positive developments, has staged a significant comeback in the crypto market. Today, the coin experienced a noteworthy surge, witnessing a price increase of $0.000001417 in 24-hour trading, marking an impressive 21% rally. 

Highlighting PEPE’s Potential

The sudden surge in PEPE’s value has sparked interest and speculation within the crypto community. One possible catalyst for this upward movement is the revelation of PEPE’s undervaluation index. 

Top-11 #PJTs with Market Cap from $300M to $500M by #Undervaluation Index (UI*) #UI is a Market Cap to 24H Trading Volume ratio applied to PJTs with a similar Market Cap. The lower the UI, the more the PJT is undervalued.$SUI $TIA $TRB $PEPE $COMP $QTUM $DASH $AGIX $ASTRpic.twitter.com/ZvLlEiCRTV

— Cryptolaxy #StandWithUkraine (@Cryptolaxy) November 7, 2023

Cryptolaxy, a prominent crypto analysis platform, took to social media on platform X to share that PEPE’s undervaluation index stands at 4.2. The undervaluation index serves as a metric to assess whether an asset is trading at a price that accurately reflects its true value.

In the case of PEPE, with an undervaluation index of 4.2, the coin appears to be trading below its potential value, hinting at the possibility of a forthcoming price uptick.

Significance Of Whale Movement

Adding to the intrigue surrounding PEPE’s resurgence, Lookonchain, a blockchain analytics platform, drew attention to a notable development in the market. According to their post, a whale — a large investor with significant holdings — has initiated the accumulation of PEPE. 

What did the whale buy recently?

The whale with 10,080 $ETH($19.4M) spent 1,433 $ETH($2.6M) to buy 2.51M $ARB at $1.045 and 1,038 $ETH ($1.9M) to buy 1.65T $PEPE at $0.000001154.

The whale is currently making $177K(+7%) on $ARB and $159K(+8%) on $PEPE.https://t.co/9Btmdst56T pic.twitter.com/EwsXjIFGdz

— Lookonchain (@lookonchain) November 9, 2023

The movement of whales in the crypto market often carries significance, influencing trends and prices. The accumulation of PEPE by a whale suggests confidence in the coin’s potential and could further contribute to its upward trajectory.

PEPE’s Rollercoaster Ride And Future Prospects

As PEPE experiences this rollercoaster ride in its price dynamics, crypto enthusiasts and investors are closely monitoring the developments. The recent surge, driven by undervaluation and whale accumulation, raises questions about the sustainability of PEPE’s upward momentum. 

Analysts are likely to delve into the underlying factors influencing the coin’s value, exploring whether this resurgence is a short-term spike or indicative of a more substantial trend. The crypto community awaits further developments and market signals to gauge PEPE’s future prospects in this ever-evolving landscape.

(This site’s content should not be construed as investment advice. Investing involves risk. When you invest, your capital is subject to risk).

Featured image from Counselling/Pixabay

Read More
Blockchain

Solana Price Could Reach $1,000, Analyst Explains Why

Crypto analyst Jacob Canfield has laid out a comprehensive analysis, suggesting Solana (SOL) could be on the brink of an unprecedented market surge. “In my opinion, I think that Solana is going to continue to be one of the biggest movers during this current bull market cycle,” Canfield states, proposing that Solana could potentially escalate its market dominance to the 12-15% range.

Can Solana Hit $1,000?

Canfield bases his analysis on several indicators. He highlights the Solana Dominance (SOL.D) chart, noting that at the peak market cap, it didn’t even crack 3%. Given the current trends and the breakout of SOLBTC from its weekly resistance, Canfield envisions a scenario where Solana could enter a parabolic rally phase, which is further supported by the SOLETH chart showing a similar pattern. “SOLETH – Also currently broke out of a weekly resistance and looks to be forming a parabolic rally against it.”

A significant factor in Canfield’s analysis is the current state of Ethereum Dominance (ETH.D). He notes that ETH.D is breaking down from a long-term trendline and losing the 200 weekly moving average, now sitting at 17%. “If Solana continues to trend against Ethereum and it continues to break down to 2019-2020 levels, we could see SOL as the big winner this cycle,” Canfield explains.

However, Canfield does not disregard the potential ramifications of recent news regarding an Ethereum ETF. “This may not play out with the current ETF announcement news as it will bring more attention,” he acknowledges, indicating that an approved Ethereum ETF could shift investor focus and capital back to Ethereum, potentially tempering Solana’s ascent.

Despite potential headwinds from the Ethereum sector, Canfield emphasizes Solana’s robust partnerships with corporate giants like Google, Circle, and Amazon, positing that these collaborations could significantly drive adoption and enhance Solana’s visibility in this cycle of the crypto market.

Furthermore, Canfield’s analysis extends beyond charts and partnerships. He delves into the Solana ecosystem, spotlighting projects that are paving the way for its expansion. From decentralized finance protocols and automated market makers to NFT storage solutions and governance tokens for gaming platforms, Canfield points to a breadth of innovation within Solana that parallels, and in some aspects, seeks to outdo Ethereum’s ecosystem.

In light of the FTX debacle, Canfield remarks on the psychological impact on Solana’s market sentiment, noting that with Sam Bankman-Fried’s legal troubles, there is an opportunity for Solana to redefine itself. “There’s a bit of PTSD around the ecosystem, but it’s time to become its own entity and forge its own future,” he asserts, suggesting that Solana’s future will be shaped by those who are deeply integrated into its ecosystem, from developers to traders and influencers.

His conclusion: “Solana could triple or quadruple it’s all time high market dominance around 12-15% and if it continues to trend against Bitcoin, could easily see a $1,000 per coin and take the #2 spot behind Bitcoin.” When asked about the potential of Ethereum, Canfield emphasized, “No reason to not have allocations to both. It’s like trying to bet on Microsoft or Google. Tesla or Ford: Just buy both.”

Short-Term SOL Price Outlook

On the shorter-term horizon, analyst Rekt Capital brings attention to Solana’s price movements in a recent post on X. “Solana continues to outperform in the market. In 2021, SOL upside deviated to $53 and then $61 before retracing to the bottom of the purple box,” he noted, referring to a specific zone on the price chart that has historically acted as both resistance and support.

In the Rekt Capital chart, SOL is currently breaking out above the zone. However, if history repeats itself and the zone once again acts as strong resistance, the SOL price could suffer a severe pullback. Using the green arrow in the chart, Rekt Capital paints a scenario in which SOL initially falls back towards $30 before the price rises again towards $42.

Read More
Blockchain

MATIC Price Prediction: Polygon Pump 15%, Bulls Target $1

MATIC price is up over 15% and trading near $0.85. Polygon bulls are in charge, and they might soon aim for a move toward the $1.00 level.

MATIC price started a strong increase above the $0.75 resistance against the US dollar.
The price is trading above $0.78 and the 100 simple moving average (4 hours).
There is a key bullish trend line forming with support near $0.775 on the 4-hour chart of the MATIC/USD pair (data source from Kraken).
The pair could continue to rise if it clears the $0.850 and $0.880 resistance levels.

Polygon Price Signals Breakout

After forming a base above the $0.65 level, Polygon’s price started a strong increase. MATIC broke many hurdles near $0.70 to move into a positive zone, like Bitcoin and Ethereum.

There was a move above the $0.75 resistance and the price climbed over 15%. Finally, it tested the $0.850 resistance zone. A high was formed near $0.8588 and recently the price saw a downside correction. There was a sharp decline below the $0.820 level.

The price even spiked below the 50% Fib retracement level of the upward wave from the $0.6952 swing low to the $0.8588 high. However, the bulls remained active above the $0.750 support zone.

There is also a key bullish trend line forming with support near $0.775 on the 4-hour chart of the MATIC/USD pair. The trend line is near the 61.8% Fib retracement level of the upward wave from the $0.6952 swing low to the $0.8588 high.

MATIC is now trading above $0.78 and the 100 simple moving average (4 hours). Immediate resistance is near the $0.850 level. The first major resistance is near the $0.880 level. If there is an upside break above the $0.880 resistance level, the price could continue to rise.

Source: MATICUSD on TradingView.com

The next major resistance is near $0.920. A clear move above the $0.920 resistance could start a steady increase. In the stated case, the price could even attempt a move toward the $0.980 level or $1.00.

Downside Correction in MATIC?

If MATIC’s price fails to rise above the $0.850 resistance level, it could start a downside correction. Immediate support on the downside is near the $0.800 level.

The main support is near the $0.775 level or the trend line. A downside break below the $0.775 level could open the doors for a fresh decline toward $0.720. The next major support is near the $0.700 level.

Technical Indicators

4 hours MACD – The MACD for MATIC/USD is gaining momentum in the bullish zone.

4 hours RSI (Relative Strength Index) – The RSI for MATIC/USD is now above the 50 level.

Major Support Levels – $0.800 and $0.775.

Major Resistance Levels – $0.850, $0.880, and $0.980.

Read More
Blockchain

Ethereum Price Surges 10%, Here’s Why ETH Could Pump 5% More

Ethereum price is up over 10% and surpassed the $2,000 resistance. ETH is outperforming Bitcoin and might rise further toward the $2,200 resistance.

Ethereum rallied above the $2,000 and $2,050 levels.
The price is trading above $2,050 and the 100-hourly Simple Moving Average.
There is a short-term rising channel forming with support near $2,115 on the hourly chart of ETH/USD (data feed via Kraken).
The pair could continue to move higher toward the $2,200 resistance in the near term.

Ethereum Price Regains Strength

In the past 2-3 analyses, we discussed high chances of Ethereum surging toward the $2,000 level. ETH did start a strong increase and broke many hurdles near $1,920.

It even surged above the $2,000 resistance, outperforming Bitcoin. It is up over 10% and consolidating near $2,125. A new multi-week high is formed near $2,137 and the price is now showing more positive signs. There is also a short-term rising channel forming with support near $2,115 on the hourly chart of ETH/USD.

It is trading above $2,050 and the 100-hourly Simple Moving Average. The price is also above the 23.6% Fib retracement level of the recent rally from the $1,905 swing low to the $2,137 high.

Source: ETHUSD on TradingView.com

On the upside, the price is facing resistance near the $2,135 level. The next major resistance sits at $2,150, above which the price could accelerate higher. In the stated case, the price could rally toward the $2,200 resistance. The next key resistance is near $2,250, above which the price could aim for a move toward the $2,320 level.

Buy Dips in ETH?

If Ethereum fails to clear the $2,135 resistance, it could start a downside correction. Initial support on the downside is near the $2,115 level and the channel’s trend line.

The next key support is $2,080. The main support sits at $2,000 or the 61.8% Fib retracement level of the recent rally from the $1,905 swing low to the $2,137 high. A downside break below the $2,000 support might spark bearish moves. In the stated case, Ether could drop toward the 100-hourly Simple Moving Average or even $1,920 in the near term.

Technical Indicators

Hourly MACDThe MACD for ETH/USD is gaining momentum in the bullish zone.

Hourly RSIThe RSI for ETH/USD is now above the 50 level.

Major Support Level – $2,080

Major Resistance Level – $2,150

Read More
Blockchain

Bitcoin Price Bullish Streak Takes A Break But Bulls Are Not Done Yet

Bitcoin price rallied further above the $37,200 resistance zone. BTC is now consolidating and might aim for more upsides above the $37,600 resistance zone.

Bitcoin started a strong increase above the $37,200 resistance zone.
The price is trading above $36,200 and the 100 hourly Simple moving average.
There is a major bullish trend line forming with support near $36,200 on the hourly chart of the BTC/USD pair (data feed from Kraken).
The pair is consolidating gains and might continue to rise toward $38,000.

Bitcoin Price Remains Strong

Bitcoin price started a fresh increase above the $36,500 resistance zone. BTC gained pace for a clear move above the $37,200 resistance zone and rallied over 5%.

A new multi-week high was formed near $37,971 before there was a downside correction. There was a move below the $37,000 level. The price spiked below the 50% Fib retracement level of the upward move from the $35,100 swing low to the $37,971 high.

Bitcoin is now trading above $36,200 and the 100 hourly Simple moving average. There is also a major bullish trend line forming with support near $36,200 on the hourly chart of the BTC/USD pair.

The pair is also holding the 61.8% Fib retracement level of the upward move from the $35,100 swing low to the $37,971 high. It is now consolidating near the $36,750 level and is now attempting a fresh increase. On the upside, immediate resistance is near the $37,000 level.

Source: BTCUSD on TradingView.com

The next key resistance could be near $37,300, above which the price might accelerate further higher. In the stated case, it could test the $37,800 level. Any more gains might send BTC toward the $38,000 level.

Buy Dips In BTC?

If Bitcoin fails to rise above the $37,000 resistance zone, it could start a downside correction. Immediate support on the downside is near the $36,500 level.

The next major support is near the $36,200 zone or the trend line. If there is a move below $36,200, there is a risk of more downsides. In the stated case, the price could drop toward the key support at $35,500 in the near term.

Technical indicators:

Hourly MACD – The MACD is now gaining pace in the bullish zone.

Hourly RSI (Relative Strength Index) – The RSI for BTC/USD is now above the 50 level.

Major Support Levels – $36,500, followed by $36,200.

Major Resistance Levels – $37,000, $37,300, and $38,000.

Read More
Blockchain

Bitcoin Bulls Gear Up: 200-Day SMA Rise And Historical Trend Signal $50,000 Price Target

In a surprising turn of events, Bitcoin (BTC) has once again defied expectations by reaching a new yearly high, igniting speculation about whether it can break the $40,000 milestone. 

After a brief consolidation phase, the leading cryptocurrency has regained its bullish momentum, soaring to a peak of $38,000 before retracing to its current trading level of $36,400. As the market eagerly awaits the next move, experts and analysts weigh in on Bitcoin’s potential to sustain its upward trajectory.

BTC’s Golden Cross Signals Potential Surge To $50,000

The Birb Nest team provides valuable insights into the short-term scenarios for Bitcoin. From a fundamental perspective, the anticipation of ETFs (Exchange-Traded Funds) and the upcoming halving event contribute to the current drive and support the bullish sentiment in the market. 

Moreover, from a technical standpoint, Bitcoin’s recent breakthrough of $32,000 has its sights set on the key psychological level of $40,000, bolstered by the presence of the Golden Cross and a rising 200-day simple moving average (SMA).

The Golden Cross, a bullish technical pattern formed when a short-term moving average crosses above a long-term moving average, has played a significant role in Bitcoin’s recent surge. 

Combined with the rising 200-day SMA, which indicates a strengthening long-term trend, these indicators reinforce the ongoing uptrend and provide a strong foundation for Bitcoin’s potential upward movement.

According to the Birb Nest team’s analysis, Bitcoin’s price action suggests an imminent increase in volatility, as indicated by the bullish Fear & Greed Index registering at 68.

After experiencing a 27% jump in October, surpassing the historical average, November historically exhibits robust gains of over 40%, potentially propelling Bitcoin toward $50,000. 

Notably, the second half of the month tends to be more bullish, heightening the anticipation for further price appreciation.

Expert Identifies Pivotal Resistance For Bitcoin

According to a recent post on X (formerly Twitter) by the crypto expert Michael Van De Poppe, $38,000 to $40,000 represents a critical resistance zone for Bitcoin. 

This means that price levels within this range will likely face significant selling pressure and challenge Bitcoin’s upward momentum. Van De Poppe warns against expecting an immediate breakout above this resistance level, suggesting that consolidation beneath it is a more probable scenario.

Van De Poppe emphasizes the importance of consolidation beneath the resistance zone. Van De Poppe suggests that such consolidation provides a healthy base for Bitcoin’s price to gather strength before attempting a breakthrough. 

By stabilizing within this range, Bitcoin builds a stronger foundation to support a potential bullish move in the future.

Regardless of the forecast, the cryptocurrency’s upcoming price action remains to be seen if it will be accompanied by consolidation and a subsequent breakout or if Bitcoin is inclined to test lower support levels before embarking on another bullish move.

Featured image from Shutterstock, chart from TradingView.com 

Read More