Crypto Corner Café

Taste The Future

Blockchain

Blockchain

XRP Will Not Become A Stablecoin For Banks After AMM Launch: Expert

In the wake of Ripple’s announcement regarding the integration of an Automated Market Maker (AMM) into the XRP Ledger (XRPL), the community has been abuzz with speculation and debate. Central to this discourse is the potential transformation of XRP in light of this update, particularly in regard to its classification and function as a digital asset.

Ripple’s Chief Technology Officer, David Schwartz, previously hailed this update as the most significant for XRPL, raising expectations among stakeholders. Additionally, at the recent Swell conference, Ripple revealed plans to integrate its rebranded Ripple Payments product with the XRPL’s native decentralized exchange (DEX), further stirring discussions among community members.

The community’s response has been a mix of euphoria and confusion. Digital Perspectives, a key community influencer with over 150,000 followers on X, expressed concerns over the potential implications of this update: “Are we watching XRP become a stablecoin with the introduction of AMMs and the Prudential Treatment requirements from the Bank of International Settlement [BIS]? Cat 1 vs Cat 2, where would you classify XRP?”

He further questioned, “When XLS-30D passes and AMMs become an integral part of the XRPL, will it change the characteristics of XRP and qualify as a group 1b asset for BIS and other banks?”

XRP Price Volatility Is Necessary

Panos Mekras, the co-founder of crypto-focused company Anodos, quickly intervened to dispel the rumors and speculation about XRP morphing into a stablecoin to fit into the 1b asset class of the BIS with the advent of the AMM. Mekras, who has previously clashed with Digital Perspectives over misinformation, laid out a detailed refutation of the idea that XRP could become a stablecoin.

He emphasized, “The fundamental nature of XRP as the native coin of the XRP Ledger, a decentralized digital asset traded freely, is unchangeable. It’s technically impossible for XRP to transform into a stablecoin, a concept that completely contradicts its inherent design.”

He further delved into the dynamics of AMMs, noting that they are most effective in environments with high volatility. This volatility benefits liquidity providers (LPs) by attracting more traders and, consequently, increasing trading volume and fees. According to Mekras, the AMM is tailored to take advantage of such market conditions.

Mekras also highlighted the potential impact of the AMM on XRP’s market dynamics. He suggested that the AMM’s implementation might lead to an increase in buying pressure on XRP. A significant portion of the token is expected to be locked in the AMM, which would enhance its liquidity and attract more traders. This, in turn, would make the crypto token more versatile and efficient for various use cases.

In his concluding remarks, Mekras called for a more informed understanding within the community. He stressed the need to focus on the technical aspects of XRPL and the AMM, advising against following individuals who propagate misinformation.

“The community should stop following and paying attention to enablers of misinformation such as Digital Perspectives and learn more about the technicals of the XRPL and the AMM,” Mekras said.

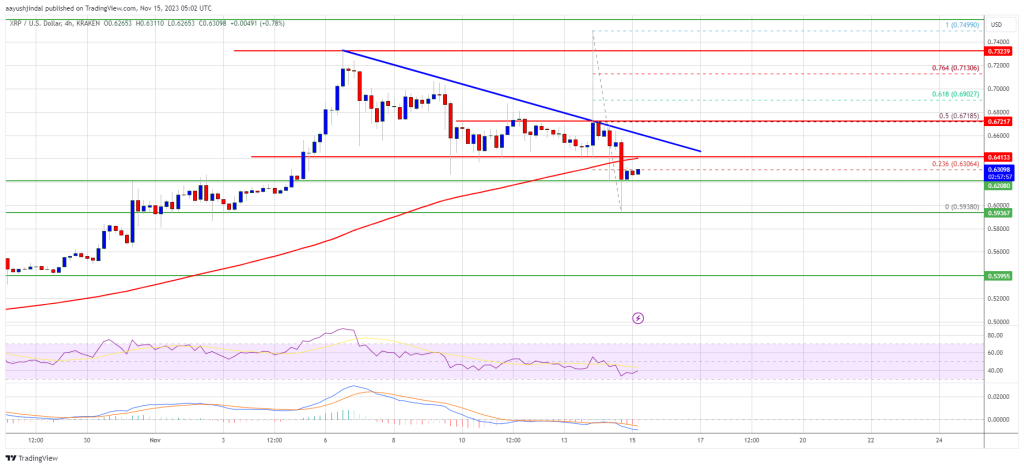
At press time, the XRP price found support at the 0.382 Fibonacci retracement level in the 1-day chart and traded at $0.6333.

Read More
Blockchain

Solana Institutional Inflows Surge In One Week, Can The Price Reach $100?

Institutional inflows into digital asset investment products based on Solana spiked last week, particularly as these investment products saw a 7th consecutive week of inflows

Digital asset investment products have had inflows since the end of September and throughout October, reflecting the bullish sentiment in the broader crypto market. As a result, inflows into Solana have increased steadily, and last week jumped by 15% compared to the week before. 

Solana Institutional Inflows Surge

Solana has been on an incredible run recently and has had one of the best price gains this month. Solana’s native token SOL has seen its price skyrocket over 160% in the past 30 days alone amidst the wider buying in the crypto industry. The crypto is up by 33% in a 7-day timeframe, despite the ongoing consolidation in Bitcoin, Ethereum, XRP, and a few other cryptocurrencies in the same timeframe.

According to CoinShares’s latest weekly report on digital asset funds, inflows into digital asset investment products did not mirror this consolidation, as inflows reached $293 million last week. Solana had around $12.4 million in inflows, up from $10.8 million the previous week. As a result, its year-to-date inflows have now crossed over $120 million. 

On the broader end, total exchange-traded products have now crossed a historic $1 billion mark this year and are now at $1.14 billion. This was particularly fueled by inflows into Bitcoin investment products, which made up around 19% of the cryptocurrency’s total trading volume last week. 

Bitcoin saw inflows totaling $240 million last week, pushing its year-to-date inflows to $1.08 billion. On the other hand, short-bitcoin saw $7 million in outflows, indicating an ongoing positive sentiment. Ethereum also witnessed an inflow of $49 million, while Litecoin and XRP had outflows of $0.3 million and $3.1 million, respectively. 

Can SOL Reach $100?

Solana is now definitely on its way to the $100 mark, as shown by technical analysis and fundamental analysis of strong bullish price action and institutional inflows. Solana is now looking to shake off the deterrence from the FTX fiasco and is now up by more than 520% since the beginning of the year. 

On-chain data also shows that Solana has grown its DeFi TVL by $136 million since the beginning of November. According to DeFiLlama, the total TVL on DeFi protocols based on Solana now sits at $546 million.

At the time of writing, Solana is trading at $58, still a long way from its all-time high of  $260. However, SOL has been predicted to surge more than 80% in November. If the crypto’s momentum keeps accelerating at this pace, a return to the $100 price target seems well within reach. 

Read More
Blockchain

Immutable X Cements Position With 32% Rally – How Far Is IMX Heading?

Celebrated as the paramount force in the realm of Web3 gaming, Immutable X (IMX) has emerged as the go-to blockchain, steering the course for NFTs and in-game transactions.

This blockchain powerhouse has solidified its position as the industry leader, particularly renowned for its association with blockbuster titles such as Gods Unchained and Guild of Guardians.

The native token IMX of Immutable X has had an amazing upswing, rising by an astounding 140%, in an intriguing turn of events. From the bottom of a bear market, when it was trading at under $0.50, it has made a spectacular comeback and is currently trading at a healthy $1.12.

Immutable X: Distinctive Mark On Digital Horizon

With the yearly high of $1.56, which was reached in March, rapidly approaching, it begs the crucial question: Will this increasing trend in values continue? The scene is set, the figures are moving, and analysts keep a close tab on the next developments in IMX’s financial story.

In the ever-evolving landscape of digital entertainment and blockchain technology, Immutable X has carved a niche for itself by not only powering but revolutionizing the gaming experience.

Distinguishing itself by dedicating its prowess solely to the gaming and NFT sectors, Immutable X has successfully lured projects that once called other chains home.

Immutable has recently announced a new collaboration with Ubisoft, a prominent gaming company known for its successful series such as Assassin’s Creed and Prince of Persia. This relationship marks a significant advancement for the platform.

Ubisoft’s partnership with Immutable seeks to smoothly incorporate decentralized technology into games, emphasizing player ownership and enjoyment despite recent setbacks in its NFT attempts.

In response to the recent statement made by Ubisoft, there has been a significant market rally for IMX. Over the course of the previous week, the price of the token has experienced a notable increase of more than 30%.

Strong Collaboration And ‘Digital Ownership’

Immutable CEO and co-founder James Ferguson stated that the collaboration between the two companies will provide players with “digital ownership.”

In a released statement, Ferguson expressed the intention to leverage the full strength of their ecosystem to guarantee the success of the partnership. He expressed confidence in delivering a novel and captivating experience that players will thoroughly enjoy.

Coming up to the last quarter of 2023, DigitalCoinPrice predicts a bright future for IMX, with the token rising to about $2.17.

Conversely, Coincodex presents a more negative outlook, projecting that the token will trade between $1.028443 and $1.308523 for the balance of the year.

This suggests a period of relative stability for IMX on average, with the token predicted to continue on a flat trajectory until the start of 2024.

(This site’s content should not be construed as investment advice. Investing involves risk. When you invest, your capital is subject to risk).

Featured image from PlayToEarnGames.com

Read More
Blockchain

Bitcoin Macro Index Enters ‘Expansion’, Echoing 400% Bull Run Surge

In a detailed market update, Charles Edwards, founder of Capriole Investment, has provided an in-depth analysis of Bitcoin’s current market position, highlighting a pivotal shift to an ‘expansion’ phase in the Bitcoin Macro Index. This transition is particularly noteworthy as it parallels conditions observed prior to historical price surges in Bitcoin’s valuation.

Bitcoin has recently experienced a sharp uptick, ascending from $34,000 to an interim high of $38,000. After a brief period of resistance, the price corrected to approximately $36,500. Edwards highlights this movement as a critical technical victory, with Bitcoin overcoming and holding above the major resistance benchmarks of $35,000 on both the weekly and monthly timeframes.

This consolidation above key resistance levels sets a bullish context in the high timeframe technical analysis, positioning Bitcoin in a strong technical stance according to traditional market indicators. “The recent breakout into the 2021 range offers the best high timeframe technical setup we have seen in years. Provided $35K holds on a weekly and monthly basis in November, the next significant resistance is range high ($58-65K).”

Bitcoin Macro Index Enters Expansion

The crux of Edwards’ update is the shift in the Bitcoin Macro Index, a complex model synthesizing over 40 metrics encompassing Bitcoin’s on-chain data, macro market indicators, and equity market influences. The index does not take price as an input, thus providing a ‘pure fundamentals’ perspective.

The current expansion is the first since November 2020, and only the third instance since the index’s inception, with the two previous occasions leading to substantial price rallies in the following periods. Edwards elucidates this with a direct quote: “The transition from recovery to expansion is simply the optimal time to allocate to Bitcoin from a risk-reward opportunity for this model.”

A look at the Bitcoin chart reveals that the Bitcoin price rose by a whopping 400% during the last bull run from early November 2020 to November 2021, after the Macro Index entered the expansion phase. The first historical signal was provided by the Macro Index on November 9, 2016, which was followed by a massive bull run of almost 2,600% until Bitcoin reached its then all-time high of $20,000 in February 2018.

Short-Term Technicals And Derivatives Market Analysis

In the short term, the technical outlook presents a mixed picture, according to Edwards. The derivative markets are indicating an overheated state, with low timeframe analysis suggesting a retracement could be imminent. Edwards introduces the ‘Bitcoin Heater’ metric, recently launched on Capriole Charts, which aggregate various derivatives market data and quantify the level of market risk based on the open interest and heating level of perpetuals, futures, and options markets.

The below chart shows that most of the time when the Bitcoin Heater is above 0.8, the market corrects or consolidates. “But there are large exceptions to the rule: such as the primary bull market rally from November 2020 through to Q1 2021. […] We should expect this metric to be high more frequently in 2024 (much like Q4 2020 – 2021),” Edwards stated.

The analyst concluded that the overall trend for Bitcoin remains positive, with major data points indicating a strong bullish scenario. However, he also cautioned about potential short-term risks in the low timeframe technicals and derivatives market. These, according to him, are common in the development of a bull run and could offer valuable opportunities if dips occur.

At press time, BTC traded at $35,626.

Read More
Blockchain

JPM Coin Poised For $10 Billion Daily Transaction Boom, JPMorgan Reports

JPMorgan Chase & Co. anticipates that its digital currency, JPM Coin, will facilitate daily transactions amounting to $10 billion in the coming year.

Umar Farooq, the Global Head of Financial Institution Payments at the bank, revealed this projection during an interview with Bloomberg held at the Singapore FinTech Festival.

Farooq’s insights shed light on the ambitious expectations the financial institution has for the widespread adoption and utilization of JPM Coin as a means of conducting transactions in the digital financial landscape.

Takis Georgakopoulos, the Global Head of Payments at JPMorgan Chase & Co., recently disclosed that JPM Coin is actively managing a staggering $1 billion in daily transactions.

In a recent interview on Bloomberg Television, Georgakopoulos highlighted the predominant use of JPM Coin in daily transactions denominated in US dollars and underscored the bank’s dedicated efforts to broaden its utilization, signaling a robust commitment to the ongoing evolution of digital financial instruments.

JPM Coin: Ambitious Growth Goals

Farooq expressed his aspiration for a substantial increase in transaction volume, aiming for a growth rate ranging from five to 10 times over the specified period.

“We really think it’s going to start taking off,” he said during an interview with Haslinda Amin of Bloomberg TV Wednesday, on the sidelines of the Singapore FinTech Festival.

Although the billion-dollar daily transaction volume achieved by JPM Coin is notable, it represents only a small fraction of the colossal $10 trillion in daily US dollar transactions managed by JPMorgan.

JPM Coin presents a secure and efficient avenue for wholesale clients to participate in dollar and euro-denominated payments within the confines of a private blockchain network.

Testing The Waters: Evaluating Digital Ledgers On A Grand Scale

Advocates for blockchain technology contend that it has the potential to facilitate instant payments at a reduced cost compared to prevailing technologies.

However, it’s crucial to note that digital ledgers, despite their touted advantages, have not undergone trials on the same expansive scale as established payment networks.

The claims surrounding the efficiency and cost-effectiveness of blockchains are still in the process of being substantiated through broader and more comprehensive real-world applications.

Programmable Payments For Institutional Clients

Meanwhile, JPMorgan has just implemented a programmable payment functionality specifically designed for institutional customers of their private blockchain network.

The programmable payments functionality has been made available to all institutional clients, enabling the execution of real-time, programmable treasury operations and the development of novel digital business models.

The first institutional client to utilize the programmable payments capability is Siemens AG, a German tech company that demonstrated its use as recently as November 6. Before the conclusion of 2023, FedEx and Cargill are anticipated to utilize the solution as well.

(This site’s content should not be construed as investment advice. Investing involves risk. When you invest, your capital is subject to risk).

Featured image from AdWeek

Read More
Blockchain

Ethereum Price Trims Gains – These Factors Could Trigger Fresh Increase

Ethereum price started a downside correction and traded below $2,000. ETH must stay above $1,920 to start a fresh increase in the near term.

Ethereum is correcting gains and testing the $1,920 support zone.
The price is trading below $2,000 and the 100-hourly Simple Moving Average.
There is a key bearish trend line forming with resistance near $2,000 on the hourly chart of ETH/USD (data feed via Kraken).
The pair could start a fresh increase if it clears the $2,000 resistance zone in the near term.

Ethereum Price Holds Key Support

After struggling to clear the $2,120 resistance, Ethereum price started a downside correction like Bitcoin. ETH traded below the $2,050 and $2,000 support levels.

However, the bulls were active above the $1,920 support zone. A low was formed near $1,933 and the price is now consolidating losses. It is trading near the 23.6% Fib retracement level of the recent drop from the $2,118 swing high to the $1,933 low.

Ethereum is now trading below $2,000 and the 100-hourly Simple Moving Average. Immediate resistance is near the $2,000 zone. There is also a key bearish trend line forming with resistance near $2,000 on the hourly chart of ETH/USD.

The next major resistance sits at $2,025 or the 100-hourly Simple Moving Average or the 50% Fib retracement level of the recent drop from the $2,118 swing high to the $1,933 low. A close above the trend line and $2,025 could start a decent increase.

Source: ETHUSD on TradingView.com

The next key resistance is near $2,075, above which the price could aim for a move toward the $2,120 barrier. Any more gains could start a wave toward the $2,250 level.

More Losses in ETH?

If Ethereum fails to clear the $2,000 resistance and the trend line, it could start a fresh decline. Initial support on the downside is near the $1,950 level.

The next key support is $1,920. A downside break below the $1,920 support might start a sharp decline. In the stated case, Ether could drop toward the $1,850 support zone in the near term. Any more losses might call for a drop toward the $1,800 level.

Technical Indicators

Hourly MACDThe MACD for ETH/USD is losing momentum in the bearish zone.

Hourly RSIThe RSI for ETH/USD is now below the 50 level.

Major Support Level – $1,920

Major Resistance Level – $2,025

Read More
Blockchain

XRP Price Prediction – Breaking This Resistance Could Spark Fresh Rally

XRP price started a downside correction from the $0.750 zone. The price retested the $0.600 support zone and might soon attempt a fresh rally.

XRP started a downside correction from the $0.750 resistance zone.
The price is now trading below $0.650 and the 100 simple moving average (4 hours).
There is a major bearish trend line forming with resistance near $0.6550 on the 4-hour chart of the XRP/USD pair (data source from Kraken).
The pair might correct further lower, but the bulls could remain active near $0.600.

XRP Price Dips Below $0.650

After rallying above the $0.720 resistance, XRP faced resistance. The price struggled to clear the $0.750 barrier and recently started a downside correction, like Bitcoin and Ethereum.

The price declined below the $0.720 and $0.700 support levels. The bears even pushed it below the $0.650 pivot level. However, the bulls were active near the $0.600 zone. A low is formed near $0.5938 and the price is now attempting a fresh increase.

XRP is now trading below $0.650 and the 100 simple moving average (4 hours). There is also a major bearish trend line forming with resistance near $0.6550 on the 4-hour chart of the XRP/USD pair.

On the upside, immediate resistance is near the $0.630 level or the 23.6% Fib retracement level of the recent decline from the $0.7499 swing high to the $0.5938 low. The first major resistance is near the $0.640 zone or the trend line.

Source: XRPUSD on TradingView.com

A close above the trend line could send the price toward the $0.672 resistance. It is near the 50% Fib retracement level of the recent decline from the $0.7499 swing high to the $0.5938 low. If the bulls remain in action above the $0.672 resistance level, there could be a rally toward the $0.750 resistance. Any more gains might send XRP toward the $0.788 resistance.

Are Dips Limited?

If XRP fails to clear the $0.640 resistance zone, it could continue to move down. Initial support on the downside is near the $0.620 zone.

The next major support is at $0.600. If there is a downside break and a close below the $0.600 level, XRP price might accelerate lower. In the stated case, the price could retest the $0.540 support zone.

Technical Indicators

4-Hours MACD – The MACD for XRP/USD is now losing pace in the bullish zone.

4-Hours RSI (Relative Strength Index) – The RSI for XRP/USD is now below the 50 level.

Major Support Levels – $0.620, $0.600, and $0.540.

Major Resistance Levels – $0.630, $0.640, and $0.672.

Read More
Blockchain

Is Buying FTT Now A Once-In-A-Life Opportunity For FTX Believers?

FTT, the native token of the FTX ecosystem, rallied by 180% last week, emerging as one of the top performers. The rally, Kaiko, a blockchain analytics platform observes, was primarily due to comments by the stringent United States Securities and Exchange Commission (SEC) leader that the FTX 2.0 relaunch is possible. 

FTT Soaring On Hopes Of FTX Relaunching

In an X post on November 14, Kaiko also notes that related FTT trading volume soared, signaling possible accumulation by traders and believers of FTX. At spot rates, FTT trading volume, looking at how the token performs in Binance, one of the leading cryptocurrency exchanges, remains elevated at November 2022 levels. 

In November 2022, FTX, led by Sam Bankman-Fried, filed for Chapter 11 bankruptcy protection at the United States Bankruptcy Court for the District of Delaware.

Related Reading: BlackRock’s XRP ETF Filing, Everything You Need To Know

Before this bankruptcy filing, FTT, which served several purposes in the FTX ecosystem, acting as a governance token and providing access, plunged in early November following allegations that the exchange had misappropriated user funds. There was a significant collapse on November 8 when FTT fell by 90%, taking the coin from around $22 to as low as $2.

FTT is trading at around $3.22, up 232% from October 2023 lows, looking at the performance in the daily chart. As fundamental events around FTX unfold, FTT’s trading volume also rises.

Compliance With The Law Is Crucial: SEC Chairperson

There could be more gains for FTX in the days ahead should there be more solid news of an FTX 2.0 relaunch following Gary Gensler’s comments last week. Then, Gensler told CNBC that a revived FTX could see the light of day if only leaders taking over clearly understood existing laws.  

The SEC chairperson’s comments follow speculations that the former New York Stock Exchange (NYSE) president, Tom Farley, is among the three bidders planning to buy FTX. 

“If Tom or anybody else wanted to be in this field, I would say, ‘Do it within the law. Build investors’ trust in what you’re doing and ensure that you’re doing the proper disclosures — and also that you’re not commingling all these functions, trading against your customers. Or using their crypto assets for your purposes.” 

A jury in early November found Sam Bankman-Fried, the former CEO of FTX, guilty of all criminal charges, including wiring fraud and money laundering. Bankman-Fried is set for sentencing in March 2024.

Read More
Blockchain

Crypto Analyst Reveals 10 Top Altcoins To Watch This Week

The altcoins market has recently witnessed a resurgence of interest and confidence, primarily driven by the largest cryptocurrency, Bitcoin (BTC). This renewed enthusiasm has resulted in a bull uptrend, with most of the top 100 cryptocurrencies benefiting from Bitcoin’s resurgence. 

However, the market is currently experiencing a correction as Bitcoin and Ethereum (ETH) face pullbacks after failed attempts to breach upper resistance lines. Despite this correction, crypto analyst Miles Deutscher shares insights and highlights several altcoins with potentially significant gains.

SOL Emerges As Safe Haven In Crypto Market Correction

Solana has exhibited remarkable growth, even as the broader market experiences a correction. With a 0.5% gain in the past 24 hours, SOL’s potential for further upside cannot be ignored. 

Deutscher suggests that SOL may continue to benefit from the ongoing rotation of investments from other Layer-1 solutions like Avalanche (AVAX) and Fantom (FTM).

Thorchain (RUNE) has been on an impressive upward trajectory, prompting investors to consider buying on deep corrections and wicks. The primary decentralized exchange (DEX) on Thorchain, THOR, has also shown positive movement, further bolstering the growth potential.

Polygon (MATIC) has recently shown signs of strength and has generated whispers within the crypto community about a potential zero-knowledge (ZK) narrative. If this narrative materializes, MATIC, a leader in the space, could attract significant positive flows. 

Within the ZK narrative, altcoins like Dusk Network (DUSK), Loopring (LRC), and Mina Protocol (MINA) are poised to benefit. Deutscher believes that each altcoin offers unique strengths and value propositions, and their performance will depend on the strength of the emerging ZK narrative.

Soteria (SEI) has gained attention as it enters the top 10 for volume traded by pairs on Upbit. Considered a “new coin,” SEI exhibits fundamentals similar to the next altcoin on the watchlist.

Tidal Finance (TIA) is a relatively new token similar to the early days of Aptos (APT). The market tends to favor new and innovative tokens, and although TIA’s rally may have started to cool off, it still holds explosive potential. With a current market capitalization of $700 million, TIA remains an intriguing opportunity for investors.

DEX And Gaming Altcoins Poised To Thrive

In addition to altcoins, perp decentralized exchange (DEX) tokens like GMX, DYDX, and Gnosis (GNS) are positioned to benefit from market volatility.

According to Deutscher, these tokens have shown a correlation between price movements and fundamental factors. If volatility persists, these tokens could present favorable medium-term investment opportunities.

Yield Guild Games (YGG) and Gamestarter (GMT), gaming tokens with initial upward movements, are expected to continue outperforming the broader market. These gaming tokens could witness sustained growth with the YGG conference scheduled for November 18.

While the current correction in the cryptocurrency market has led to pullbacks in Bitcoin and Ethereum, the altcoin landscape still offers potential opportunities for investors. 

Solana’s continued uptrend, along with the prospects of altcoins like Thorchain, Polygon, and those associated with the ZK narrative, suggest possible avenues for growth. Additionally, emerging tokens like Soteria and Tidal Finance, perp DEX tokens, and gaming tokens may also provide favorable investment prospects. 

(This site’s content should not be construed as investment advice. Investing involves risk. When you invest, your capital is subject to risk).

Featured image from Shutterstock, chart from TradingView.com 

Read More
Blockchain

Bitcoin Price Takes Hit Despite Drop in US CPI But Bulls Still In Control

Bitcoin price declined below the $36,000 zone. BTC tested the $34,650 support zone and is currently consolidating losses near $35,500.

Bitcoin declined heavily after the US CPI declined more than expected.
The price is trading below $36,500 and the 100 hourly Simple moving average.
There is a key bearish trend line forming with resistance near $36,050 on the hourly chart of the BTC/USD pair (data feed from Kraken).
The pair could trade in a range before the bulls attempt a new increase in the near term.

Bitcoin Price Revisits Key Support

Bitcoin price failed to surpass the $37,500 resistance. BTC started a fresh decline from the $37,423 high and declined below many supports. There was a move below the $36,000 and $35,500 levels. The price even spiked below $35,000.

It retested the $34,650 support zone. A low was formed near $34,666 and the price is now correcting losses. There was a move above the $35,000 level. The price climbed above the 23.6% Fib retracement level of the recent drop from the $37,423 swing high to the $34,666 low.

Bitcoin is now trading below $36,500 and the 100 hourly Simple moving average. There is also a key bearish trend line forming with resistance near $36,050 on the hourly chart of the BTC/USD pair.

On the upside, immediate resistance is near the $35,680 level. The next key resistance could be near $36,000 or the trend line. The trend line is close to the 50% Fib retracement level of the recent drop from the $37,423 swing high to the $34,666 low.

Source: BTCUSD on TradingView.com

The first major resistance is near $36,780, above which the price might accelerate further higher. In the stated case, it could test the $37,000 level. Any more gains might send BTC toward the $37,500 level, above which the price could gain bullish momentum and rally toward $38,000.

More Losses In BTC?

If Bitcoin fails to rise above the $36,000 resistance zone, it could continue to move down. Immediate support on the downside is near the $35,150 level.

The next major support is $35,000. If there is a move below $35,000, there is a risk of more downsides. In the stated case, the price could drop toward the key support at $34,650 in the near term.

Technical indicators:

Hourly MACD – The MACD is now losing pace in the bearish zone.

Hourly RSI (Relative Strength Index) – The RSI for BTC/USD is now below the 50 level.

Major Support Levels – $35,150, followed by $34,650.

Major Resistance Levels – $36,000, $36,780, and $37,000.

Read More