Crypto Corner Café

Taste The Future

Blockchain

Blockchain

Ethereum: Balancing Act At $2,300 – Scaling The Heights Or Facing A Looming Drop?

The past few weeks have been a rollercoaster ride for Ethereum. Buoyed by a waning Bitcoin dominance and an influx of traders seeking greener pastures, Ethereum’s price surged towards critical resistance levels near $2,500.

Yet, a palpable anxiety lingers in the air, fueled by questions about Ethereum’s long-term scalability and the increasing chorus of bearish whispers. Can the second-largest crypto navigate this tightrope walk and reclaim its DeFi crown, or will it take a tumble from grace?

Ethereum Rises: Growth, Innovations, And Challenges

Beneath the surface of rising price charts lies a complex story of intertwined strengths and weaknesses. Ethereum’s impressive 87% year-on-year market cap surge, catapulting it from $140 billion to a hefty $267 billion, paints a picture of robust growth.

The Merge upgrade, a landmark event streamlining Ethereum’s blockchain, and the burgeoning DeFi ecosystem pulsating with innovative applications are key contributors to this ascent.

However, lurking beneath this facade is a critical bottleneck: Ethereum’s Layer 1 scalability limitations. The network’s notorious high transaction fees and sluggish throughput have become thorns in the side of DeFi expansion, frustrating both users and developers yearning for a smoother experience.

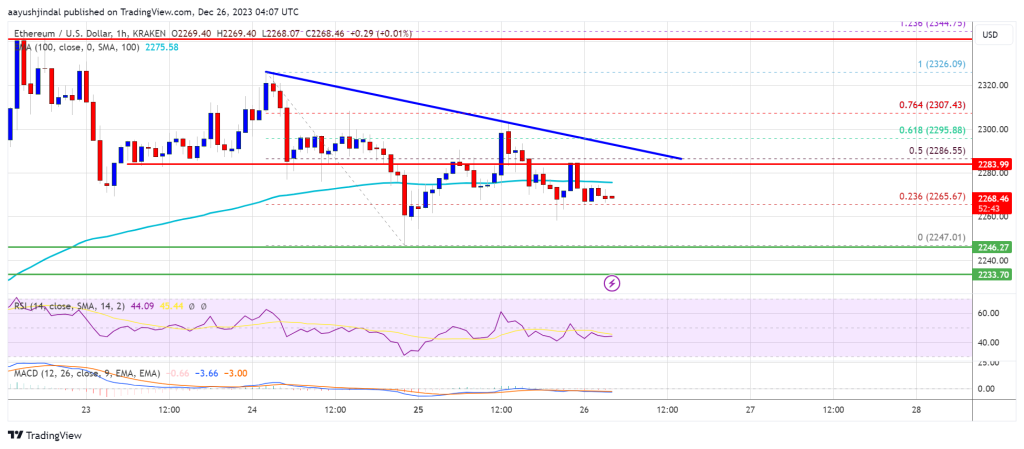
As of writing, on this 26th of December, Ethereum’s price hovers around $2,233, painting the daily and weekly charts red with a dip of roughly 1.5%, data from Coingecko shows. This recent descent adds further intrigue to the complex dance Ethereum is performing near the critical $2,500 resistance level.

This delicate dance between bullish aspiration and bearish pressure underscores the fragile equilibrium in the market. On one hand, the optimism surrounding Ethereum’s future potential continues to draw in traders.

On the other hand, the specter of high transaction fees and scalability woes, alongside whispers of a potential bear market, keeps selling pressure simmering just below the surface.

Ethereum At $2,300: Bulls’ Battle, Bears’ Threats

For Ethereum bulls, the $2,300 level is a crucial battleground. If they can muster enough buy-side force to sustain a climb above this mark, it could pave the way for a surge towards the coveted $2,500 resistance level. This breakthrough would be a significant psychological victory, injecting fresh confidence into the market and potentially triggering a new upward trend phase.

However, the bears are not out for the count. Their sights are set on breaching the $2,200 support level, which would solidify their grip and potentially trigger a more substantial decline. Should this scenario unfold, the $2,000 mark could come into play, with further losses possible if selling pressure remains unchecked.

Adding to the intrigue is the factor of exchange supply. A recent increase in Ethereum tokens on exchanges indicates more readily available ETH for sellers, potentially amplifying downward pressure. This highlights the delicate balance between market sentiment and technical factors in determining Ethereum’s future trajectory.

Meanwhile, the ETH traders’ profit-taking is evident in the Network Realized Profit/Loss between October 31 and December 23. A significant amount of profit-taking may cause the price of ETH to decline.

Ethereum’s Critical Crossroads Ahead

Looking ahead, Ethereum’s path hinges on its ability to navigate this complex landscape. Addressing its scalability issues through Layer 2 solutions and potential future upgrades will be crucial for maintaining and expanding its DeFi dominance.

Rekindling developer and user confidence by reducing transaction fees and improving network throughput is also paramount. Only by tackling these internal challenges and adapting to the ever-evolving crypto sphere can Ethereum truly reclaim its throne as the king of DeFi.

The next few weeks are likely to be pivotal for Ethereum. Will it scale the $2,500 height and cement its position as a leader in the crypto revolution? Or will internal limitations and external pressures force it to face a precipitous drop?

Featured image from Shutterstock

Read More
Blockchain

Harmony To See Redemption? Analyst Predicts Meteoric 650% Rise For ONE Token

The Harmony blockchain fell victim to one of the most infamous hacks in decentralized finance (DeFi) history and the fallout from that attack in 2022 saw the ONE price tank tremendously, losing over 98% of its all-time high value. However, one year later, the cryptocurrency seems to be making a comeback as investors and traders flip bullish once again.

Crypto Analyst Predicts Great Things For ONE Token

Crypto analyst Alan Santana has shared an analysis of the ONE token, the native cryptocurrency of the Harmony blockchain. In this analysis that focuses on one of the forgotten giants from the DeFi summer of 2021, Santana paints a rather bullish picture, the kind that hasn’t been shared for a while now.

The analysis focuses on the ONE/BTC pair which shows great promise compared to the ONE/USDT pair. This comes after the coin hit a new low of $0.008 this year, before rebounding, and this rebound seems to be the basis of its bullish trend.

Santana explained that this particular growth had begun in October and has so far sustained given that the price is up more than 100% since then. However, the way forward is still not completely clear as t

he crypto analyst points out that while the cryptocurrency has been able to break above its 200-day moving average (MA), it is now facing even more resistance. This resistance is now prominent at the 300-day exponential moving average (EMA).

With the resistance moving upward, support for the coin has formed at the EMA200, proving to be an important level for the coin. From this level, a break above the EMA300 is actually what is needed for the altcoin to confirm its breakout from here.

Santana posits that when this break happens, it’ll confirm the long-term growth potential for the ONE price. At this point, trading volume is expected to soar “and the daily sessions/candles become really big,” the analyst explains.

Harmony Price Performance

There are multiple price targets outlined by the crypto analyst for when the Harmony price does break the EMA300. From the current $0.02 level is an expected initial 650% jump right above $0.14 which starts it on its long-term bullish journey.

Related Reading: Solana Breaks New Record, Will This Send SOL Price To $200?

From there, the next target is placed at $0.16 which is an 850% move from the current trading levels. However, it doesn’t end there with a third target placed right above $0.33 which would complete the move. This last target would translate to a 1,400% increase.

On its own, the ONE token is performing quite well considering the circumstances surrounding it. CoinMarketCap data shows that its price is up 5.56% in the last day, 40.5% in the last week, and 54.2% in the last month.

Read More
Blockchain

Looking Deeper: Can ATOM Sustain Its 13% Surge Beyond The Network Buzz?

ATOM has ascended to the summit of network activity within the inter-Blockchain ecosystem. However, upon closer inspection, the narrative surrounding Cosmos unveils a more nuanced story. Despite the accolade of being at the forefront of blockchain network activity, a discerning analysis reveals a dip in actual user engagement and transaction volumes.

Surprisingly, against the backdrop of these statistics, Cosmos has witnessed a remarkable 13% surge in its token price over the past week, prompting a deeper inquiry into the factors propelling its momentum.

Digging Deeper: Beyond Buzzwords

Although Cosmos received accolades for its network activity, the narrative quickly unravels when scrutinizing actual user statistics. Daily Active Addresses and Transactions for ATOM,  tracked by Artemis, experienced a noticeable decline, painting a different picture than the headline numbers suggest. Similarly, fees and revenue for the Cosmos network dipped during this period, further dampening the celebratory mood.

Despite the declining activity metrics, ATOM’s price defied the trend, showcasing a 6% gain over the last 24 hours, data from Coingecko shows. This disconnect highlights the influence of factors beyond user engagement, including the broader market bullishness and potentially, speculation fueled by a spike in ATOM’s MVRV ratio, a profitability indicator.

The Power Of Partnerships And Policy: Catalysts For Growth

While the overall market sentiment played a role, key developments within the Cosmos ecosystem also contributed to ATOM’s ascent. The recent merger between Osmosis and UX Chain solidified their foothold within the Cosmos landscape, bolstering cross-chain DeFi capabilities.

Additionally, the Cosmos Hub’s governance decision to reduce ATOM’s inflation rate from 14% to 10% addressed concerns surrounding stability and security, potentially attracting further investment.

Despite the recent rally, ATOM’s technical indicators paint a somewhat cautious picture. The daily chart presents a bearish MACD signal, and the Chaikin Money Flow’s sideways movement suggests a potential extension of the current price consolidation.

The Road Ahead: A Balancing Act

Cosmos faces the challenge of bridging the gap between headline-grabbing network activity metrics and actual user engagement. The recent decline in transactions and addresses raises questions about long-term sustainability. Nevertheless, the ecosystem’s strategic partnerships, focus on DeFi integration, and proactive governance decisions provide promising counterpoints.

As the new year approaches, ATOM’s trajectory will likely hinge on its ability to address user-centric metrics while leveraging its strategic alliances and proactive governance. Whether it can translate its headline dominance into sustained user engagement and price growth remains to be seen.

As Cosmos (ATOM) revels in its recent ascent to the peak of network activity within the inter-blockchain ecosystem, the question looms: can this momentum be sustained beyond the current buzz? The enigma surrounding Cosmos deepens as its 13% surge in value defies conventional metrics, prompting a cautious examination of the factors at play.

Featured image from Shutterstock

Read More
Blockchain

NEAR: 3 Reasons This Crypto Is Up 80% While Others Hibernate In The Run-Up To 2024

In the prevailing bearish backdrop of the broader cryptocurrency market, NEAR Protocol (NEAR) emerges as a noteworthy exception, showcasing remarkable resilience and defying the prevailing downtrend. Its trajectory has been one of sustained upward momentum, a trend that notably took root around mid-December and has continued to gather strength.

Unlike the general market sentiment characterized by a downturn, NEAR has not only weathered the storm but has surged impressively. Over the last seven days, the cryptocurrency has experienced a significant 80% increase in value, a feat that has not gone unnoticed by market participants and enthusiasts alike.

This surge has effectively propelled NEAR to double its base value, which stood at $4.24, signaling a robust and impressive performance in contrast to the prevailing market conditions.

Here are three reasons why this token is thawing in the run-up to 2024:

NEAR: Technical Resilience

NEAR’s upward trajectory is not a mere coincidence but is supported by robust technical indicators. A decisive price breakout on December 21st shattered a crucial resistance level at $4.0, paving the way for sustained growth.

This breakout generated warmth for further price appreciation. Furthermore, an ascending trendline, currently positioned at $3.7, acts as a reliable support against potential downward movements.

The Average Directional Index (ADX) at 40% signals potential buyer exhaustion but also indicates a healthy correction for long-term bullishness, portraying an enduring technical strength that is not easily extinguished.

Community Momentum

NEAR’s success is not a solitary achievement; it is a result of a thriving community. The trading volume has surged impressively by 170% over the past week, reaching over $410 million on December 25th alone.

This surge in trading activity underscores the growing investor confidence. Open Interest (OI), representing future buying potential, has also surpassed $140 million, reflecting a shared optimism that NEAR’s flame is burning bright.

This fervent belief adds fuel to the fire, attracting a considerable number of new participants—over 48,000 in the past week—drawn to the warmth of the NEAR ecosystem.

Future Roadmap

Looking ahead, NEAR’s future appears ablaze with ambitious plans outlined in its 2024 development roadmap. These plans include high-speed transactions exceeding 100,000 per second, enhanced scalability to eliminate bottlenecks, and the introduction of innovative dApps like Nightshade 2.0, promising enhanced privacy and security.

These developments solidify NEAR’s position as a frontrunner in the crypto space, leaving competitors in the shadows and envying its progress.

NEAR’s ability to withstand the challenges of the current market makes it a beacon of hope for investors seeking both warmth and growth. As market conditions gradually improve, NEAR is poised to breach the $5 barrier, representing a potential 30% increase from its current price.

This outlook is likely to attract those yearning to escape the chill of the crypto winter, further cementing NEAR’s position as a noteworthy player in the evolving crypto landscape.

Featured image from Shutterstock

Read More
Blockchain

Ethereum Price Relatively Muted But Approaches Crucial Breakout

Ethereum price is consolidating gains below the $2,350 resistance zone. ETH could revisit the $2,200 support before it starts a fresh increase.

Ethereum is still holding gains above the $2,250 support zone.
The price is trading below $2,280 and the 100-hourly Simple Moving Average.
There is a connecting bearish trend line forming with resistance near $2,290 on the hourly chart of ETH/USD (data feed via Kraken).
The pair could extend its decline and revisit the $2,200 support zone.

Ethereum Price Remains In A Range

Ethereum price started a downside correction from the $2,350 level. ETH declined below the $2,320 and $2,300 levels. It even spiked below the $2,250 level.

A low was formed near $2,247 and the price is now attempting a fresh increase, like Bitcoin. There was a move above the $2,265 level. The price climbed above the 23.6% Fib retracement level of the downward move from the $2,327 swing high to the $2,247 low.

Ethereum is now trading below $2,280 and the 100-hourly Simple Moving Average. On the upside, the price is facing resistance near the $2,290 level. There is also a connecting bearish trend line forming with resistance near $2,290 on the hourly chart of ETH/USD.

The trend line is close to the 50% Fib retracement level of the downward move from the $2,327 swing high to the $2,247 low. A close above the $2,290 resistance could send the price toward $2,320.

Source: ETHUSD on TradingView.com

The main resistance sits at $2,350. A clear move above the $2,350 zone could start a major increase. The next resistance sits at $2,420, above which Ethereum might rally and test the $2,550 zone.

More Losses in ETH?

If Ethereum fails to clear the $2,290 resistance, it could start a fresh decline. Initial support on the downside is near the $2,250 level.

The first key support could be the $2,220 zone. A downside break and a close below $2,220 might spark more bearish moves. In the stated case, Ether could revisit the $2,120 support. Any more losses might send the price toward the $2,040 level.

Technical Indicators

Hourly MACDThe MACD for ETH/USD is losing momentum in the bullish zone.

Hourly RSIThe RSI for ETH/USD is now below the 50 level.

Major Support Level – $2,220

Major Resistance Level – $2,290

Read More
Blockchain

XRP Price Regains Strength As The Bulls Aim For 10% Surge

XRP price is moving higher from the $0.578 support. The price seems to be setting up for a fresh surge toward the $0.680 and $0.700 levels.

XRP is attempting a fresh increase from the $0.578 support level.
The price is now trading above $0.620 and the 100 simple moving average (4 hours).
There is a key rising channel forming with resistance near $0.650 on the 4-hour chart of the XRP/USD pair (data source from Kraken).
The pair start a fresh rally if it clears the $0.650 and $0.655 resistance levels.

XRP Price Could Surge To $0.70

After forming a base near the $0.578 zone, XRP price started a decent increase. There was a move above the $0.595 and $0.600 resistance levels. The price even cleared the $0.630 resistance.

There was a spike above the 50% Fib retracement level of the downward move from the $0.700 swing high to the $0.578 swing low. The price is now up over 3%, outperforming Bitcoin and Ethereum. It is now facing resistance near the $0.650 zone.

There is also a key rising channel forming with resistance near $0.650 on the 4-hour chart of the XRP/USD pair. The channel resistance is near the 61.8% Fib retracement level of the downward move from the $0.700 swing high to the $0.578 swing low.

The price is now trading above $0.630 and the 100 simple moving average (4 hours). On the upside, immediate resistance is near the $0.650 zone. The next major resistance is near the $0.655 zone. A close above the $0.655 resistance zone could spark a strong increase.

Source: XRPUSD on TradingView.com

The next key resistance is near $0.684. If the bulls remain in action above the $0.684 resistance level, there could be a rally toward the $0.700 resistance. Any more gains might send the price toward the $0.720 resistance.

Fresh Decline?

If XRP fails to clear the $0.650 resistance zone, it could start a fresh decline. Initial support on the downside is near the $0.620 zone and the channel trend line.

The next major support is at $0.606. If there is a downside break and a close below the $0.606 level, XRP price might accelerate lower. In the stated case, the price could retest the $0.578 support zone.

Technical Indicators

4-Hours MACD – The MACD for XRP/USD is now gaining pace in the bullish zone.

4-Hours RSI (Relative Strength Index) – The RSI for XRP/USD is now above the 50 level.

Major Support Levels – $0.620, $0.606, and $0.578.

Major Resistance Levels – $0.650, $0.655, and $0.700.

Read More
Blockchain

Bitcoin Price Eyes Fresh Bullish Breakout, Can BTC Make It To $45K?

Bitcoin price corrected gains and tested the $42,650 zone. BTC is again attempting a fresh increase and eyeing a move above the $43,750 resistance.

Bitcoin found support above the $42,500 zone and started a fresh increase.
The price is trading below $43,550 and the 100 hourly Simple moving average.
There is a connecting bearish trend line forming with resistance near $43,600 on the hourly chart of the BTC/USD pair (data feed from Kraken).
The pair could start a fresh increase if it clears the $43,750 and $44,300 resistance levels.

Bitcoin Price Holds Ground

Bitcoin price failed to clear the $44,300 resistance zone and started a downside correction. BTC declined below $43,500 level, but the bulls were active above the $42,500 zone.

A low was formed near $42,860 and the price is now attempting a fresh increase. There was a move above the $43,200 resistance zone. The price climbed above the 50% Fib retracement level of the downward move from the $44,429 swing high to the $42,680 low.

Bitcoin is still trading below $43,550 and the 100 hourly Simple moving average. There is also a connecting bearish trend line forming with resistance near $43,600 on the hourly chart of the BTC/USD pair.

The trend line is close to the 61.8% Fib retracement level of the downward move from the $44,429 swing high to the $42,680 low. On the upside, immediate resistance is near the $43,550 level. The first major resistance is forming near the trend line.

Source: BTCUSD on TradingView.com

A close above the $43,600 resistance could start a decent move toward the $44,300 level. The next key resistance could be near $45,000, above which BTC could rise toward the $46,500 level. Any more gains might send the price toward $47,200.

Another Decline In BTC?

If Bitcoin fails to rise above the $43,600 resistance zone, it could start a fresh decline. Immediate support on the downside is near the $43,000 level.

The next major support is near $42,600. If there is a move below $42,600, there is a risk of more losses. In the stated case, the price could drop toward the $42,000 support in the near term.

Technical indicators:

Hourly MACD – The MACD is now losing pace in the bearish zone.

Hourly RSI (Relative Strength Index) – The RSI for BTC/USD is now near the 50 level.

Major Support Levels – $43,000, followed by $42,600.

Major Resistance Levels – $43,600, $44,000, and $44,300.

Read More
Blockchain

Polygon Founder Recaps 2023: MATIC’s Surge Powers Through Resistance With 4% Uptrend

Polygon is closing out 2023 on a high note as its native token, MATIC, experienced a significant surge over the past 24 hours, despite its founder highlighting a “painful ride”.

MATIC’s current price stands at $0.8939, accompanied by a 24-hour trading volume of $701,503,128.22. This represents a notable 4.20% price increase within the last 24 hours and a remarkable 14.10% increase over the past 7 days.

Polygon Founder Embraces Underdog Status

Despite a challenging journey throughout 2023, Polygon’s founder, Sandeep Nailwal, recently expressed his contentment with the platform’s underdog status. In a statement on X (formerly Twitter), Nailwal stated:

Polygon is back to where it’s the best at being an underdog. Not going to lie, it’s been a painful ride, the whole of 2023, but right now, it feels incredibly liberating to be the underdog again.

Furthermore, Nailwal went on to outline several reasons why he believes investors should feel bullish about Polygon’s prospects. 

One key feature is Ethereum Virtual Machine (EVM) Compatibility, which allows Polygon to replicate the Ethereum environment as a rollup. This compatibility ensures that any application running on Ethereum or other EVM-compatible chains can be deployed onto zkEVM, Polygon’s layer 2 solution, with minimal modifications.

Another aspect highlighted is the utilization of Zero-Knowledge Proofs (ZKPs) for transaction validation. By leveraging ZKPs, Polygon enhances transaction speeds and reduces gas fees, addressing critical pain points experienced by users on other blockchain platforms.

Scalability is a paramount concern in the blockchain industry, and Polygon aims to address this challenge by executing smart contracts using zero-knowledge technology. 

This approach ensures “scalability without compromising decentralization” and security, bolstering the platform’s overall appeal to developers and users alike.

Moreover, Polygon’s strategic affiliation with zkEVM positions it to leverage the existing ecosystem of over 400 decentralized applications (dApps) within the Polygon network. 

This ecosystem includes a diverse range of DeFi protocols, gaming platforms, and NFT marketplaces. By capitalizing on this thriving ecosystem, Polygon aims to further solidify its position as a leader in the blockchain space.

Midterm Targets And Strategy For MATIC Price Action

Renowned analyst Captain Faibik has released a comprehensive analysis of the price action for Polygon’s native token, MATIC. In his assessment, Captain Faibik identifies key targets and a strategic approach for investors to capitalize on potential gains.

According to Captain Faibik’s analysis, MATIC’s midterm targets are projected at $1.20, $1.60, $2.50, and $4.00. These targets represent potential price levels that MATIC could reach based on historical patterns. 

Notably, to manage risk and protect their investment, Captain Faibik recommends implementing a stop-loss strategy. If the weekly closing price of MATIC falls below $0.55, it is suggested to exit the position.

Furthermore, Captain Faibik advises investors to adopt a long-term mindset and hold their MATIC investment for a minimum of 60 days. This holding period enables investors to ride out short-term price fluctuations and potentially capitalize on the projected targets identified.

Featured image from Shutterstock, chart from TradingView.com

Read More
Blockchain

Polkadot Shows Bearish Signal, Analyst Predicts Drawdown To This Target

A cryptocurrency analyst has explained how Polkadot could potentially see a decline to this level because of a sell signal in in its weekly price chart.

Polkadot Weekly Price Has Formed A TD Sequential Sell Setup Recently

In a new post on X, analyst Ali has pointed out that a TD Sequential sell signal has been forming for Polkadot recently. The “TD Sequential” refers to a tool in technical analysis that’s generally used for pinpointing likely points of reversal in any asset’s price.

The indicator is made up of two phases. In the first phase, called the setup, candles of the same polarity are counted up to 9. After the ninth candle, a probable reversal in the price may be assumed to have taken place.

If the setup’s completion occurred with the overall trend being towards the up (that is, the nine candles were green), the asset might have hit a top. Similarly, a bottom could be in if the price had been going down.

The second phase, known as the “countdown,” begins right after the setup’s completion and lasts for thirteen candles. At the end of these thirteen candles, another probable reversal in the asset could be assumed to have occurred.

Recently, Polkadot’s weekly price has completed a TD Sequential phase of the former type, as the chart below shared by the analyst shows.

As is apparent from the graph, the Polkadot weekly price has finished the TD Sequential setup phase with green candles recently. This could suggest that a sell signal has now formed for the cryptocurrency.

In the same chart, Ali has also displayed the data for the 100-day exponential moving average (EMA) for the asset, a level that has been a source of resistance in the past.

Interestingly, this TD Sequential setup has completed just as the weekly price of the cryptocurrency has approached the 100-day EMA. “This could lead to a spike in profit-taking, potentially driving DOT down to $7.50,” explains the analyst. From the current spot price, a drawdown to this level would mean a drop of more than 18% for Polkadot.

DOT Is Up Almost 3% During The Last 24 Hours

While these bearish developments have occurred in the weekly price of DOT, the asset has still continued to rise during the past day, as its price has now cleared the $9.2 level.

Below is a chart that shows how Polkadot has performed during the past month.

The green returns during the last 24 hours are a continuation of the bullish momentum that DOT has enjoyed in the past week, a window inside which it’s now up almost 39%.

Though the asset has been able to continue this run for now, the technical obstacles it’s facing in terms of the TD Sequential and 100-day EMA could mean that the top might be near for the coin.

Read More
Blockchain

Dogecoin, Cardano, And Chainlink Get Special Listing From Binance

Binance is on the move once again with new special listings for Dogecoin, Cardano, and Chainlink, among others. The exchange has announced brand new crypto trading pairs for these cryptocurrencies which would bring advantages to traders.

Binance Adds New Dogecoin, Cardano, And Chainlink Pairs

In a new development that was revealed on Christmas Day, the Binance crypto exchange has expanded its list of pairs available for both Cross Margin and Isolated Margin users. The announcement revealed that it will be adding 11 new pairs across these two products.

The new pairs are mainly denominated in the FDUSD pair, a stablecoin that the exchange adopted after Paxos was ordered to stop issuing BUSD tokens. The new pairs in the Cross Margin feature include “ ADA/FDUSD, AEUR/USDT, AVAX/FDUSD, DIA/USDT, DOGE/FDUSD, IOTX/ETH, LINK/FDUSD, MATIC/FDUSD, OM/USDT, POLS/USDT.” Meanwhile, only a single new pair was added to the Isolated Margin feature which is IOTX/ETH.

Binance’s move to add new trading pairs across these products shows a move toward providing further liquidity for traders. “Binance Margin strives to enhance user trading experience by continuously reviewing and expanding the list of trading choices offered on the platform, allowing for greater diversification of user portfolios and flexibility with trading strategies,” the crypto exchange said in the announcement.

The move comes only two days after the exchange had announced the removal of multiple spot trading pairs which affected the likes of Dogecoin, Cardano, and Solana, among others. There were no specific reasons for the removal, although the exchange explained that trading pairs can be delisted due to multiple factors.

Crypto Exchanges Cleaning Up Shop

In the last week, there have been multiple instances of crypto exchanges delisting cryptocurrency pairs from their platform. The most prominent delistings for the week came from the Uphold exchange which delisted a number of cryptocurrencies in an effort to keep up with Canadian regulations.

As Bitcoinist reported, Uphold emailed its customers in the region to reveal that it will be desolating 10 Tier 3 cryptocurrencies from the exchange. Those mentioned in the email included Dogecoin (DOGE), Cardano (ADA), Shiba Inu (SHIB), XDC Network (XDC), Kaspa (KAS), Hedera (HBAR), Stellar (XLM), VeChain (VET), Injective (INJ), and Casper (CSPR). Additionally, the crypto exchange revealed it will be delisting all Tier 4 cryptocurrencies as well.

However, unlike Binance’s delisting which only affected some pairs of different cryptocurrencies, Uphold’s move is a total delisting. “Maintaining a healthy ecosystem of digital assets for our customers is one of our top priorities – occasionally delisting assets forms part of this process,” the exchange said.

Read More