Crypto Corner Café

Taste The Future

Blockchain

Blockchain

Ethereum Price Could Start 2024 With A Strong Increase If It Holds This Support

Ethereum price is correcting gains below the $2,350 zone. ETH could attempt a fresh increase unless there is a close below the $2,200 support.

Ethereum is correcting gains and trading below the $2,350 level.
The price is trading below $2,320 and the 100-hourly Simple Moving Average.
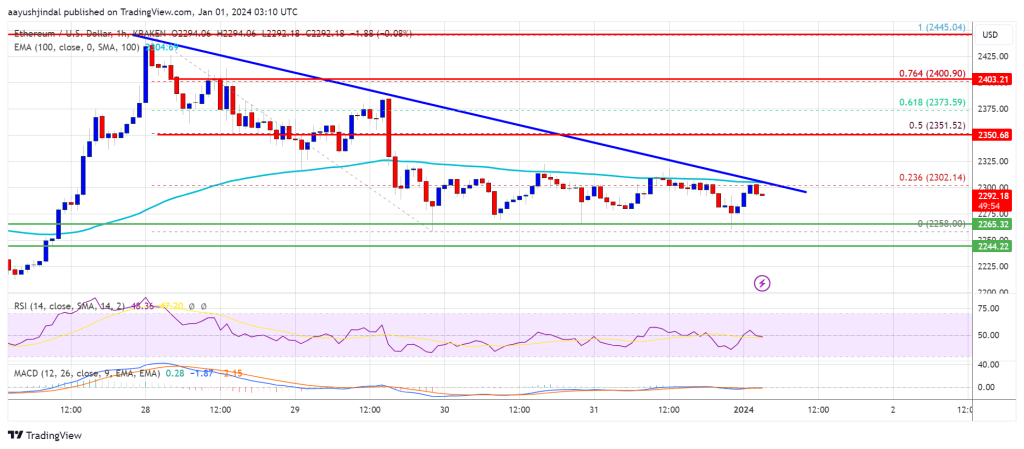
There is a key bearish trend line forming with resistance near $2,300 on the hourly chart of ETH/USD (data feed via Kraken).
The pair could start a fresh increase if there is a close above the $2,350 level.

Ethereum Price Eyes Fresh Increase

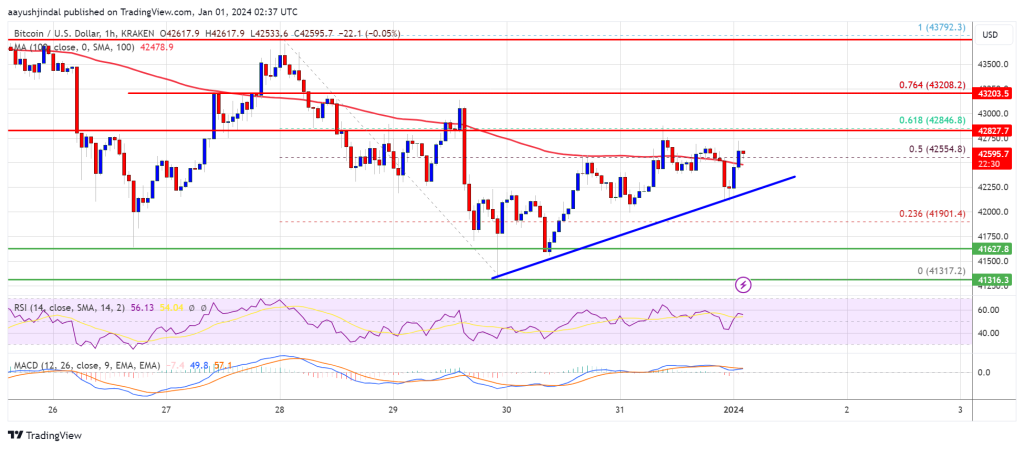
Ethereum price struggled to clear the $2,440 resistance zone and started a fresh decline. ETH declined below the $2,350 support zone to move into a short-term bearish zone, like Bitcoin.

There was a close below the $2,320 level. A low was formed near $2,258 and the price is now consolidating losses. Ethereum is now trading below $2,320 and the 100-hourly Simple Moving Average. There is also a key bearish trend line forming with resistance near $2,300 on the hourly chart of ETH/USD.

On the upside, the price is facing resistance near the $2,300 level and the trend line. It is close to the 23.6% Fib retracement level of the downward move from the $2,445 swing high to the $2,258 low.

Source: ETHUSD on TradingView.com

The first major resistance is now near $2,350 or the 50% Fib retracement level of the downward move from the $2,445 swing high to the $2,258 low. A close above the $2,350 resistance could send the price toward $2,400. The next key resistance is near $2,440. A clear move above the $2,440 zone could start another increase. The next resistance sits at $2,500, above which Ethereum might rally and test the $2,550 zone.

More Losses in ETH?

If Ethereum fails to clear the $2,300 resistance, it could continue to move down. Initial support on the downside is near the $2,250 level.

The first key support could be the $2,240 zone. A downside break and a close below $2,240 might start another major decline. In the stated case, Ether could test the $2,200 support. Any more losses might send the price toward the $2,120 level.

Technical Indicators

Hourly MACDThe MACD for ETH/USD is losing momentum in the bearish zone.

Hourly RSIThe RSI for ETH/USD is now below the 50 level.

Major Support Level – $2,240

Major Resistance Level – $2,350

Read More
Blockchain

Bitcoin Price Starts 2024 In A Range, Can The Bulls Take Over?

Bitcoin price is holding gains above the $41,500 zone. BTC is rising and might gain bullish momentum above the $43,200 resistance zone.

Bitcoin is attempting a fresh increase above the $42,500 resistance zone.
The price is trading above $42,200 and the 100 hourly Simple moving average.
There is a key bullish trend line forming with support near $42,280 on the hourly chart of the BTC/USD pair (data feed from Kraken).
The pair could continue to rise if there is a close above the $43,200 resistance zone.

Bitcoin Price Remains Supported

Bitcoin price declined and broke the $42,200 support zone. BTC formed a base above the $41,200 level and recently started a fresh increase.

A low was formed at $41,317 and the price is now rising. There was a move above the $42,000 resistance zone. The price climbed above the 50% Fib retracement level of the downward move from the $43,792 swing high to the $41,317 low.

Bitcoin is now trading above $42,200 and the 100 hourly Simple moving average. There is also a key bullish trend line forming with support near $42,280 on the hourly chart of the BTC/USD pair.

On the upside, immediate resistance is near the $42,800 level. It is close to the 61.8% Fib retracement level of the downward move from the $43,792 swing high to the $41,317 low. The first major resistance is $43,200. A close above the $43,200 level could send the price further higher.

Source: BTCUSD on TradingView.com

The main hurdle sits at $43,800. A close above the $43,800 resistance could start a decent move toward the $44,500 level. The next key resistance could be near $45,000, above which BTC could rise toward the $46,200 level.

Another Decline In BTC?

If Bitcoin fails to rise above the $43,200 resistance zone, it could start a fresh decline. Immediate support on the downside is near the $42,250 level and the trend line.

The next major support is near $41,620. If there is a move below $41,620, there is a risk of more losses. In the stated case, the price could drop toward the $40,500 support in the near term.

Technical indicators:

Hourly MACD – The MACD is now gaining pace in the bullish zone.

Hourly RSI (Relative Strength Index) – The RSI for BTC/USD is now above the 50 level.

Major Support Levels – $42,250, followed by $41,620.

Major Resistance Levels – $42,800, $43,200, and $43,800.

Read More
Blockchain

Simple Table of Contents Demo Article

[toc]

Simple H1 Title Example

Lorem ipsum dolor sit amet, consectetur adipiscing elit, sed do eiusmod tempor incididunt ut labore et dolore magna aliqua. Sit amet dictum sit amet justo donec enim diam vulputate. Mauris vitae ultricies leo integer malesuada nunc vel risus. Nibh tellus molestie nunc non. Egestas quis ipsum suspendisse ultrices gravida dictum. Orci porta non pulvinar neque. Enim ut sem viverra aliquet eget. Erat nam at lectus urna duis. In iaculis nunc sed augue lacus viverra. Velit sed ullamcorper morbi tincidunt ornare massa eget. Sit amet nisl suscipit adipiscing bibendum. Bibendum at varius vel pharetra vel turpis nunc eget lorem. Id porta nibh venenatis cras sed felis eget. Euismod in pellentesque massa placerat. Et netus et malesuada fames. Massa enim nec dui nunc mattis enim. Est lorem ipsum dolor sit amet consectetur. Tincidunt praesent semper feugiat nibh sed pulvinar.

Simple H2 Title Example

Fringilla phasellus faucibus scelerisque eleifend. Lorem donec massa sapien faucibus et molestie ac. Feugiat nisl pretium fusce id. Lectus nulla at volutpat diam ut venenatis tellus in metus. Fermentum et sollicitudin ac orci. Facilisis leo vel fringilla est ullamcorper eget nulla. Sed arcu non odio euismod lacinia. Quam quisque id diam vel quam. Facilisi morbi tempus iaculis urna id volutpat lacus laoreet non. Tempus urna et pharetra pharetra. Et malesuada fames ac turpis egestas maecenas pharetra convallis posuere. Enim tortor at auctor urna nunc id cursus metus. Dignissim sodales ut eu sem. Interdum consectetur libero id faucibus nisl tincidunt eget nullam non. Egestas pretium aenean pharetra magna ac placerat vestibulum lectus. Amet tellus cras adipiscing enim eu.

Simple H3 Title Example

Platea dictumst vestibulum rhoncus est pellentesque elit ullamcorper dignissim cras. Diam maecenas sed enim ut sem. Leo a diam sollicitudin tempor. Erat velit scelerisque in dictum. Leo urna molestie at elementum eu facilisis sed odio morbi. Eget magna fermentum iaculis eu. Aliquet eget sit amet tellus cras. Mi bibendum neque egestas congue quisque. Pellentesque elit ullamcorper dignissim cras tincidunt lobortis feugiat. Est pellentesque elit ullamcorper dignissim cras tincidunt lobortis feugiat vivamus. In ante metus dictum at tempor commodo ullamcorper a. Semper auctor neque vitae tempus quam pellentesque nec nam. Felis donec et odio pellentesque.

Simple H4 Title Example

Tortor vitae purus faucibus ornare suspendisse. Pharetra vel turpis nunc eget lorem dolor sed viverra. Magna eget est lorem ipsum dolor sit amet. A pellentesque sit amet porttitor eget dolor morbi non arcu. Ut tellus elementum sagittis vitae et leo duis ut. Blandit turpis cursus in hac habitasse platea dictumst quisque. Purus semper eget duis at tellus at urna condimentum mattis. Sagittis aliquam malesuada bibendum arcu. Fringilla est ullamcorper eget nulla facilisi etiam. Faucibus nisl tincidunt eget nullam non. Augue neque gravida in fermentum et sollicitudin ac orci phasellus. Dignissim enim sit amet venenatis urna. Arcu ac tortor dignissim convallis aenean et tortor at risus. Elementum pulvinar etiam non quam. Sem et tortor consequat id porta nibh venenatis cras. Sed id semper risus in hendrerit gravida rutrum quisque non. At urna condimentum mattis pellentesque id nibh tortor id. Suscipit adipiscing bibendum est ultricies integer quis.

Lobortis elementum nibh tellus molestie nunc non blandit massa enim. Eget egestas purus viverra accumsan in nisl nisi scelerisque. Arcu felis bibendum ut tristique et egestas. Donec et odio pellentesque diam volutpat commodo sed. Egestas tellus rutrum tellus pellentesque eu tincidunt. Feugiat sed lectus vestibulum mattis. Ultrices neque ornare aenean euismod elementum nisi. Morbi non arcu risus quis varius quam. Sagittis nisl rhoncus mattis rhoncus urna neque. Egestas dui id ornare arcu odio ut sem nulla.

Quis enim lobortis scelerisque fermentum. Blandit aliquam etiam erat velit scelerisque in. At varius vel pharetra vel turpis nunc. Convallis posuere morbi leo urna molestie at elementum eu facilisis. Fusce id velit ut tortor pretium viverra suspendisse potenti nullam. At lectus urna duis convallis convallis tellus id interdum. Molestie ac feugiat sed lectus vestibulum mattis ullamcorper velit sed. Vulputate enim nulla aliquet porttitor lacus luctus accumsan tortor. Viverra mauris in aliquam sem fringilla ut morbi tincidunt. Nunc sed id semper risus in hendrerit. Natoque penatibus et magnis dis parturient. Volutpat ac tincidunt vitae semper. Scelerisque eu ultrices vitae auctor. Orci ac auctor augue mauris augue.

Cras adipiscing enim eu turpis egestas pretium aenean pharetra. A iaculis at erat pellentesque adipiscing commodo elit at. Gravida rutrum quisque non tellus orci ac auctor. Habitant morbi tristique senectus et netus et. Consequat interdum varius sit amet mattis vulputate enim nulla. Aliquam vestibulum morbi blandit cursus risus at ultrices mi. Bibendum ut tristique et egestas quis. Sem integer vitae justo eget magna fermentum iaculis eu. Consequat interdum varius sit amet mattis vulputate enim. Justo donec enim diam vulputate ut pharetra. Mi in nulla posuere sollicitudin aliquam. Elementum facilisis leo vel fringilla est ullamcorper eget. Neque laoreet suspendisse interdum consectetur libero. Ut placerat orci nulla pellentesque dignissim enim sit amet venenatis. Donec massa sapien faucibus et molestie.

Read More
Blockchain

Crypto Capital Rotation: A How To Guide On Riding The Wave Of Inflows

Every bull run starts with a spark of capital inflows, something that excites those watching enough to cause FOMO. As a result of that FOMO, traders & paper holders get emotional about holding “this damn coin that just does nothing,”. All while watching others straight line up, then dump their positions at magically the wrong time.

It’s not about capturing the first wave of face melting profits. It’s about using that as an indicator to see how these things have actually worked out. There is one catch, however. You should only attempt this if you understand in order for this process to be successful, it must be observed and executed with little to no emotion. Also don’t listen to social media either or you will almost certainly fail.

Capital flows down just like water. That being the case, let me tell you what we do know. Every bull run that preceded us began with Bitcoin grinding up to the Fibonacci 0.50 mark. It was only when BTC crossed that mark that things got exciting. The 15-17 bull run will be the main focus of this article, due to a word count cap.

Step One – Where Do I Start?

Since the bear market lows, Bitcoin has been the safest bet until the .50 fib. After that we have to monitor our radar for what has technically broken out across medium cap stocks that are doubling (+/-) BTC’s gains in the same time frame. Rotate your allocated trading amount into it without excuses, no “hodling” based on feelings, or “the team”, etc. This is not so much about that, as it is about the current eyes on them. Also just like Solana this cycle, and Ethereum during the 15-17 run, there should be plenty of time to scale out.

Step Two – Rotation Time

After that, I scale profits into the fundamentally strongest large and medium caps. Currently the ETH/BTC reversal (since writing price has broken out up) indicates that, and its strongest within the family the ones to watch at the moment (as seen in the chart below).

Fortunately, with some trading education & experience, the timing of these things becomes much less of a guessing game. If you study Elliott’s Wave analysis, Wyckoff Schematics, chart patterns, volume, etc. When done correctly (as seen in the chart below) you can be on the bleeding edge of these runs. Which leads to a very happy Trading account.

Where I move weight to next has been at clear Fibonacci extensions of the runners, (which I’ve gauged from their prior movements). In this place I’ve seen it too many times to not understand and value that history may not repeat, but it often rhymes. You can most easily identify the next runners via their technical breakouts that took place as Bitcoin crept up the fib scale and corrected at the major POI’s (as seen on the chart below).

This mechanic runs down the line, all the way through the small caps, micro caps, NFT’s, etc. The way to catch massive gains is relatively easy in a bull market if you’re in it from the beginning. The next trick is to keep profits.

Step Three – Securing Profits

To retain profits there are a number of ways to gauge targets as mentioned before with Fibonacci extensions, volume paired with weekly candles, sentiment, Fibs, Elliott’s Waves and Wyckoff’s Distribution Schematics are more than enough to come out of each run with suitcases of profit. So if that’s something that’s important to you, either take the time to put the work in to learn for yourself or always be at the whim of others’ advice.

If you’re interested in what I’m doing and when keep a lookout on NewsBTC or follow me on Twitter for breakout and other relevant charts when I release them, as the run continues, or DM me if you want to learn.

I’ll leave you with a few warnings that I’ve tried to share with my students and people close to me, which are spoken from experience and only stated in hopes that these words will protect anyone reading this from the same hard lessons I and everyone I know in this place have found out the hard way, at least once…

When you feel invincible, take profits. When your extended family or friends start asking for your advice on buying crypto, take profits, and inversely when they tell you to sell, don’t. Finally, one of the most useful pieces of advice I’ve learned is, only ever aim for the “meat of the move” not the exact top.

Read More
Blockchain

XRP Price Surge: Crypto Analyst Predicts Various Bullish Scenarios In The Coming Days

Crypto analyst EGRAG crypto recently posted an analysis of the various scenarios for the price trajectory of XRP in the near future. XRP, like most top cryptocurrencies, has received many price predictions in the past few months, as the entire crypto market witnessed a consistent increase in activity throughout the fourth quarter of 2023.

However, predicting the future outlook of cryptocurrencies can be a very tricky endeavor, but this crypto analyst, known for his bullish stance on XRP, outlined different trajectories for XRP in the coming months, with some of them being more bullish than others. 

Fundamentals And Technicals Point To A Bullish XRP

XRP has been on a roller coaster ride this year. The crypto went through the first half of the year still carrying on the burden surrounding Ripple’s lawsuit with the SEC since 2020. By the second half of 2023, XRP became the first cryptocurrency with legal clarity in the US. This caused its price to skyrocket from $0.46 in less than 24 hours to $0.82, the highest point in 15 months. 

Despite the crypto still being up by 80.45% this year, the price has since corrected, and XRP is now trading at $0.6225. According to crypto analyst EGRAG’s analysis, the crypto is still in a bullish mindset that would send it over $1 in the coming months, a price level it hasn’t seen since November 2021.

#XRP Color Code To $1.4:

If #XRP triumphantly closes above the Fib 0.5 level at 0.57C with undeniable confirmation, we’re setting our sights on the $1.4!. This meteoric rise is just around the corner.

But remember, there’s more to this story! Dive into the color-coded clues… pic.twitter.com/DC0ss6Ip27

— EGRAG CRYPTO (@egragcrypto) September 21, 2023

XRP Price Scenarios and Potential Trends

Under the first scenario presented by EGRAG, XRP will reach $1.10 by February 2024. However, the crypto could revisit another swing low at $0.55 to $0.58 before making this bullish run. If this happens, it would make it much easier for the crypto to to achieve multiplier factors over 10X and 20X.

In the second possible outcome, XRP will surge to $1.4 in the first quarter of 2024. EGRAG noted that the eventual approval of spot Bitcoin ETFs in the US could turn out to be a sell-the-news event, which could see XRP crashing back down to $0.75 to $0.80 between July and September 2024. If this scenario were to play out, the $0.80 to $0.85 price level would become a strong “MACRO Resistance” for future price action.

In the third and most bullish scenario, XRP and the entire crypto market will surge alongside Bitcoin after the approval of spot ETFs in the US. As a result, XRP could easily surpass its current all-time high by March 2024 and might peak between $2.2 to $2.8.

It’s important to note that the crypto industry will become open to traditional investors by this point, including big Wall Street investors. EGRAG warned of potential manipulation of retail investors by the “big boys,” adding that “they are ruthless and only few will survive and emerge victorious.”

Featured image from Pexels

Read More
Blockchain

Worldcoin (WLD) Gains By 10% Following Singapore Debut

Worldcoin (WLD), the brainchild of OpenAI CEO Sam Altman, has experienced a significant level of positive traction in the past month. Notably, Worldcoin gained by over 50% in mid-December to attain an all-time high of $4.6. Although the token soon fell from these heights trading at $3.35 on December 25, it appears that WLD may be gathering momentum for another bullish breakout.

Singapore Launch, Among Others Spurs Interest In Worldcoin

According to data from CoinMarketCap, Worldcoin has gained by 9.68% in the last seven days, signifying a steady rise in buying pressure from investors in the WLD market. 

Using data from IntoTheBlock, popular crypto analyst Ali Martinez has given more insight into this bullish trend. On December 30, he shared via X that the number of WLD whales in possession of 10,000 to 100,000 WLD rose by 16.33% in the last week. Interestingly, this price increase and network growth occurred a few days after Worldcoin announced its expansion into the crypto-friendly nation of Singapore. 

#Worldcoin | The number of #WLD whales holding between 10,000 and 100,000 $WLD has increased by 16.33% over the past week! pic.twitter.com/ps9xzcMtVd

— Ali (@ali_charts) December 30, 2023


In a blog post on December 27, the crypto project stated that it had successfully set up physical screening locations in the Asian nation allowing interested users to undergo the World ID verification process and join its growing network. 

Beyond Singapore, Worldcoin also shared that it has registered an increased presence in several nations in the last month. These include Spain, Germany, Chile, and Japan. Notably, in Argentina, the crypto project recorded a national record of over 10,000 World ID verifications in a single day. Apparently, these multiple strides appear to have increased investor confidence in Worldcoin, as indicated in the price action stated above. 

WLD Price Prediction

Based on recent developments surrounding Worldcoin, the token seems poised for a major boost in adoption which could translate into a price rise over the next few weeks. Aside from its expansion into new nations, the launch of the World ID 2.0 in mid-December, which introduced integrations with various Apps such as Reddit, Shopify, and Telegram, is also regarded as a positive development by the project’s growing number of users. 

Interestingly, Martinez predicts that WLD could soon experience an 80% rally based on chart indicators alone. If this projection proves true, the altcoin could trade as high as $6.30.

However, despite all these indications, it must be noted that Worldcoin remains under heavy regulatory scrutiny in some nations due to privacy concerns in regard to user data.

Worldcoin operations have been actively suspended in Kenya and are under investigation in Germany and the United Kingdom. In fact, the crypto project recently halted its orb verification service in Brazil, France, and India although citing a “limited time access” on the screening orbs provided in these markets.

At the time of writing, WLD trades around $3.73 with a 3.90% gain on the last day. In tandem, The token’s daily trading volume increased by 83.12% and is valued at $197.52 million. 

Read More
Blockchain

Bitcoin ETF: SEC May Notify Approved Issuers To Launch Very Soon – Here’s When

According to a recent report from Reuters, the US Securities and Exchange Commission (SEC) may notify the asset managers looking to launch a spot Bitcoin ETF (exchange-traded fund) if their applications have been approved as soon as next week. 

SEC To Notify Applicants Of Its Decision By Next Week: Reuters

On Saturday, December 30, Reuters reported that the SEC may notify the 14 Bitcoin ETF applicants if their applications will be approved by Tuesday or Wednesday next week. This move would come ahead of the January 10 deadline for the agency to decide whether or not to green-light the ETF application by Ark Invest and 21Shares.

Citing people familiar with the process, Reuters highlighted that asset managers that met their end-of-the-year filing revision deadlines may be able to launch by January 10, 2024. Some of the firms that recently updated their Bitcoin ETF filings with the SEC include Black Rock, Van Eck, Bitwise, WisdomTree, Invesco, Valkyrie, and Fidelity.

Notably, Fidelity Investments revealed more information and technical details about its potential ETF product in its S-1 form update. The asset management firm hopes to beat fellow applicants in winning investors over by proposing the lowest sponsor fee at 0.39%.

Invesco announced a 0.59% rate while offering a fee waiver on the first $5 billion in assets within the first six months after launch. Meanwhile, BlackRock, the world’s largest asset manager and a frontrunner in the Bitcoin ETF race, unveiled Jane Street Capital and JP Morgan Securities as its authorized participants in its updated application. 

From the latest development, it seems the SEC is looking to wrap up the Bitcoin ETF chapter as soon as the new year arrives. Nonetheless, Reuters’ latest report adds optimism to the possibility of the agency approving several ETF applications by January 10.

How Bitcoin ETF Approval Could Impact Price

There have been wide speculations on the possible effects of the ETF approval on the Bitcoin asset. Options platform Greeks.live has offered insight into the potential impact of the exchange-traded fund on the value of the premier cryptocurrency.

There is news in the market that the SEC will pass the Bitcoin Spot ETF application as early as next Tuesday, but there was little volatility across the major term IVs and the price.Looking at the options data, Jan12 options IV, which is strongly correlated to the ETF, fell… pic.twitter.com/f1B4ZPC05d

— Greeks.live (@GreeksLive) December 31, 2023

Using options data, Greeks.live believes that the market has priced the potential approval of the Bitcoin ETF, and it may not yield greater returns for the asset. This means that the market has already factored in this information, and any positive development might not lead to significant price movement.

According to the platform, this reasoning is based on the little volatility observed across the major term implied volatilities (IVs) and the price of Bitcoin. For context, implied volatility reflects the market’s expectation of how much an asset will move in the future. 

However, options IV on January 12, which is believed to be strongly correlated to the Bitcoin ETF, decreased rather than increased. This lack of volatility and decrease in implied volatility of options suggests that there may not be a substantial impact on the Bitcoin price, even with significant news on the horizon. 

As of this writing, Bitcoin is valued at $42,154, reflecting a mere 0.4% in the past day. The price of BTC has increased by more than 150% this year, partly due to the anticipation of a Bitcoin spot ETF.

Read More
Blockchain

Bitcoin Spot ETF: Bitwise Closes Ranks With $200 Million Seed Fund

The competition among the Spot Bitcoin ETF issuers is heating up as the period for potential approval of these funds draws nearer. Asset manager Bitwise is the issuer currently making waves as it could potentially outrank the world’s largest asset manager, BlackRock, in terms of seed funds for their respective ETFs. 

Bitwise’s Bitcoin ETF Could See $200 Million Seed Fund

Bitwise’s latest amendment to its S-1 filing with the Securities and Exchange Commission (SEC) shows that the asset manager has gotten interest from an investor to have its ETF seeded with $200 million upon launch. Bloomberg analyst Eric Balchunas highlighted its significance as he stated that it “blows away” BlackRock’s initial seed fund of $10 million. 

The analyst noted that Bitwise actually seeding its ETF with such an amount could be a “huge help” in the early days of the race. It is believed that the SEC is likely to approve the pending ETF applications simultaneously. As such, Bitwise being able to create $200 million of shares could give the asset manager an advantage in terms of meeting demands by clients. 

Bitwise had previously shown its intention to lead the way from the get-go following the release of its Bitcoin ETF commercial. This move could help the asset manager gain much interest in its Bitcoin ETF even before launch. That way, the public sees it as the first choice upon launching.

Notably, Bitwise didn’t mention who the authorized participant (AP) for its ETF would be. The AP would act as the middleman between the ETF investor and issuer, as they are responsible for creating and redeeming the ETF shares. While Bitwise failed to name its AP, other issuers like BlackRock however included it in their latest S-1 filing with the SEC. 

BTC ETF Issuers Show Their Hands In Latest Wave Of Filings

Spot Bitcoin ETF issuers made some notable inclusions in their latest and final amendment to their S-1 filings. These inclusions also give an idea of what strategy these issuers may be looking to adopt in order to lure investors to their funds. In Fidelity’s case, the asset manager will be looking to entice investors with its relatively low fees.

Balchunas noted that Fidelity’s ‘sponsor fee’ of 0.39% happens to be the lowest so far among other issuers that have made theirs known. Interestingly, Invesco is adopting a more enticing strategy as they revealed in their latest amendment that they will be waiving fees for the first six months and the first $5 billion in assets. 

The Bloomberg analyst mentioned that the fee war is going to continue being a thing in the Spot Bitcoin ETF terrain as issuers will be looking to outdo themselves. 

Read More
Blockchain

Dogecoin And XRP Beat Out Cardano And Solana To Secure New Milestone

Kaiko, a blockchain analytics platform, conducted an investigation that revealed the complexities of liquidity across the biggest crypto assets, with some lower market cap assets beating higher ones. According to its Q3 liquidity rankings, XRP and Dogecoin (DOGE) managed to beat out Solana and Cardano in liquidity rankings, coming in behind only Bitcoin and Ethereum. There were also some surprise numbers on the rankings, like BNB coming in 8th in terms of liquidity, and Litecoin also outperforming.  

Kaiko Analysis Highlights Liquidity For Crypto Assets

The vast number of crypto assets has always brought out the idea among investors to rank their valuation on a scale of some sort, with the most adopted being the market cap. However, according to Kaiko, liquidity, along with other metrics like volume and market depth is a better way to measure a token’s real value apart from its market cap. This was best demonstrated by FTX’s token FTT, whose market was bloated to reach a peak of nearly $10 billion without having enough liquidity on exchanges to back this up.

According to its latest rankings, Bitcoin took up the first spot in liquidity. This wasn’t surprising, as Bitcoin has always held a tight reign over the crypto industry since its inception. Ethereum followed in second place in terms of liquidity to reiterate its position as the king of altcoins. However, Kaiko’s liquidity rankings started to digress from the market cap at the third position, with BNB underperforming massively to come in at 8th place. 

Instead, XRP came in at 4th place, beating out the likes of Solana and Cardano (the Ethereum killers) on exchanges among traders. XRP’s liquidity boost in the quarter was thanks to the asset receiving regulatory clarity in the US. Dogecoin came in at 5th place, despite being 10th on market cap rankings, to solidify its position as the leader among meme coins. Litecoin came in at 5th place to complete the top five, despite being 18th in market cap rankings.

On the other hand, AVAX’s liquidity ranking dropped 11 places when compared to its market cap, while TON came in at 37th place despite being 9th by market cap during the quarter. Also, ATOM, UNI, APT, TON, SHIB, OKB, LEO, and CRO all fell more than five spots.

What Does Liquidity Say About Dogecoin And Crypto Assets?

Kaiko’s measure of liquidity included the spread and the average daily trading volume on different exchanges. The analytics platform also included two different market depth levels; 0.1% for higher frequency traders and 1% for longer-term holders.

In terms of trading volume, BTC came in first place while ETH and XRP followed suit. However, SOL beat DOGE in this metric with around $2 billion in the quarter.

The bottom line is that greater liquidity often precedes greater success over the longer term for cryptocurrencies. Q4 2023 should tell a strong tale in terms of crypto liquidity, as most cryptocurrencies registered new yearly highs in terms of market cap.

Featured image from Shutterstock

Read More
Blockchain

Shiba Inu Burn Rate Spikes Over 2,700% Despite Market Slowdown

Shiba Inu’s price action has been on a consolidation activity since the beginning of the week. However, the Shiba Inu community has ramped up SHIB burn activities in the past 24 hours, pushing the burn rate up by more than 2,700%. What this means is that SHIB holders have been sending large amounts of the meme coin to unrecoverable wallets, reducing the total supply amidst efforts to push the price up. 

Shiba Inu Burn Rate Skyrockets In 24 Hours Amid SHIB Decline

SHIB tokens are normally burned sporadically, and any investor can burn tokens by sending them to any of the three SHIB burn addresses. Members of the Shiba Inu team have increased sensitization efforts in recent months to increase the burn rate of community members. 

According to information obtained from the official SHIB burn tracker, Shibbburn, the Shiba Inu burn wallets have witnessed an influx of burn transactions in the past day. These burns came in from four major transactions, with the highest being 13,140,241 SHIB tokens burned in one go from address “0xa034”. As a result, the SHIB burn rate spiked by a whopping 2,752% with more than 14.8 million SHIB incinerated in total. This is in stark contrast with the previous day’s figures which came out at around 2.5 million SHIB tokens sent to the burn addresses.

The Shiba Inu team has been particularly active with SHIB burns, burning a total of 33.8 billion tokens in four transactions this month. In all these, the SHIB community has removed 410.69 trillion tokens from the initial SHIB token supply. At the time of writing, Shiba Inu’s circulating supply stands at 581 million tokens.

SHIB Trades In Tight Range

SHIB, on the other hand, has been trading inside a narrow price range for approximately a week now, with the upper resistance of $0.000011 and the support of $0.00001067 serving as the two main points of contention. There has been a relative lack of reaction to token burns this week, as the cryptocurrency is currently trading at $0.00001054, which is a decrease of 1.5% over the past seven days. According to data from IntoTheBlock, 37.26% of addresses are in profit at the current price, compared to 42% profitability last week.

A larger 30-day timeframe shows SHIB has mostly reacted positively to the team’s large token burns. The second burn of 8.6 billion SHIB saw the crypto go on a strong spike lasting a few days which pushed its price to $0.00001165 on December 17. Despite the recent correction this week, the token is still holding on to 28.53% of its monthly gain. 

Featured image from Freepik

Read More