Crypto Corner Café

Taste The Future

Blockchain

Blockchain

Ethereum Price Momentum Reignites: Technical Signals Potential Surge To $2,600

Ethereum price retested the $2,440 resistance zone. ETH is consolidating gains and might soon attempt a fresh increase toward the $2,600 level.

Ethereum gained strength for a move above the $2,350 level.
The price is trading above $2,350 and the 100-hourly Simple Moving Average.
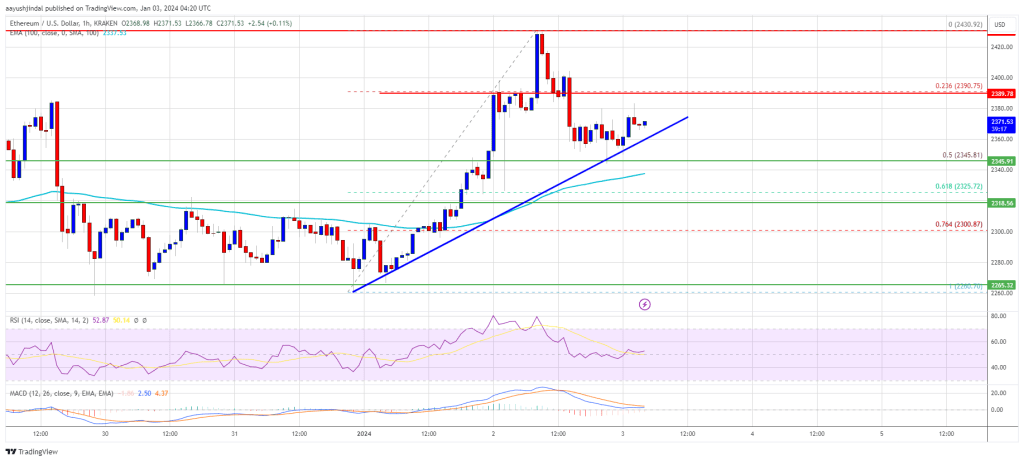
There is a key bullish trend line forming with support near $2,360 on the hourly chart of ETH/USD (data feed via Kraken).
The pair could continue to rise if there is a clear move above $2,430 and $2,440.

Ethereum Price Remains Supported

Ethereum price started a decent increase above the $2,300 level, like Bitcoin. ETH gained pace for a move above the $2,350 level to move into a positive zone.

The price even climbed above the $2,400 level. However, the bears appeared near the $2,440 resistance zone. A high was formed near $2,430 and the price is now correcting gains. There was a move below the $2,400 level. The price declined below the 23.6% Fib retracement level of the upward move from the $2,260 swing low to the $2,430 high.

However, Ethereum is still above $2,350 and the 100-hourly Simple Moving Average. There is also a key bullish trend line forming with support near $2,360 on the hourly chart of ETH/USD.

Source: ETHUSD on TradingView.com

On the upside, the price is facing resistance near the $2,390 level. The first major resistance is now near $2,440. A close above the $2,440 resistance could send the price toward $2,500. The next key resistance is near $2,550. If there is a clear move above $2,550, there could be a drift toward $2,620. The next resistance sits at $2,650, above which Ethereum might rally and test the $2,800 zone.

More Downsides in ETH?

If Ethereum fails to clear the $2,440 resistance, it could continue to move down. Initial support on the downside is near the $2,360 level and the trend line.

The first key support could be the $2,350 zone or the 50% Fib retracement level of the upward move from the $2,260 swing low to the $2,430 high. A downside break and a close below $2,350 might start another steady decline. In the stated case, Ether could test the $2,265 support. Any more losses might send the price toward the $2,200 level.

Technical Indicators

Hourly MACDThe MACD for ETH/USD is losing momentum in the bullish zone.

Hourly RSIThe RSI for ETH/USD is now above the 50 level.

Major Support Level – $2,350

Major Resistance Level – $2,440

Read More
Blockchain

Bitcoin Price Seems Unstoppable As BTC Bulls Aim For $48K

Bitcoin price is holding gains above the $45,000 resistance. BTC seems to be setting up for more gains above the $46,000 level in the near term.

Bitcoin extended its increase and traded close to the $46,000 level.
The price is trading above $45,000 and the 100 hourly Simple moving average.
There is a key bullish flag forming with resistance near $45,300 on the hourly chart of the BTC/USD pair (data feed from Kraken).
The pair could start a fresh increase unless there is a correction wave below $44,800.

Bitcoin Price Eyes More Upsides

Bitcoin price started a fresh increase above the $44,000 and $44,500 resistance levels. BTC even broke the $45,000 level to move further into a bullish zone.

A new multi-week high was formed near $45,900 and the price is now consolidating gains. There was a minor downside correction from the $45,900 level. The price dipped below the $45,500 level. It even tested the 23.6% Fib retracement level of the upward move from the $41,300 swing low to the $45,900 high.

Bitcoin is now trading above $45,000 and the 100 hourly Simple moving average. On the upside, immediate resistance is near the $45,300 level. There is also a key bullish flag forming with resistance near $45,300 on the hourly chart of the BTC/USD pair.

Source: BTCUSD on TradingView.com

The first major resistance is $46,000. A close above the $46,000 level could send the price further higher. The next major resistance sits at $46,800. Any more gains above the $46,800 level could open the doors for a move toward the $48,000 level.

More Downsides In BTC?

If Bitcoin fails to rise above the $45,300 resistance zone, it could start a downside correction. Immediate support on the downside is near the $44,800 level.

The next major support is near $44,000. If there is a move below $44,000, there is a risk of more losses. In the stated case, the price could drop toward the $43,600 support or the 50% Fib retracement level of the upward move from the $41,300 swing low to the $45,900 high in the near term.

Technical indicators:

Hourly MACD – The MACD is now losing pace in the bullish zone.

Hourly RSI (Relative Strength Index) – The RSI for BTC/USD is now above the 50 level.

Major Support Levels – $44,800, followed by $44,000.

Major Resistance Levels – $45,300, $46,000, and $46,800.

Read More
Blockchain

Arbitrum (ARB) Maintains Impressive 30% Price Uptrend, Analyst Predicts Breakout Above $2

Arbitrum (ARB), a prominent Layer 2 (L2) protocol, has emerged as one of the top gainers in the past month, experiencing a remarkable surge of 59%. Over the past 7 days, the token has grown substantially over 31%, propelling it to reach a new all-time high (ATH) of $1.8391 on Monday. 

Arbitrum’s Market Capitalization Surges To $2.21 Billion

The impressive price surge of ARB reflects the growing interest in the protocol and its native token within the Layer 2 ecosystem. This surge is evident when examining the data provided by Token Terminal, a leading analytics platform. 

According to Token Terminal’s data, Arbitrum’s market capitalization (circulating) is $2.21 billion, marking a significant increase of 56.18%. 

Additionally, the revenue generated by the protocol over the past 30 days amounts to $11.31 million, representing a substantial surge of 87.74%. 

The fully diluted market capitalization is $17.33 billion, reflecting the market’s positive sentiment toward the protocol’s potential. The revenue on an annual basis reaches $137.63 million, exhibiting an impressive growth of 106.63%.

Moreover, the strong performance of the market indicators, such as the P/F ratio (fully diluted) at 125.95x and the P/S ratio (fully diluted) at 125.95x, indicate robust investor confidence. 

The fees generated by the protocol over the past 30 days amount to $11.31 million, representing a significant increase of 87.74%. Additionally, the annualized fees reached $137.63 million, demonstrating a substantial growth of 106.63%. 

Furthermore, the data reveals that Arbitrum has a strong user base, with an average of 153,3100 active daily users over the past 30 days, highlighting its popularity and adoption. Even more encouraging is that a prominent crypto analyst foresees continued growth in price action for ARB.

Clear Uptrend In ARB Signals Potential Breakout

Renowned crypto analyst Michael van De Poppe has identified a clear and promising uptrend in the cryptocurrency ARB. 

Through his technical analysis, van de Poppe observes that the token has been consistently experiencing “beautiful retests” of previous resistance levels, which have now transformed into strong support zones.

If the current price trajectory continues, Michael van De Poppe suggests that investors should keep an eye on a potential optimal “go-to zone” for ARB between $1.50 and $1.60. 

This zone represents a strategic level where the token may experience a retest before deciding to break the psychological barrier of $2.

It remains to be seen if this prediction will come true and how ARB’s price action will develop through the first half of 2024.

Featured image from Shutterstock, chart from TradingView.com 

Read More
Blockchain

Is A Bitcoin Spot ETF Approval A Sell The News Event? Experts Respond

All attention of crypto investors has turned toward January 10 when the first Spot Bitcoin ETF is expected to be approved. As usual, the excitement triggered by this has seen prices recover across the space, with no doubt about the bull sentiment leading up to the event. However, arguments have arisen about whether this bullish sentiment would continue if a Spot ETF is eventually approved or if it will end up being a “sell the news” event.

What Is A Sell The News Event?

The phrase “sell the news” is popular in investing circles and is usually associated with a major event that ends up moving prices. BlackRock and 12 other asset managers filing for Spot Bitcoin ETFs with the US Securities and Exchange Commission (SEC) is an example of such a major event.

When the event is positive, it has a good impact on assets in the industry, and in the case of crypto, the prices of Bitcoin and other cryptocurrencies begin to rise. This is usually from the anticipation surrounding the event and investors taking up positions in order not to miss a major move. Mostly, this is because investors expect that the main event, such as the approval of a Spot Bitcoin ETF, would trigger further price increases.

However, this is not always the case for the market. There have been instances where the main event actually sees prices fall across the board. Such a case is referred to as a “sell the news” event as prices are expected to decline as the euphoria reaches its climax.

The potential approval of a Spot Bitcoin ETF has been argued to be a ‘sell the news’ event by many in the space, given that prices have already gone up so much. However, not everyone believes this is the case as crypto experts begin to chime in.

Spot Bitcoin ETF Not A Sell The News Event

One of the first crypto experts to share their thoughts around this is Andrew Kang. Kang took to X (formerly Twitter) to explain that the Bitcoin price is actually still mispriced even after rising more than 100% in one year to cross $45,000.

Kang explains that a Spot Bitcoin ETF approval would see all of these asset managers trying to grab between $10 and $20 billion in fees. They will also be pushing for marketing which Kang believes every dollar spent on marketing in 2024 becomes even more important in 2025.

“When you think about the size of the opportunity, it shouldn’t surprise us to see marketing/ad spend on the scale of 2021 bull madness,” Kang said. “When you consider the importance of timing for issuers, maybe we even take it a level further. It’s going to be a bonanza.”

Also responding to and buttressing Kang’s point is @ChainLinkGod who gave their own insight into how bullish an approval is. They explain that all of the asset managers who have filed for Spot ETFs are inherently long on Bitcoin.

“Yes, they don’t technically have any directional exposure, but all else equal, a 10x in the price of bitcoin is a 10x in yearly management fees,” ChainLinkGod explains. They further add that each applicant will be looking to become the dominant player as this means they will be able to harvest billions of dollars in fees passively for years.

“All of which involves massive ad spend, shilling $BTC at every public appearance, and advising all their clientele *this year* to get exposure to $BTC via their ETF,” they explain. Given this, a potential approval is more bullish than bearish for Bitcoin as the players struggle for dominance.

Read More
Blockchain

3 Under The Radar Altcoins Expected To Hit $100 Before The Bitcoin Halving

With the Bitcoin halving expected to happen today, crypto enthusiasts are already starting to take positions in various altcoins. Among these, there are a number of coins that have shown a lot of promise when it comes to reaching the $100 price mark and this report takes a look at three.

MoonRiver (MOVR) Tops Lists Of Altcoins To Reach $100

The MoonRiver (MOVR) token has been one that has flown under the radar for quite a while now. This has to do with the fact that the price of the altcoin fell from its all-time high of $485 to as low as $5 earlier in 2023. However, this has not eradicated the bullish narrative for the asset.

So far, as the crypto market has recovered, the MOVR token has seen one of the most significant rallies. In the days leading up to Christmas, the price would go from around $6 to as high as $44 in a couple of days, notching 700% gains during this time.

Since then, the price has since retraced and fallen around 50%. But with the price still holding above $20, it shows a lot of promise for the coin. Given its low supply of around 11 million coins and a tendency to rise quickly in a short time, MoonRiver is one of the coins poised to break the $100 mark.

Litecoin (LTC) Slow Movement Coming To An End

The Litecoin price rallied tremendously in 2023 leading up to its halving and was among some of the best-performing altcoins. However, once the halving was completed, the LTC price would crumble and fall into a slow and steady decline. However, this has changed as the coin’s price has begun to pick up steam once again.

With the Bitcoin reversal, the Litecoin price is on the up once again, briefly crossing $75 in the early house of Tuesday. The altcoin, which is often referred to as the digital silver, could be poised to see firmer rallies, especially as the Bitcoin halving draws closer, which is often a catalyst for the bull market. If this continues, then LTC could easily cross $100.

Avalanche (AVAX) Sees An Awakening

Just like Solana (SOL), the Avalanche network has undergone an awakening that has brought investors back to the chain. As a result, the AVAX price has rallied, going from its 2023 low of around $9 to as high as $47 in December 2023.

As the new year rolled around, the Avalanche network has continued to enjoy attention from crypto investors and this has helped it maintain its bullish momentum. Just like MoonRiver (MOVR) and Litceoin (LTC), Avalanche (AVAX) is another token expected to cross the $100 mark.

Read More
Blockchain

Sei V2 Code Is “Functionally” Complete, Audit Ongoing: New All-Time High Incoming?

Taking to X on January 2, Jay Jog, the co-founder of Sei, Sei V2, is functionally “code complete” with Zellic and OtterSec, two blockchain security firms, auditing the code base. This development comes as the platform’s native coin, SEI, continues to surge, reaching all-time highs just four months after the launch of the high-performance blockchain in August.

What’s The Big Deal About Sei V2?

Once it launches in Q1 2024, Sei V2 will introduce a parallelized Ethereum Virtual Machine (EVM). According to developers, this model combines the best features of Solana and Ethereum, possibly driving Sei adoption and propping up SEI prices.

Of note, the Sei V2 code base will introduce three major upgrades. One is that Sei Network will now be compatible with Ethereum following the planned support for the EVM. Herein, Sei aims to leverage Ethereum’s popularity, especially among developers, tooling, and wallets. 

The goal, Jog explained in a post on X, is to ensure the integration is smooth without compatibility issues. With V2, Sei users will connect with the mainnet using popular Ethereum and EVM-compatible wallets like MetaMask.

However, a big addition in Sei V2 will be the actualization of Optimistic Parallelization. This feature will give developers more flexibility and leeway, preventing them from defining dependencies between transactions. Instead, Sei developers say this option allows the blockchain to automatically handle parallelization for transactions to be processed efficiently and cheaply.

To enhance full node efficiency and mitigate state bloat, Sei V2 introduces SeiDB as a new storage method. Implementing this update is expected to maintain Sei Network’s resilience while improving its performance.

Sei To Outperform Ethereum Layer-2s, Will Prices Follow Suit?

How SEI prices will react once this update is integrated remains to be seen. For now, developers are upbeat, claiming that Sei V2 will drastically enhance the mainnet capability, allowing it to process transactions faster than Ethereum layer-2 solutions like Base and Arbitrum. In November, Jog claimed that Sei V2 had a theoretical throughput of 12,500 TPS.

Ahead of this, SEI bulls are resilient, and prices continue to trend higher. SEI is already up 11X after launching in August 2023, trading around all-time highs. 

Looking at the candlestick arrangement in the daily chart, buyers are pushing higher, with the bull bar of January 1 thrusting the coin to new levels. For traders, key support levels to watch in the days ahead are $0.55, marking January 1 lows, and $0.40, if there is a cool-off.

Read More
Blockchain

Top 5 Events That Shook Up The Crypto Industry In 2023

In the year 2023, the crypto industry witnessed a series of events that left a long-lasting impact on the crypto landscape. From the start of the Spot Bitcoin ETF mania to the increase in regulatory enforcement on major crypto organizations, 2023 was nothing short of a rollercoaster ride for crypto enthusiasts and institutional investors alike. So here are the top 5 events that shook the crypto industry to its core in 2023.

Blackrock Spot Bitcoin ETF Rocks Crypto

The world’s largest asset management company, BlackRock was the first major traditional investment firm to apply for a Spot Bitcoin Exchange Traded Fund (ETF). BlackRock submitted its application for a Spot Bitcoin ETF to the United States Securities and Exchange Commission (SEC) on June 15, 2023. 

Following the asset management firm’s application, various companies like Grayscale, Ark Invest, WisdomTree, VanEck, and others followed suit. Despite consistent approval delays by the US SEC, BlackRock utilized the time to revise its Spot Bitcoin ETF filing, incorporating cash redemptions to improve the fund’s approval odds. 

Sam Bankman-Fried Fraud Conviction

Founder and former CEO of failed crypto exchange, FTX, Sam Bankman-Fried was found guilty of all seven counts of fraud, conspiracy, and money laundering on November 2, 2023. 

The 31-year-old billionaire was convicted unanimously by the jury for misappropriating billions of dollars of customer funds and defrauding lenders to subsidiary company, Alameda Research. Bankman-Fried could potentially face a maximum of 115 years in prison. His sentencing date is scheduled for March 28, 2024. 

CZ Resignation From Binance Causes A Stir In Crypto Community

One of the most shocking events of 2023, saw the founder of Binance, Changpeng Zhao officially stepping down from his role as the CEO of Binance on November 21, 2023. 

The former Binance CEO pleaded guilty to breaking US anti-money laundering laws and resigned as part of a $4.3 billion settlement by the United States Department of Justice (DOJ).

CZ has also been restricted from leaving the United States until his court case is over as the court believes his vast resources make him a potential flight risk. And returning to Dubai which does not share an extradition treaty with the US could make things problematic.

XRP Ruling In SEC Case

Coming as a major victory in a three-year-long legal battle between Ripple and the SEC, US District Judge Analisa Torres ruled in favor of Ripple on July 13, 2023. The ruling declared that programmatic sales of XRP did not qualify as a security. 

This decision offered much-needed regulatory clarity for XRP, enabling the cryptocurrency to resume trading on major crypto exchanges that had delisted it during the SEC’s 2020 lawsuit.

Grayscale And Coinbase Rage Against The SEC

On August 29, 2023, world-leading crypto asset management company Grayscale won its lawsuit against the US SEC. The D.C. Circuit Court of Appeals gave a final ruling to the regulatory agency to terminate its rejection of the asset management’s Spot Bitcoin ETF application. 

On a similar note, Coinbase, one of the largest US crypto exchanges, filed a lawsuit against the SEC in April 2023 aiming to compel the regulator to provide regulatory clarity for the crypto industry. 

Subsequently, the SEC sued Coinbase on June 6, 2023, alleging that the crypto exchange had violated securities laws by operating as an unregistered broker. As a result, Coinbase formally requested the court to dismiss the SEC’s case against it. However, the case is still ongoing.

Read More
Blockchain

Bitcoin At $45,000 Is Mispriced, Will Race For ETF Fees Push Prices To Record Highs?

Most analysts are optimistic that the impending launch of spot Bitcoin exchange-traded funds (ETFs) in the U.S. could propel the coin to new heights, way above the $69,000 mark registered in November 2021.

Andrew Kang, co-founder of Mechanism Capital, believes that Bitcoin at $45,000 is still grossly undervalued. This is given the anticipated influx of institutional investment from ETFs, and the effort issuers will put into marketing their products as they aim to accrue billions in fees in the months ahead.

Learning From Gold And Quest For Fees

Kang points to gold ETFs, which hold over $120 billion in assets under management (AUM) and generate an estimated $720 million in annual fees for their issuers. ETF issuers will charge a management fee to cover the costs associated with operating the ETF, including custody of coins and trading. Additionally, a fee will be charged through the bid-ask spread whenever Bitcoin is traded.

When trading and management fees are stacked, Bitcoin issuers could generate billions of dollars yearly, especially if trading volume is high. By Kang’s estimation, Bitcoin ETF issuers might generate between $10-20 billion in annual fees.

However, this is subject to dominance. After the Securities and Exchange Commission (SEC) approves multiple spot ETFs, issuers, including BlackRock and Fidelity, are expected to wage an aggressive battle for market share. 

The goal for issuers is not only to ensure that funds spent on advertising yield, but for every dollar spent, more is generated into the future. This is critical because investors are less likely to switch once they choose an ETF, making early dominance crucial for long-term revenue generation.

Is Bitcoin Ready For A 10X?

According to observers, issuers will promote Bitcoin at every opportunity. This is why ChainlinkGod while responding to Kang’s post on X, thinks Bitcoin will also likely track 10X in the sessions ahead since all issuers are “inherently long” on Bitcoin.

Looking at price charts, Bitcoin continues to edge higher, recently rising to as high as $45,800, according to price data. At this pace, BTC bulls extended gains of 2023. This will be as the community expects the SEC to approve the first Bitcoin ETFs. Even so, it is unclear when the agency will greenlight this product immediately. 

BTC has critical support at around the $44,000 zone, marking 2023 highs. If bulls maintain prices above this line, the odds of the coin rising to $50,000 in a buy trend continuation pattern will likely increase.

Read More
Blockchain

Bitcoin Trend Strength Exhibits Striking Similarities With Last Bull Run

Bitcoin price is above $45,000 for the first time since April 2022 and according to the weekly Average Directional Index, the rally might not be stopping anytime soon. That’s because the trend strength measuring tool is beginning to show shocking similarities with the 2021 bull run.

Bitcoin Bull Run Deja Vu: 2021 Versus 2024

When Bitcoin is trending, it is wise to get out of the way. The same is true regardless of whether or not BTCUSD is in an uptrend or a downtrend. Currently, the top cryptocurrency by market cap is in an uptrend, according to the Average Directional Index.

The tool is designed to measure the strength of a trend on any timeframe. When the ADX is growing and rises above 20, it suggests there is an active trend in play. Below 20, and there isn’t enough evidence of a trend, which could suggest sideways price action.

Not only is the weekly ADX in Bitcoin above 20, but is is above 51. Reaching above 51 in late 2020, resulted in four-week-long 120% push higher. If the same magnitude move follows, BTCUSD could hit $94,000 per coin by mid-February.

All About The Average Directional Index

The Average Directional Index is a trend-strength measuring tool designed by J. Welles Wilder, Jr., the creator of other technical analysis tools such as

The ADX reading in dark blue above shows the strength of a trend. The ADX, however, comes equipped with two Directional Indicators, the DI+ and DI-. Not only is the ADX in the exact location of the late 2020, early 2021 bull run, but the DI+ in green and DI- in red are also at the same level.

This could hint at the same ripe conditions for a parabolic rally. In 2021, Bitcoin peaked when the ADX reached 85 and began to tumble back downward. If BTCUSD exceeds this level, we could be looking at an even stronger rally than expected.

If it fails to reach above 85, yet sets a new all-time high, a bearish divergence could warn of an impending top in crypto. Whatever the case may be, the ADX could be an important tool in understanding cryptocurrency trends.

Read More
Blockchain

Bitcoin Price Targets: MVRV Points To $52,000 And $70,000 Levels For BTC, Expert Suggests

In a recent development, the Bitcoin price witnessed a remarkable surge of 7% within 24 hours, reaching a high point of $45,300. This significant price increase coincides with the anticipation surrounding the potential approval of a Bitcoin spot exchange-traded fund (ETF) by the US Securities and Exchange Commission (SEC). 

In addition, market experts, backed by multiple models aligning to indicate increased price action and bullish momentum, suggest that Bitcoin could soon reach the $50,000 level and potentially establish a new all-time high (ATH).

Bitcoin Price Poised To Reach New All-Time High? 

At the forefront of this analysis is Ali Martinez, a renowned crypto analyst, who emphasizes the valuable insights provided by the Bitcoin Market Value to Realized Value (MVRV) pricing bands. 

These bands serve as a metric to analyze the price movement and potential levels of Bitcoin, or any other cryptocurrency, by comparing the market value to the average value at which coins were last moved on-chain. The MVRV ratio assesses whether Bitcoin is overvalued or undervalued relative to its historical on-chain activity. 

A high MVRV ratio suggests that the market value of Bitcoin has surpassed the average value at which coins were last moved, indicating a potential overvaluation. Conversely, a low MVRV ratio may indicate that Bitcoin is undervalued.

Considering these factors, Martinez highlights the significance of the MVRV pricing bands, which reveal key price targets for Bitcoin at $52,680 and $70,250, surpassing its previous ATH of $69,000. 

This analysis presents an optimistic outlook for Bitcoin’s future performance and reinforces the belief among investors that the cryptocurrency’s upward momentum is likely to continue.

However, despite these Bitcoin price projections that could propel the largest cryptocurrency on the market into uncharted waters, another analyst points to a more prudent prediction.

Cooling Period For BTC? 

According to renowned crypto analyst Crypto Con, despite a year-long bullish stance, he believes it is time for a cooldown as the new year, 2024, begins.

Crypto Con predicts a 30% correction from the directional movement index (DMI) overheat zone, projecting prices around $30,000. The overheat zone mentioned by Crypto Con suggests that the price of Bitcoin has experienced a significant upward movement and may be due to a correction or cooling period. 

As seen in the chart above, when the price enters this zone, it is seen as a signal that the trend may have become overextended and could potentially reverse or experience a pullback.

Drawing parallels to the example in 2019, characterized by a double peak in red, Crypto Con anticipates a drawdown that is both smaller in magnitude and shorter in duration. 

Furthermore, the analyst points to the consistent support offered by diagonal green zones throughout each cycle, suggesting a pattern that has been held thus far.

While some analysts project a new all-time high for the Bitcoin price, reaching uncharted waters above $70,000, others, such as Crypto Con, advocate for a cooling period and anticipate a correction in the near term.

Featured image from Shutterstock, chart from TradingView.com

Read More